Bearish Bets: You Couldn’t Even Pawn Off These Three Ugly Charts
Let’s look at three nasty charts of a health care company, pawnshop name and a manufacturing and energy conglomerate.
You've reached your free article limit
You've read 0 of 1 free Pro articles.

It is not difficult to find poor performing charts in this market. In fact they are everywhere.
Let’s take a look at a few:
Molina Healthcare Breaks a Firm Uptrend
A massive blow to an uptrend by Molina (MOH) is quite severe and has flipped all of the indicators from bullish to bearish. Even as the lower 200 day moving average might serve as support, the stock this past week just knifed through the 50 day moving average with ease. Volume trends were elevated and have been on the down sessions, the moving average convergence divergence is on a solid sell signal while money flow, down toward the bottom of the chart, is about to go negative.
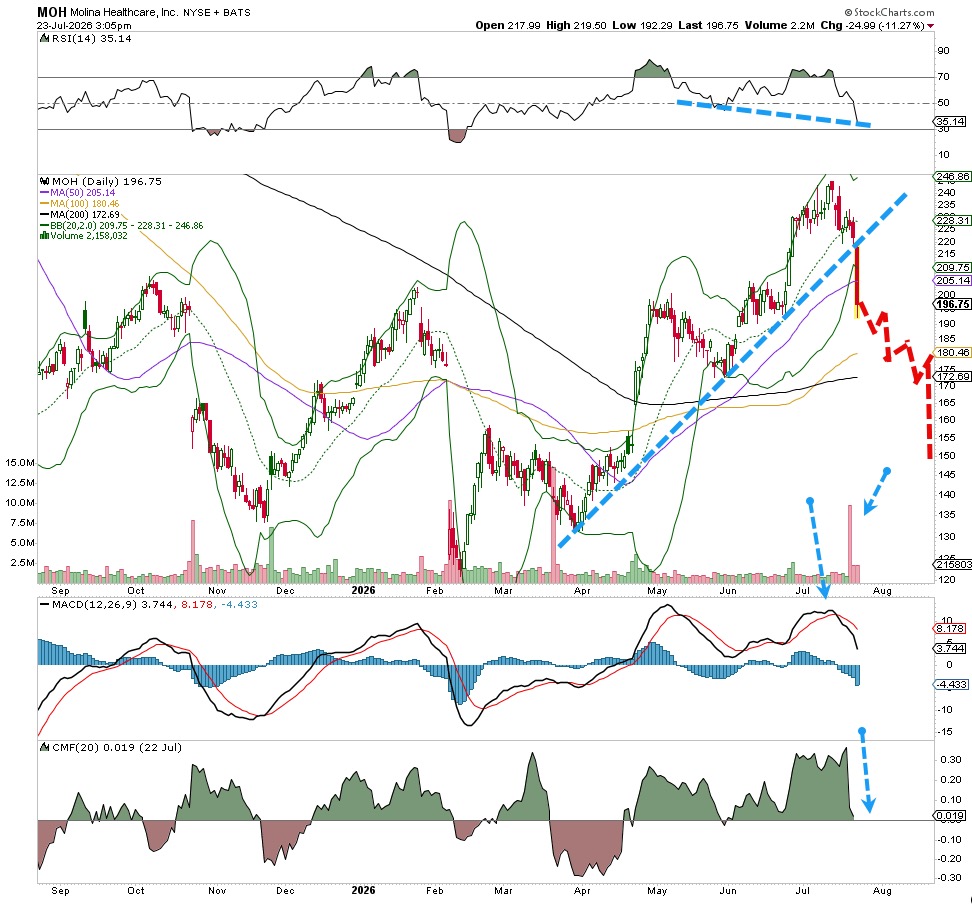
There are several areas to target for the downside, let’s first try the 200 day moving average at $172, then the gap at $150 or for a nice 24% move down from current prices. Just a really ugly chart here, put in a stop at $209 just in case.
First Cash Slips Badly
We could see the start of the failure in First Cash (FCFS) back in June when the stock broke hard against the 50-day moving average (in blue). The stock struggled to recover but continued to find more and more sellers, this week First Cash finally broke and fell sharply on heavy turnover. The money flow has been negative since early June, indicating big money is selling. The large move this week on heavy volume nearly tagged the 200 day moving average, that level will likely fall soon.
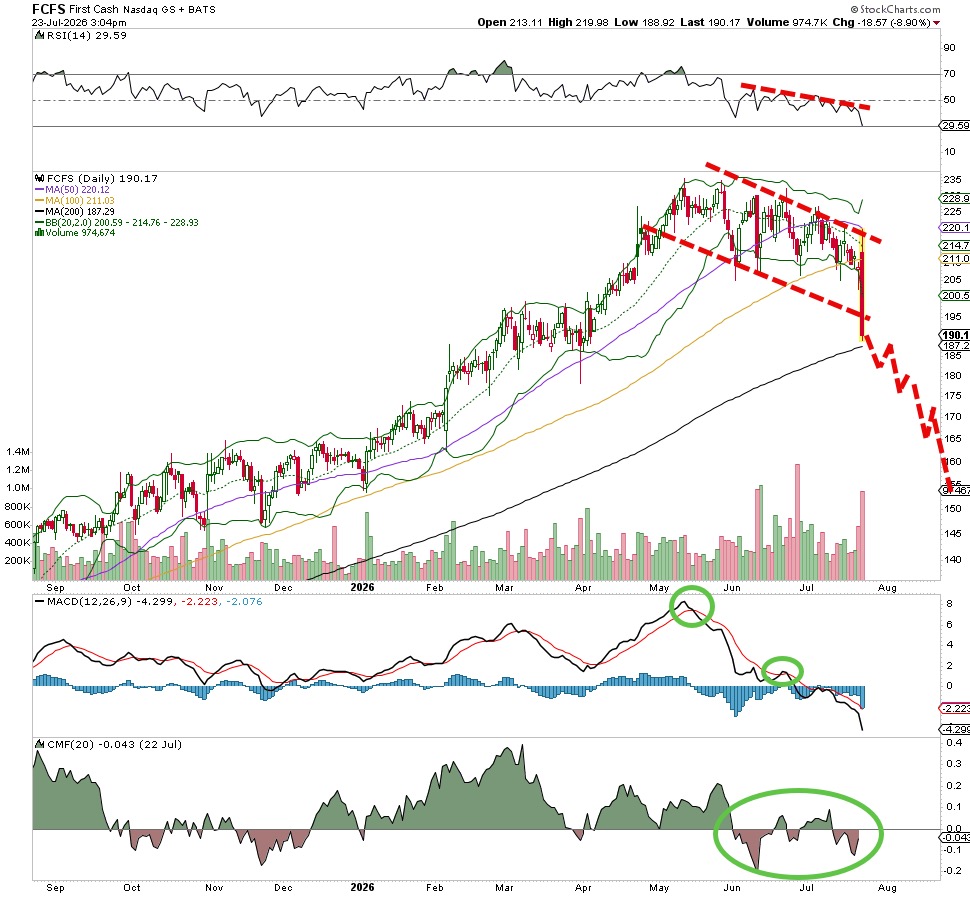
The MACD is on a sell signal as well. Let’s target some lower support at the $160 area and then even lower at $145. Just an ugly chart, but put in a stop at $211 just in case.
Dover Breaks Support and Looks to Test Lower Levels
Dover (DOV) was building a really nice base recently, though not trending at all. Lower-highs but higher-lows is our textbook definition of “no trend.” But, the sellers got active here recently and started to distribute the stock. The heavy turnover on July 23 is a clue that big money was getting out, but also the poor money flow at the bottom signaled the same. The MACD is firmly on a sell signal. Relative Strength is almost oversold, so there is an opportunity for more downside.
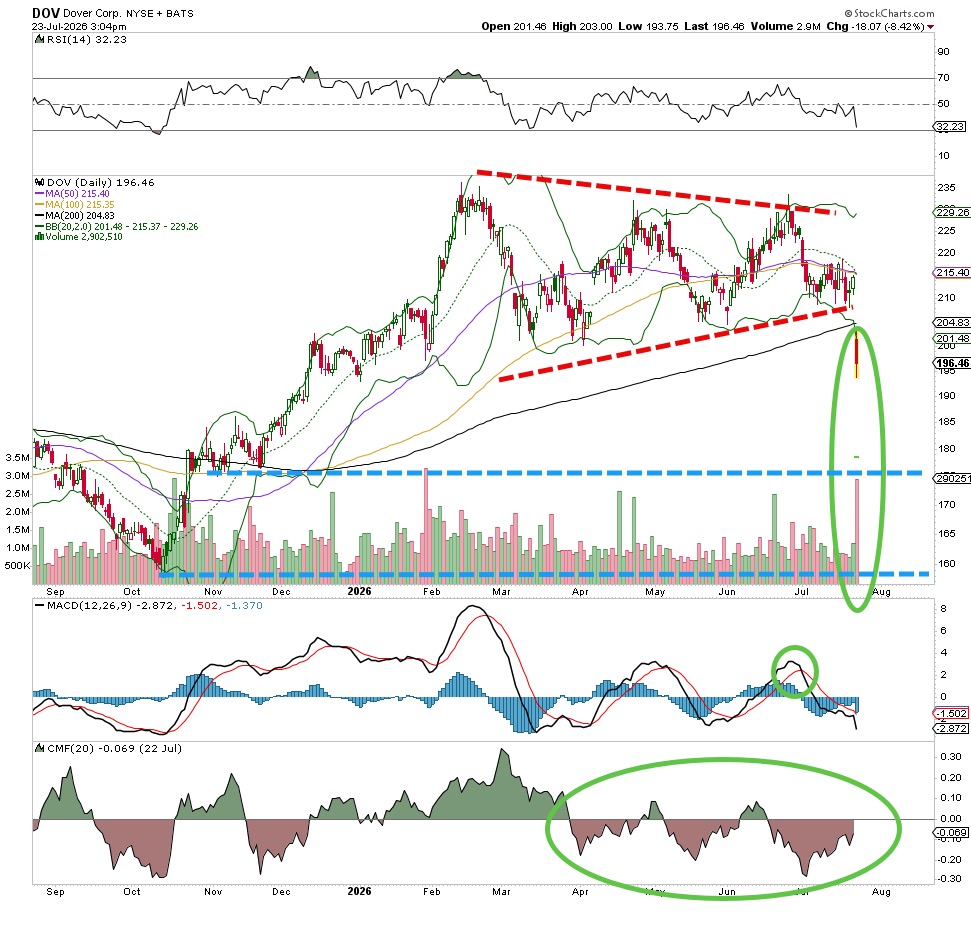
Let’s target the $175 area and then if it breaks the October lows at $155, which seems to be quite a move down. Buyers recently are going to be disappointed in this performance of late and start selling the stock, we should eventually reach the goal. Put in a stop at $215 just in case.
At the time of publication, Lang had no position in any security mentioned.
