People Think Market Breadth Is So Good. Why Are the Breadth Indicators So Bad?
Rather than rely on anecdotal evidence, let’s take a look at what matters, the indicators.
You've reached your free article limit
You've read 0 of 1 free Pro articles.

The Market
It is very difficult for the market to reach an extreme when we have an Either/Or Market, as we continue to have. An extreme arrives when everything tends to move together. It remains my view that tech ought to enjoy an oversold rally this week and that the others ought to play catch down in August.
Let’s start with the tech/semis. They are short-term oversold, or close to it. But the best rallies arrive when there is a whiff of panic –or as I like to call it, hysteria—in the air. I sense none of that. For example, the VIX was still solidly red on Friday. Or that volume in the QQQs remains tepid in the 30-40 million share range.
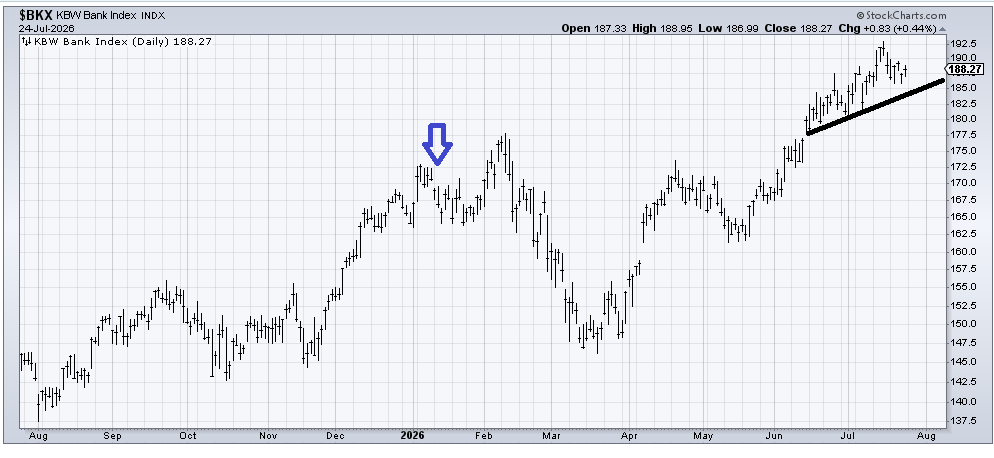
The put/call ratio for equities only got a little frisky Friday with a reading of .79, but in the last month, we have seen this metric as high as .85 and .86 on two occasions. I do, however, sense—and yes, it is anecdotal—a shift in sentiment. There are now front-page stories about AI (negative ones). Everyone is talking about the ‘broadening out’ rather than telling us how the market is just fine if it’s only the semis that rally. Folks are now recommending financials instead of tech, much the same way they did in January (arrow).
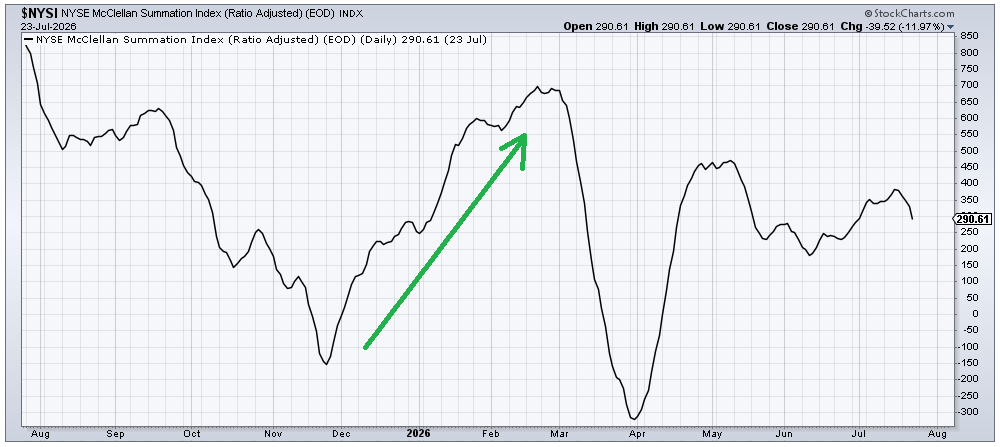
Let’s talk about the broadening out theme. If there is so much broadening out, then why is the McClellan Summation Index heading down, not up? Look at this chart and notice that rise from the November low to the February high—that’s what broadening out looks like. That is just not evident in today’s action, as this indicator of breadth has made a lower high (than May).
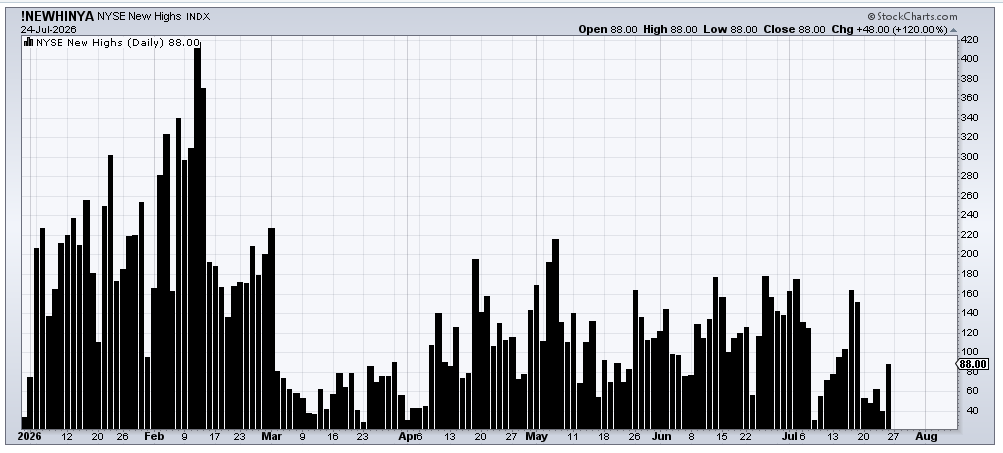
If the market is so broad, then why do we see a mere 86 stocks making new highs on the NYSE when there were more than twice that in May? Or I can note that there were more than four times that amount in February. You see the expansion in new highs on the left side of the chart? That’s what broadening out looks like.
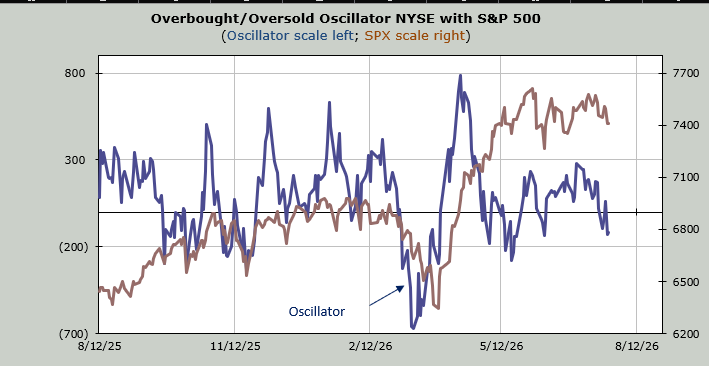
If the market is so broad, then why is the Overbought/Oversold Oscillator below the zero line? If it is so broad, then why is this indicator, which uses breadth as its input, so far below the May high? Again, please look at that period from the November low to February. The Oscillator stayed above the zero line for almost three months. Now it can barely lift itself up and over that zero line.
I will end with the chart of the Insider Selling Ratio. A month ago, I showed you this chart because it had spiked up to near 60. It backed off and is now back up over 40.
The market needs a proper correction, not an Either/Or Market. If we can get tech to rally over the next week, then it’s possible that set up is there for the month of August, where the others catch down to tech.
New Ideas
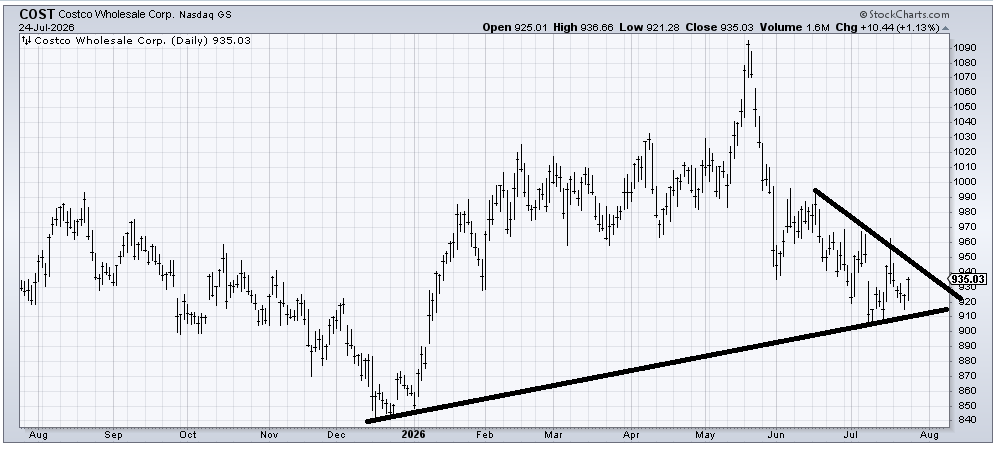
I recommended Costco (COST) a week ago, and it is pretty much the same price it was. But I was asked the question, why would COST rally? I never know why, but maybe the fact that I was asked that question tells us what the sentiment is toward it. So as long as it stays over that lower line (900-910) I think it should be given the chance to cross the downtrend line (940-950).
Today’s Indicator
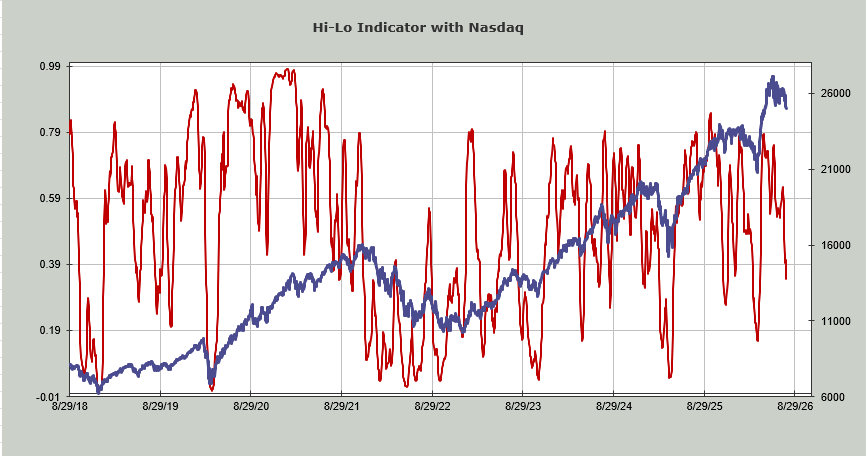
The new highs are discussed above. The Nasdaq Hi-Lo Indicator is at .35. Under .20, it gets intermediate-term oversold.
Q&A/Reader’s Feedback
Helene welcomes your questions about Top Stocks and her charting strategy and techniques. Please send an email directly to Helene with your questions. However, please remember that TheStreet.com Top Stocks is not intended to provide personalized investment advice. Email Helene here.
Note: almost all these stocks are due to report earnings the week of August 3rd.
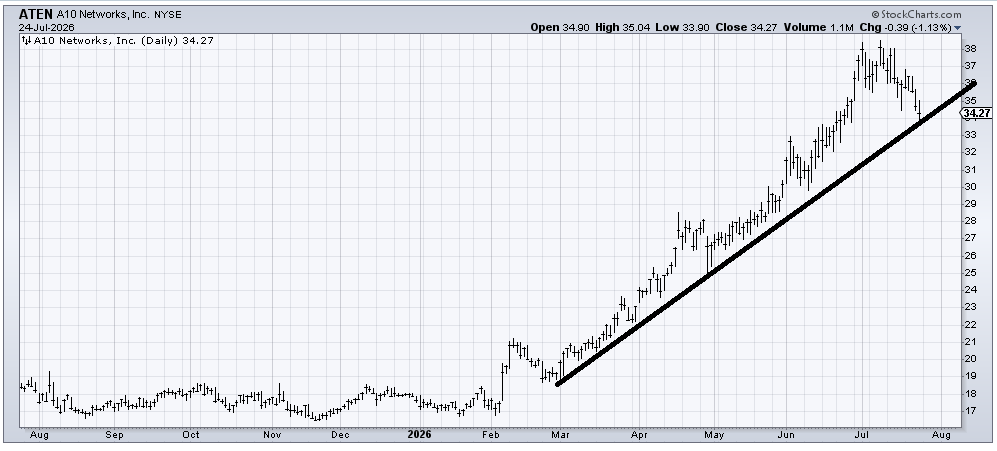
A10 Networks (ATEN) is the perfect example of a stock that is oversold and at support. It is also the perfect example of a stock that looks vulnerable. In my view any stock that rallies straight up as ATEN has, is vulnerable in this market. So, I would expect before the month of August is out, this line gets broken, and if I am wrong about that, it gets retested.
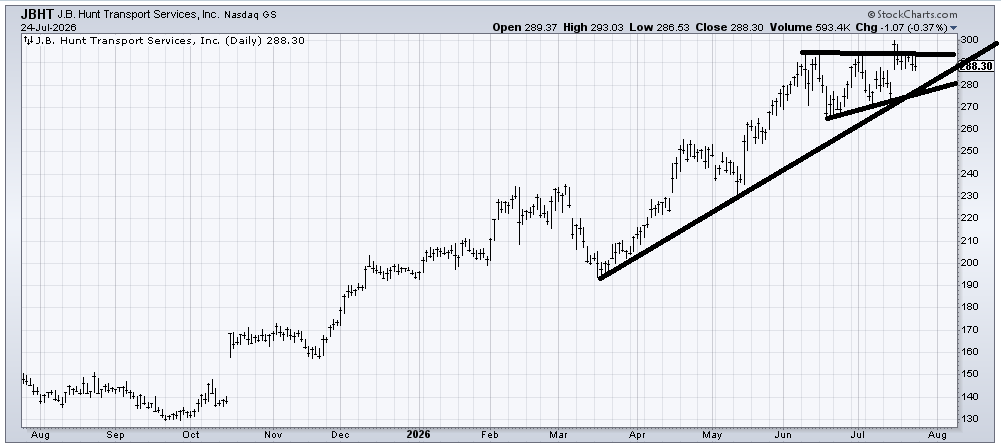
JB Hunt (JBHT) hasn’t done anything wrong yet, but in the market, it’s very difficult for me to like a stock that is up near its highs. I would not want to see it break under that 270-280 area.
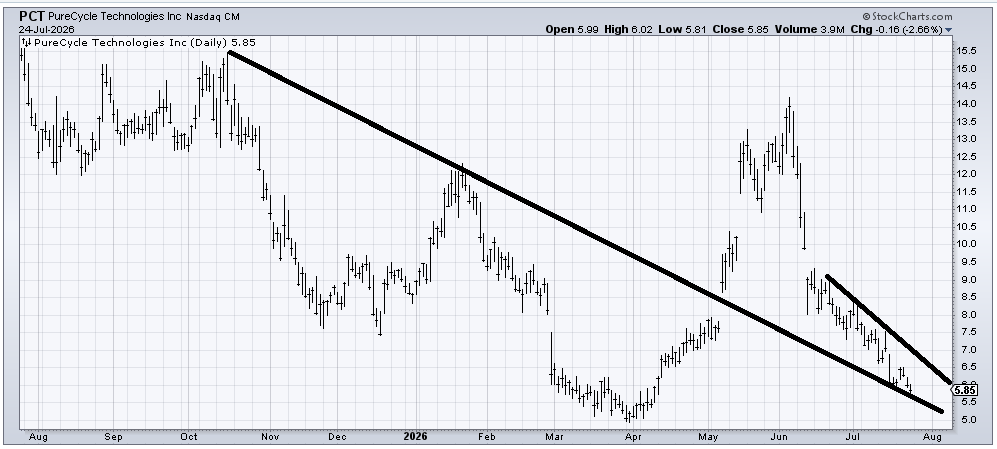
Pure Cycle Technologies (PCT) is oversold and at support, but right now that’s the best I can say about it. It would have to rally and cross over 6.50 for me to think there’s more behind it than just an oversold rally. I would, however, note that this is the sort of chart we should keep on our list as we head into the fourth quarter, as first there could be tax loss selling and then a decent play to the upside.
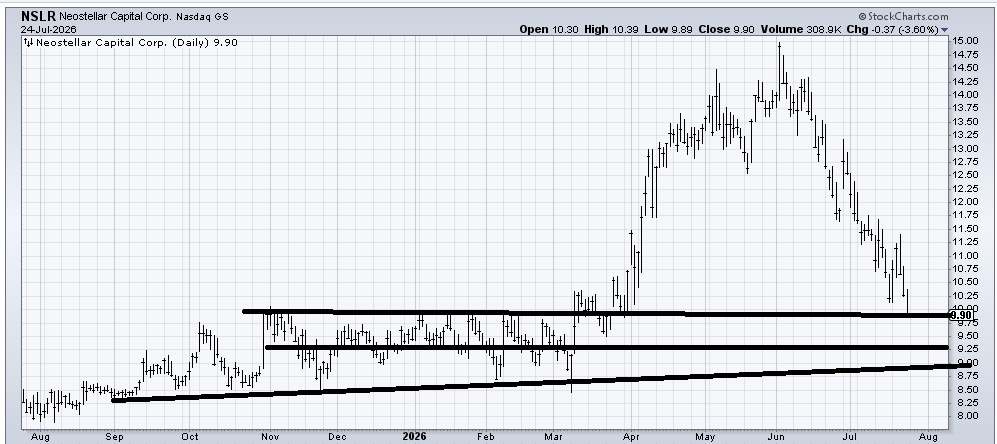
Neostellar (NSLR) is at support and probably oversold, but with no base to speak of and what appears to be relentless selling since June, the best I see for now is an oversold rally from support.
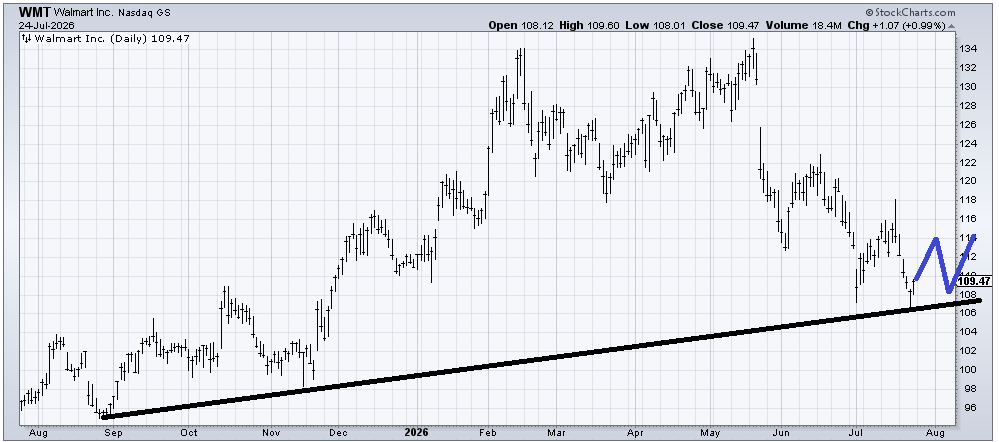
I have been cautious on Walmart (WMT) since May, but it has finally come down to support without making a significant lower low (than early July). It’s oversold enough to bounce, but at least for the first time in months, I can wonder if some sideways action will start to improve the chart. Let’s keep this one on our radar for the next month or so, because maybe we start to see a pattern as I have drawn in blue play out.
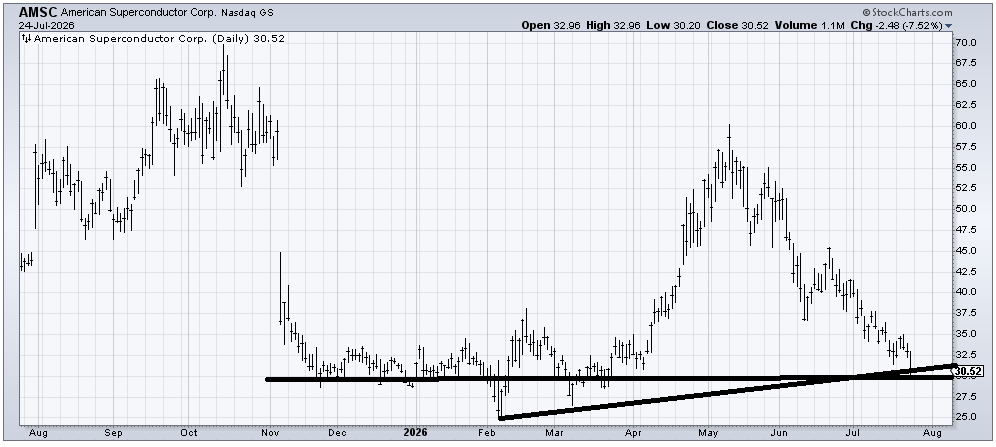
American Superconductor (AMSC) is yet another stock that has halved since May. It is also another stock that is oversold and at support and therefore ought to bounce. But for now, that’s the best I can say. I would put it on the radar for the fourth quarter when tax loss selling is done.
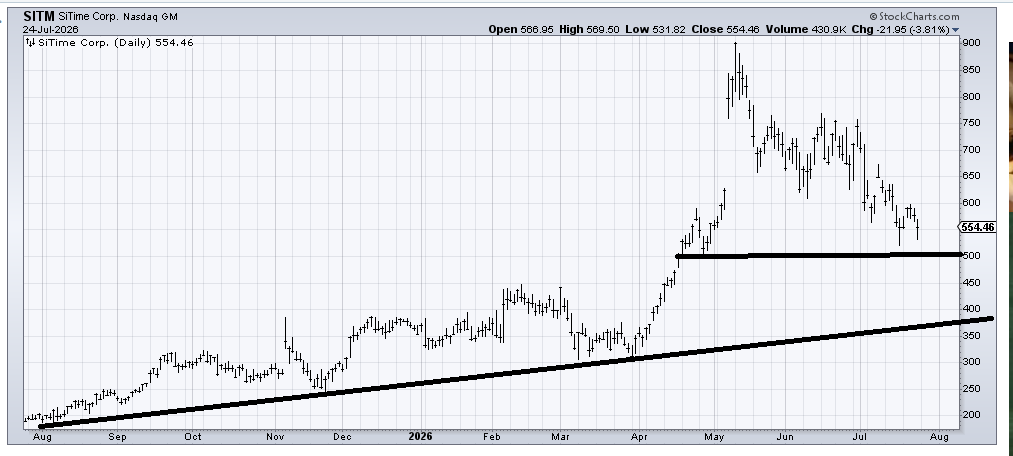
I will be curious to see if SiTIme (SITM) can hold this 500-550 area. Sure, it’s oversold enough to bounce, and it did not make a lower low on Friday, but here is an example of a chart that, if I am correct and the others catch down in August, we can see this chart start to hold and base while the rest of the market backs off.