Oil and Yields Squeeze Stocks for a Third Straight Day
My even market wrap-up is a summary of everything you should know for successful trading.
You've reached your free article limit
You've read 0 of 1 free Pro articles.
I will leave this introduction in for this week: For readers who are new to my work, this piece, the evening update, is meant to be a look at the major forces which drove markets in the day’s trading and a look ahead to the following day (or week on Fridays). As with the other updates, I also want this piece, to evolve in whatever way is most meaningful for readers.
So please post or email comments, questions, pushback, or suggestions, and especially what you would like to see more or less of. I read all the feedback, and I promise to be responsive. If you do put a comment in though please be sure to put an @ and my name so it alerts me.
Quick Summary
US equities continued Tuesday’s slide into Wednesday as crude prices climbed to fresh three-month highs pushing up global bond yields and pressuring stocks.
Brent pushed back over $100, as discussed in the morning update, lifting bond yields. President Trump didn’t add to optimism for quick relief, saying oil prices would remain elevated until after the upcoming midterm elections. The selling in US bonds then deepened after the Treasury said it would buy back up to $6 billion of longer-dated debt, while more than the “at least $4 billion” mentioned by Secretary Bessent, it was less than many on the Street had positioned for. The 10-year hit a new high (since the November 2023 highs) before settling slightly lower after a very strong 10-year note auction (still the highest close since then). The 2-year rose to 4.44%, the highest close since July 2024.
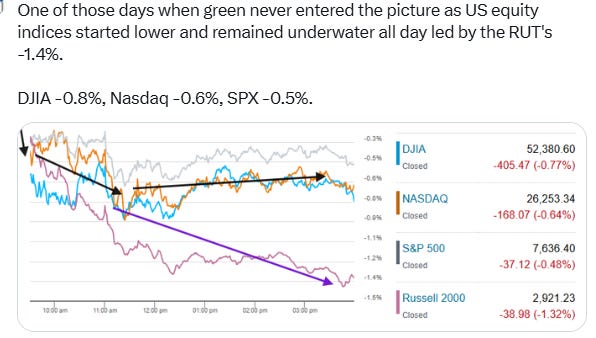
Green never entered the picture today as the indices opened lower and stayed underwater all session. The rate sensitive small cap Russell 2000 led the way down at -1.3%, with the DJIA -0.8%, Nasdaq Composite -0.6%, and S&P 500 -0.5%. All were down for a third straight session.
Market Commentary
- “The risks to equity markets continue to pile up as the discount rate which they face gets higher and higher and higher,” said Ashley Lester, chief research officer at MSCI. “The question is to what extent can continued AI earnings growth continue to push equity markets onward.”
- “The temperature just got turned up again,” said Kenny Polcari at SlateStone Wealth. “The risk premium is alive and well, and the risk to energy supplies coming out of the Gulf is real.”
- “For a while there, we saw a strong broadening trend in the markets,” said Steve Sosnick, chief strategist at Interactive Brokers, on Wednesday. Now, however, “we’ve slipped back to the idea that the tech trade will lead us all.”
- “Oil prices at $100 per barrel put inflation pressures back into the spotlight,” said Joachim Klement at Panmure Liberum. “In this environment and in the absence of forward guidance by the Fed, the ECB’s decision and Christine Lagarde’s comments on Thursday will gain weight.”
- “Fears of rising interest rates coupled with escalating crude oil prices is never a great combination for the stock market,” JJ Kinahan, senior vice president at Cboe Global Markets said. “We’re seeing that in today’s early trading as investors move into defensive mode.”
- “The path of least resistance is a strong and steady grind higher [in oil prices] as the war enters seven months,” said Darrell Fletcher, managing director for commodities at Bannockburn Capital Markets. “The fundamental picture for products remains bullish with global inventories and reserves deteriorating. In the typical pattern, the US and Iran continue their counterattacks and warnings.”
- “Anxiety over continued and damaging supply disruption, due to the escalation of the conflict between the US and Iran, is significantly higher,” said Tamas Varga an analyst at brokerage PVM. “Inflationary pressure will affect oil demand, but for now supply is not able to match demand.”
- It’s “a little bit of a speed bump,” said Kara Murphy, investment chief at Kestra Investment Management, on CNBC’s “Closing Bell.” “There’s a little bit less to focus on with the earnings front, so I think the market has sort of shifted its attention now to the risk side.”
- “A hot CPI print would all but seal a September hike and underpin a firmer dollar,” said Elias Haddad at Brown Brothers Harriman & Co. “A cooler reading would strengthen the case for a hold and leave the dollar vulnerable to a dovish Fed repricing.”
- “We continue to think a correlation one downside event is brewing,” BTIG’s Jonathan Krinsky wrote. “AI was the standout again today, and while that trade has had a nice three day bounce, we are mindful that in 2000 the SOX crossed back and forth its 50 DMA ten different times before ultimately breaking down for good six months after the peak.”“Bottoms are events, tops are processes,” Krinsky added
- The risk of a pullback is lessening as the market broadens out, according to JPMorgan’s Mislav Matejka. The strategist said he especially found it reassuring that equity indexes are holding near record highs, even after momentum has faltered. He said he expects the momentum unwind to be nearly complete and is anticipating a broadening out of performance in the second half of the year. “The downside risk to the overall market should be easing,” Matejka wrote.
Stock and Sector Breakdown:
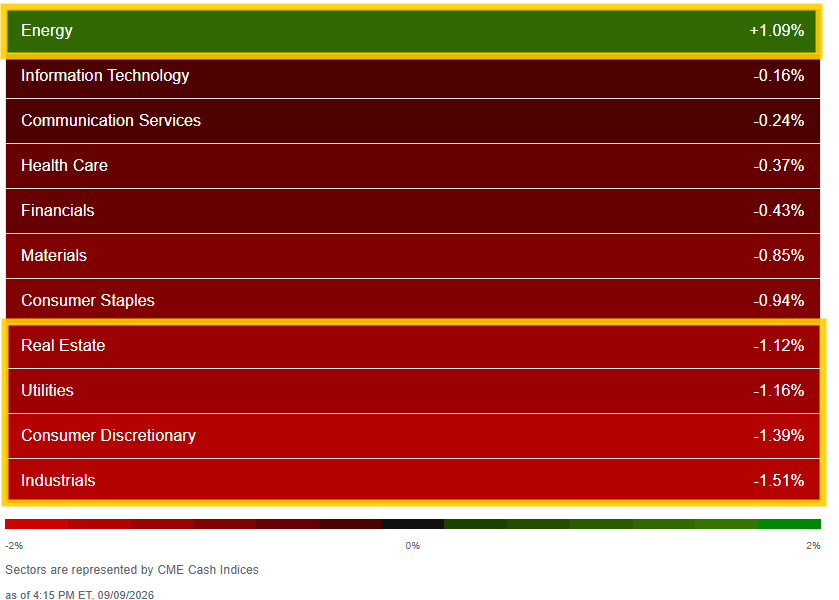
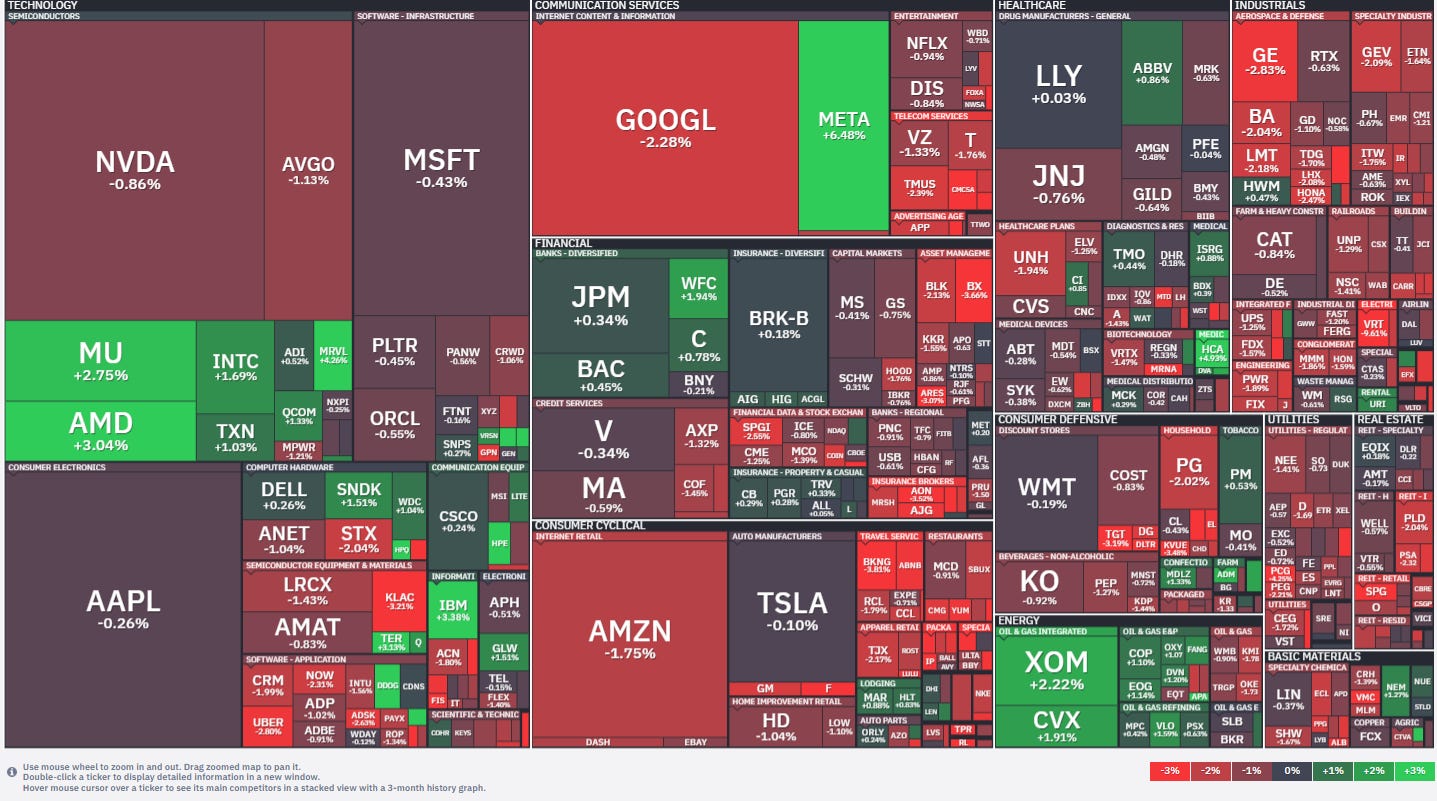
Just one SPX sector higher Wednesday in Energy (which also led Tuesday for obvious reasons), although once again helping keep losses contained was heavyweight Tech (which is ~40% of market cap) losing just 0.2% for a second session as chip names continued their resilience (the Philadelphia Semiconductor Index (SOX) was higher for a fifth straight session).
But four sectors were down more than 1% in yesterday’s second and third place Utilities and Real Estate along with Consumer Discretionary and Industrials (Industrials are now down -8% since August 14th (see post)).
On single stocks, Casey’s General Stores (CASY), (-14%) was the weakest name in the S&P after earnings. Comcast (CMCSA) (-6.6%) and Charter (CHTR) (-8.1%) slid after Comcast flagged heightened “competitive intensity” at the Goldman Sachs Communacopia conference, while Alphabet (GOOG) (-2.1%) added to the drag on communication services.
Apple (AAPL) (-0.3%) briefly turned green after its product event — where it unveiled the foldable iPhone Duo alongside the iPhone 18 — before fading into the close.
Number of large SPX winners (up over 3%) dropped to just 12 Wednesday from ~30 Tuesday (which was already a relatively low number historically but also what we’ve mostly seen the past few weeks), but the number of large losers (down over 3%) also fell to ~45 from ~85.
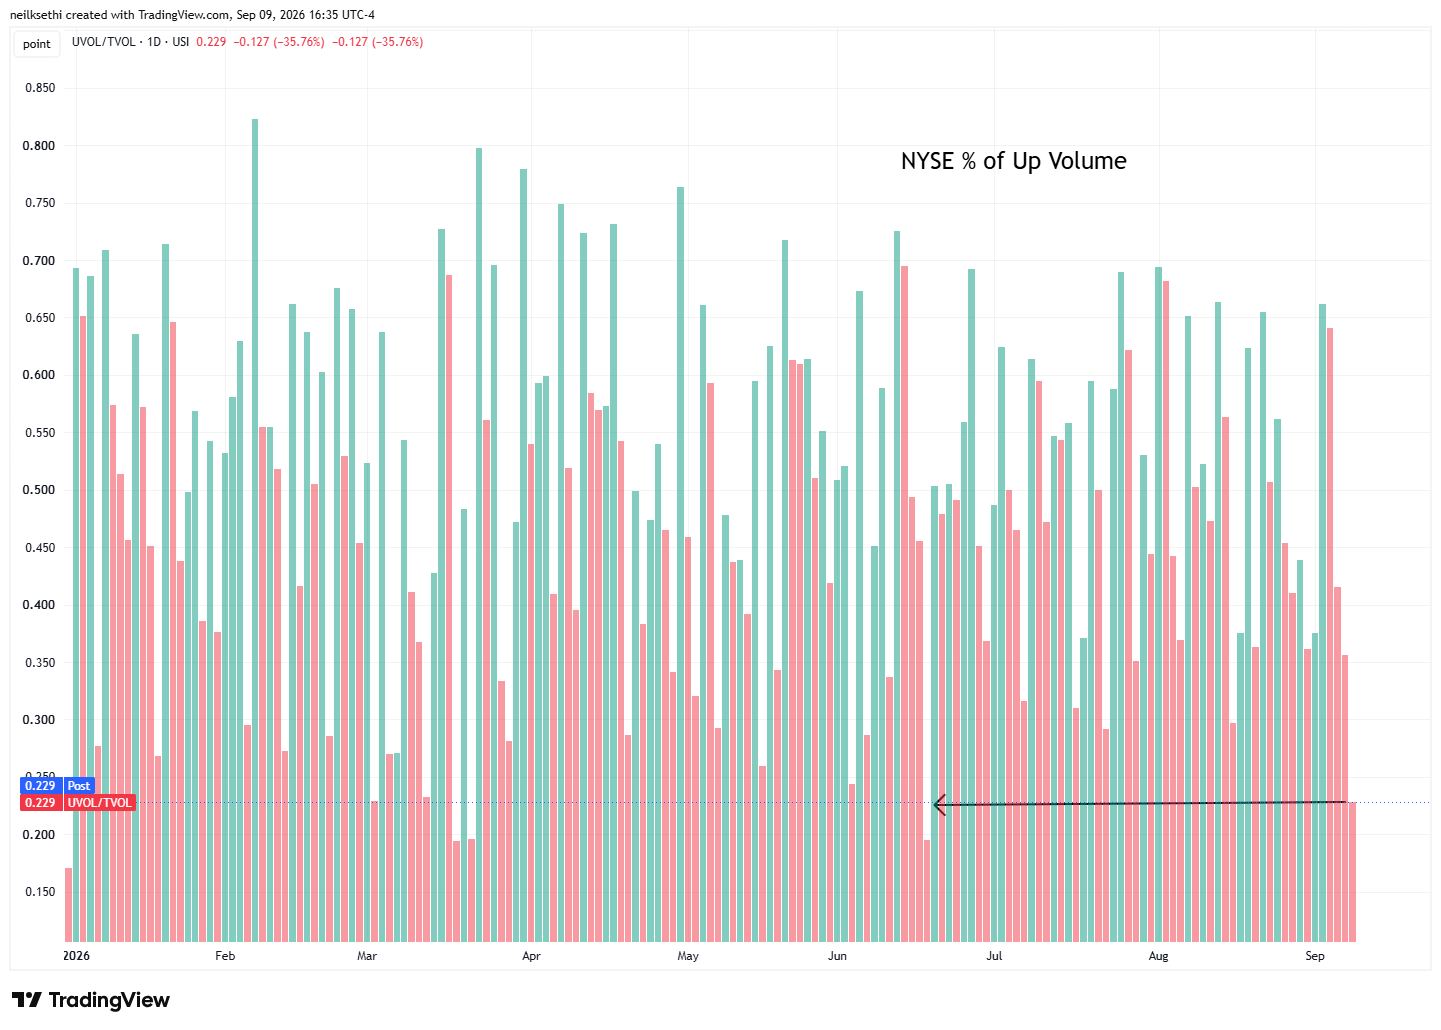
If you recall, yesterday I mentioned “one bright spot was the positive volume on the Nasdaq (intensity of buying in stocks up on the session) at around 55% the best for a down session since August 11th.” Well today, despite a smaller loss (-0.64% vs -0.93%) it fell to 32.2%, the least since July.
Even worse, the NYSE (chart) fell to 21.8%, the least since June 17th.
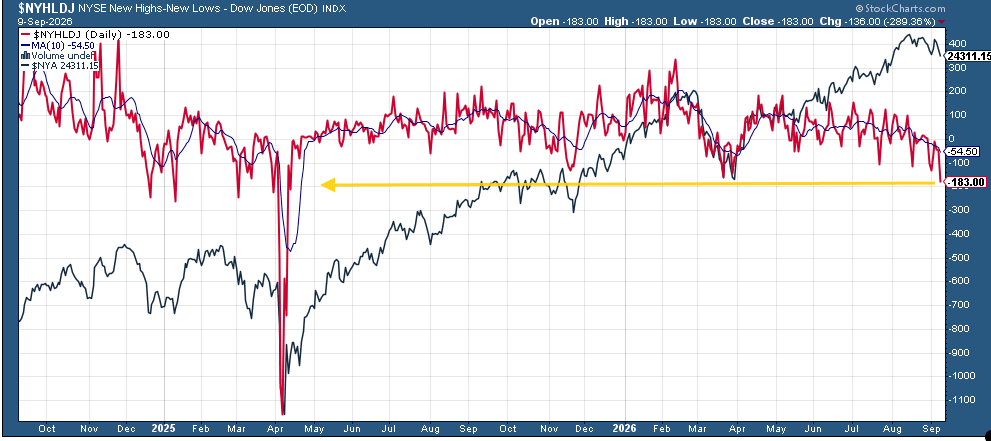
But, wait, there’s more. New 52-week highs minus new lows on the NYSE fell to -185, the least since the liberation day crash.
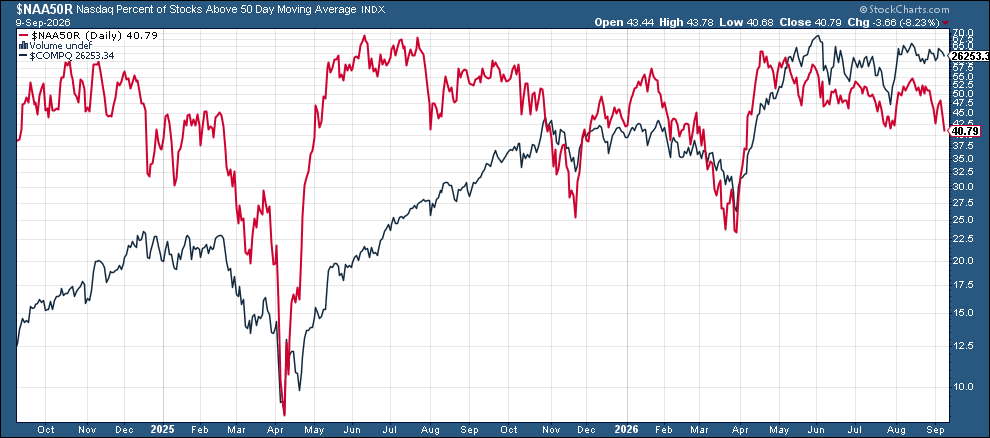
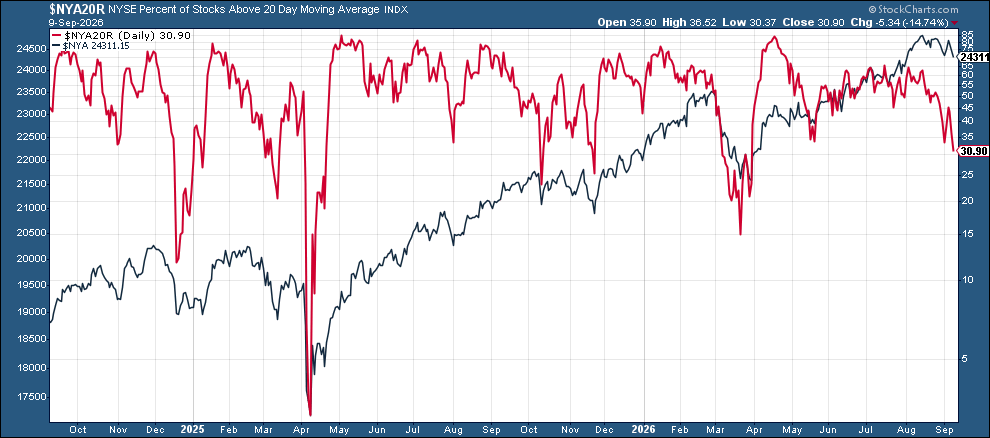
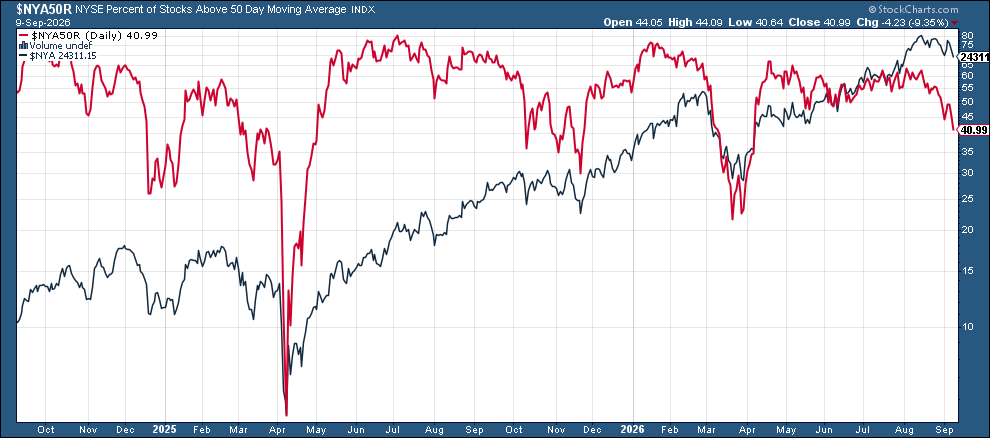
And both the Nasdaq and NYSE saw the percent of stocks above 20 and 50-DMAs fall to the least since late March/early April.
Nasdaq
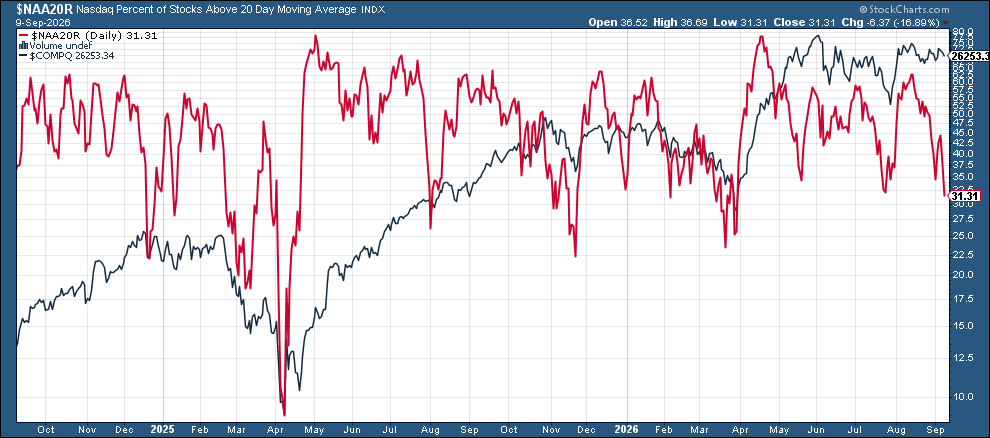
NYSE
James “Rev Shark” DePorre – “The most positive thing I can say about this market is that the senior indices held up fairly well, but there is clear corrective action taking place under the surface.”
Some stock-specific commentary from TheStreet Pro today:
- Ed Ponsi – While Retail Struggles, This Overlooked Name Is Quietly Crushing It
- Stephen Guilfoyle – Why I’m Adding to 3 Stocks on Weakness
- Chris Versace – Sticking With This Apple Price Target After Foldable iPhone Duo Reveal
- Bob Lang – Chart of the Day: Morgan Stanley Could Spring Into Action
Some other corporate news from BBG (name links to BBG stories, ticker links to TheStreet Pro):
- Apple’s (AAPL) device, called the iPhone Duo, will improve on rivals’ foldable models, which Chief Executive Officer John Ternus compared to two phones glued together.
- Alphabet Inc.’s (GOOG) Google is spending €13 billion ($15.1 billion) on artificial-intelligence infrastructure in Finland, its biggest European investment, as the Nordic country’s cold climate and carbon-free power make it a magnet for data center builders.
- Amazon.com Inc. (AMZN) raised £4.25 billion ($5.8 billion) from its debut sterling bond sale, increasing the size of the four-part deal even as orders from investors tailed off.
- Dell Technologies Inc. (DELL) is set to raise $5 billion from an investment-grade bond sale that saw booming investor demand as the company rides a surge in revenue from AI servers.
- Dow Inc. (DOW) is considering plans to exit its $20 billion chemicals partnership with Saudi Aramco, people familiar with the matter said, as part of the US firm’s efforts to reshape its portfolio amid a prolonged downturn in the industry.
A Look At The Charts
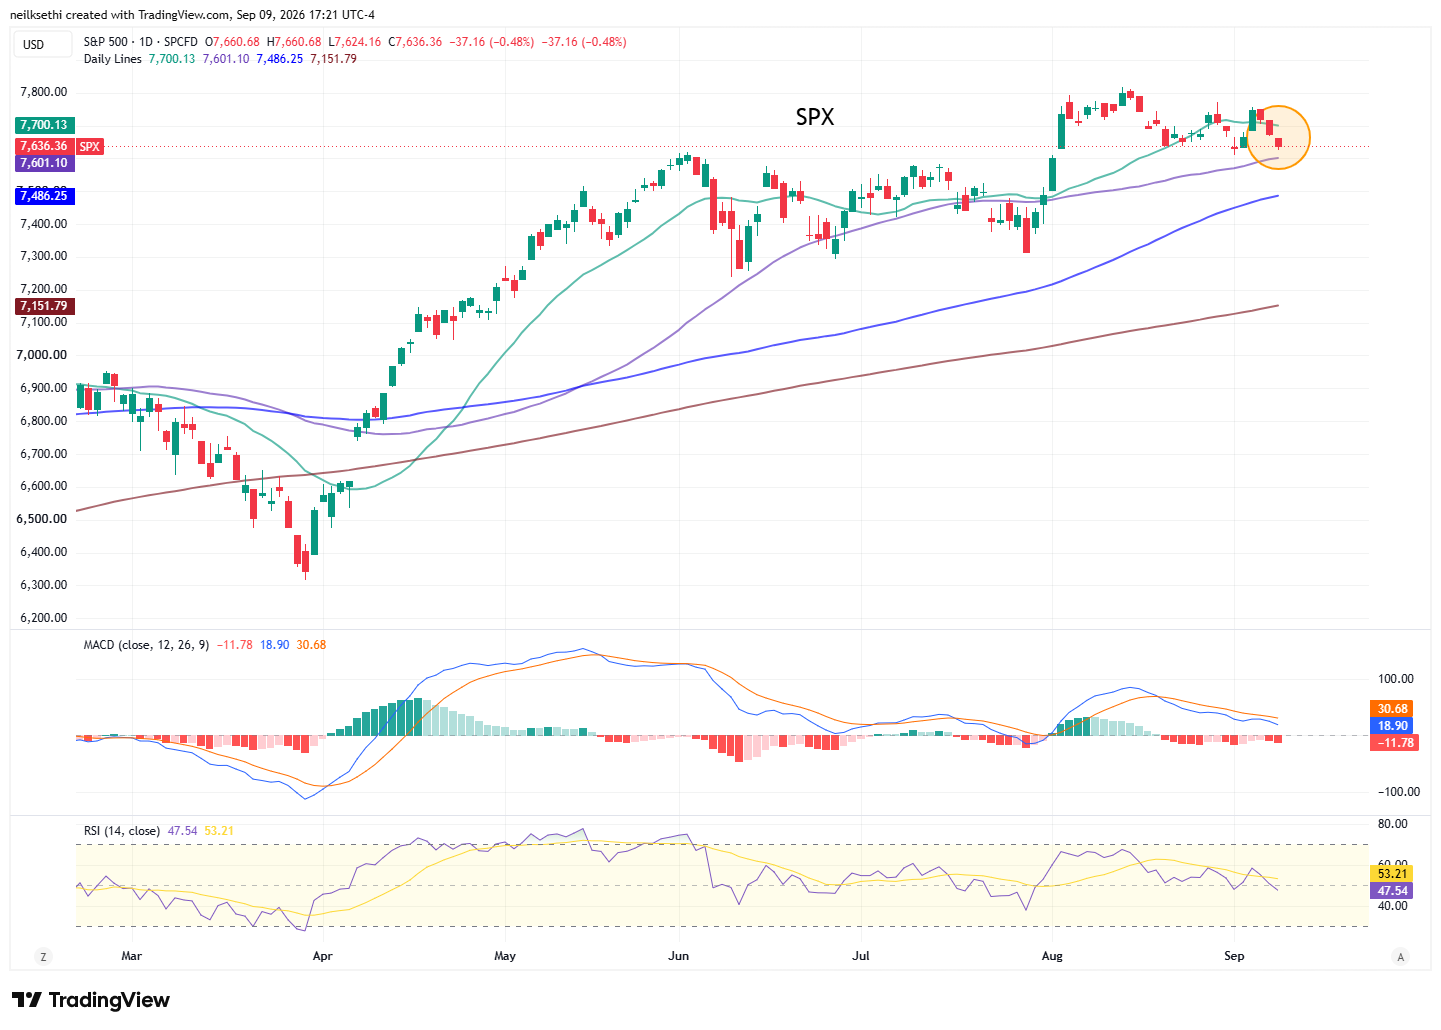
Note on all charts the colored lines are moving averages (the average price over the lookback period (days on the daily charts, weeks on the weekly charts)):
20 = green
50 = purple
100 = blue
200 = brownException is monthly charts where blue is 10-month moving average and brown is 20-month moving average.
MACD = Moving average convergence/divergence line, a measure of momentum that compares longer term and shorter term momentum to gauge if a move is strengthening or weakening. This is probably my favorite individual indicator (it’s also the favorite of Katie Stockton, a very fine technician).
RSI = Relative Strength Index (basically what it sounds like) = measures the strength of the move comparing gains to losses over the given lookback window (I use the standard 14 periods).
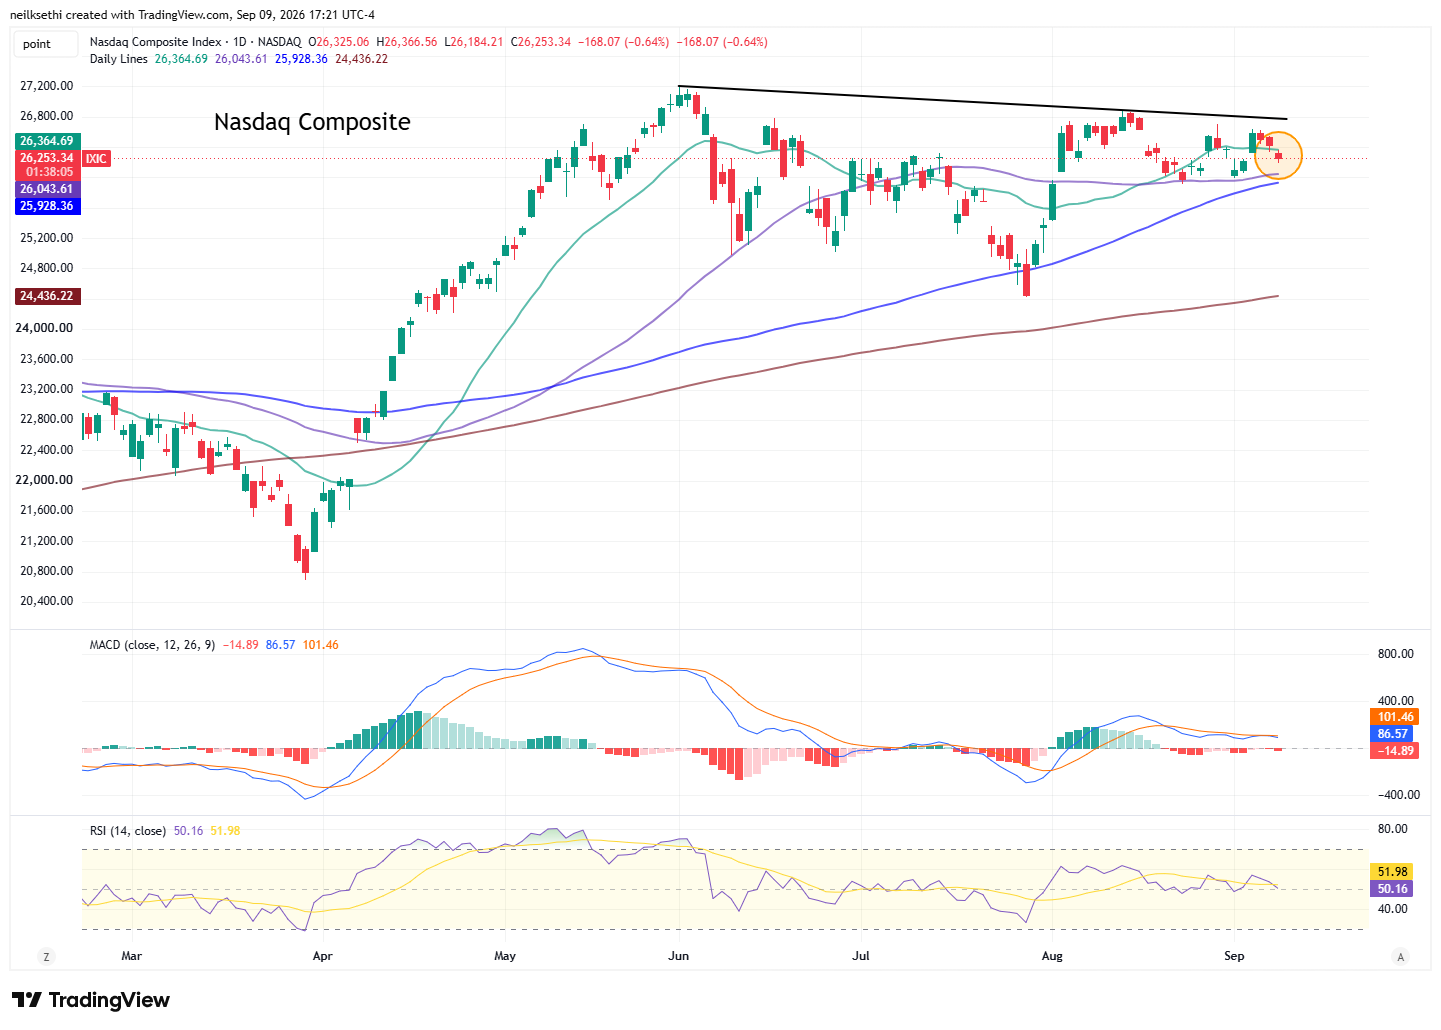
SPX closing in on the 50-DMA. As mentioned three weeks ago though the SPX along with the other three indices below had seen their daily MACD cross over to a “sell longs” positioning. RSI here back under 50. As I said Tuesday “just caution flags – nothing yet to turn bearish,” but that probably changes short term if the 50-DMA doesn’t hold.
Nasdaq Composite in better shape although also fell under its 20-DMA. Daily MACD more neutral than bearish and RSI still over 50 (barely).
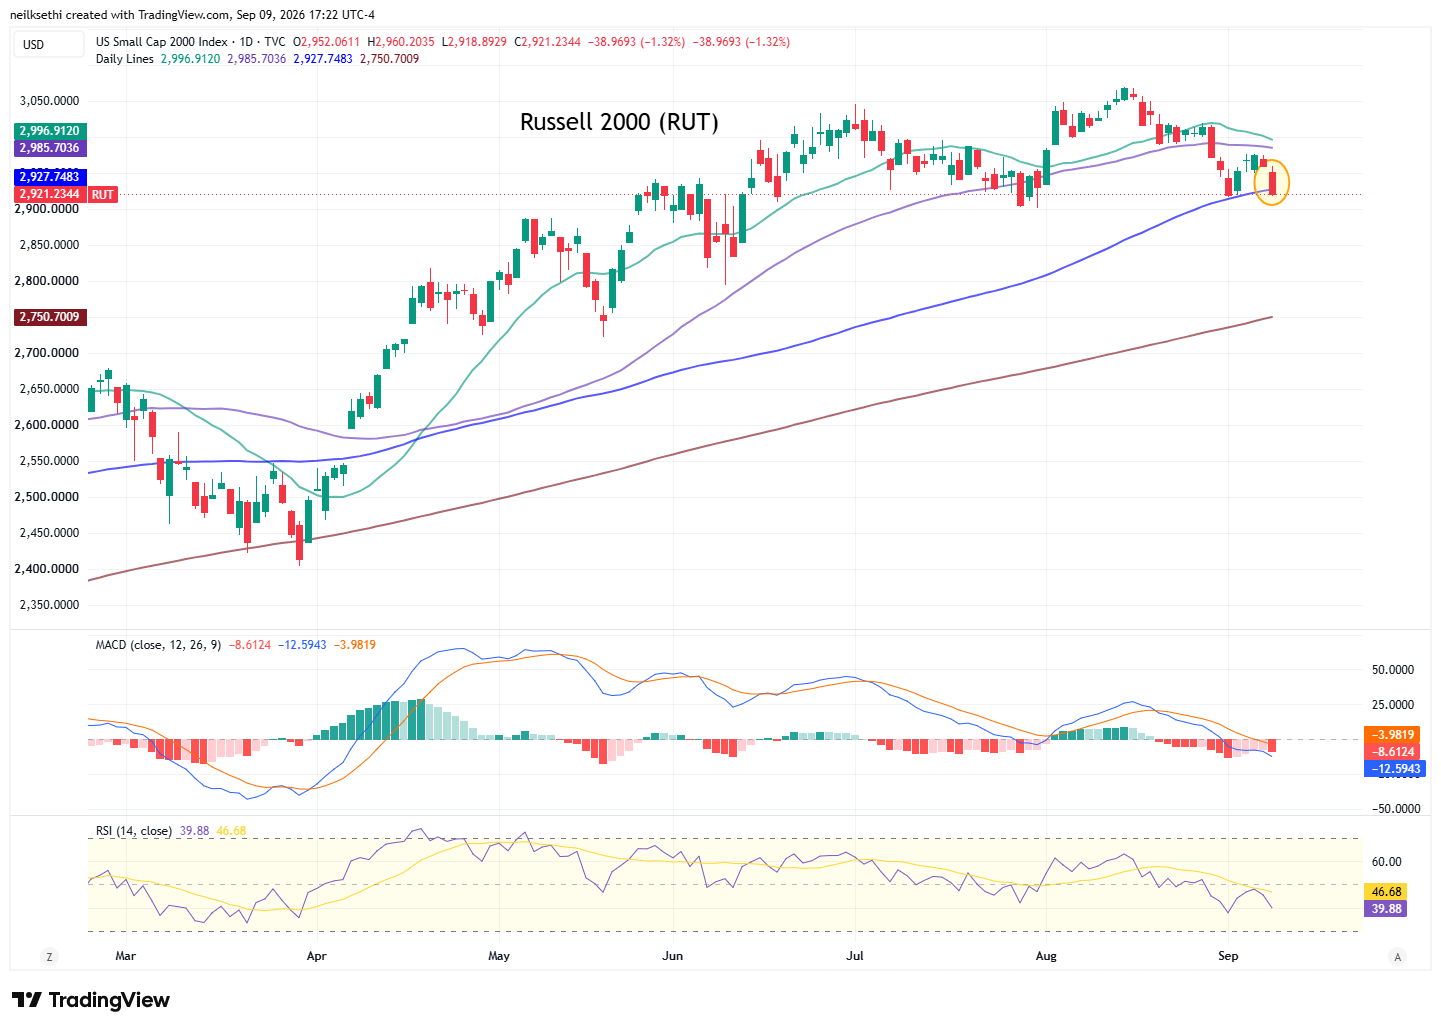
The Russell 2000 (RUT) much more problematic. It has fallen under its 100-DMA for the first time since early April, its daily MACD as mentioned Tuesday has tipped to “go short,” and its RSI is now below 40. I am not long this index, but any further weakness and I’d be out until it at least recovered the 100-DMA.
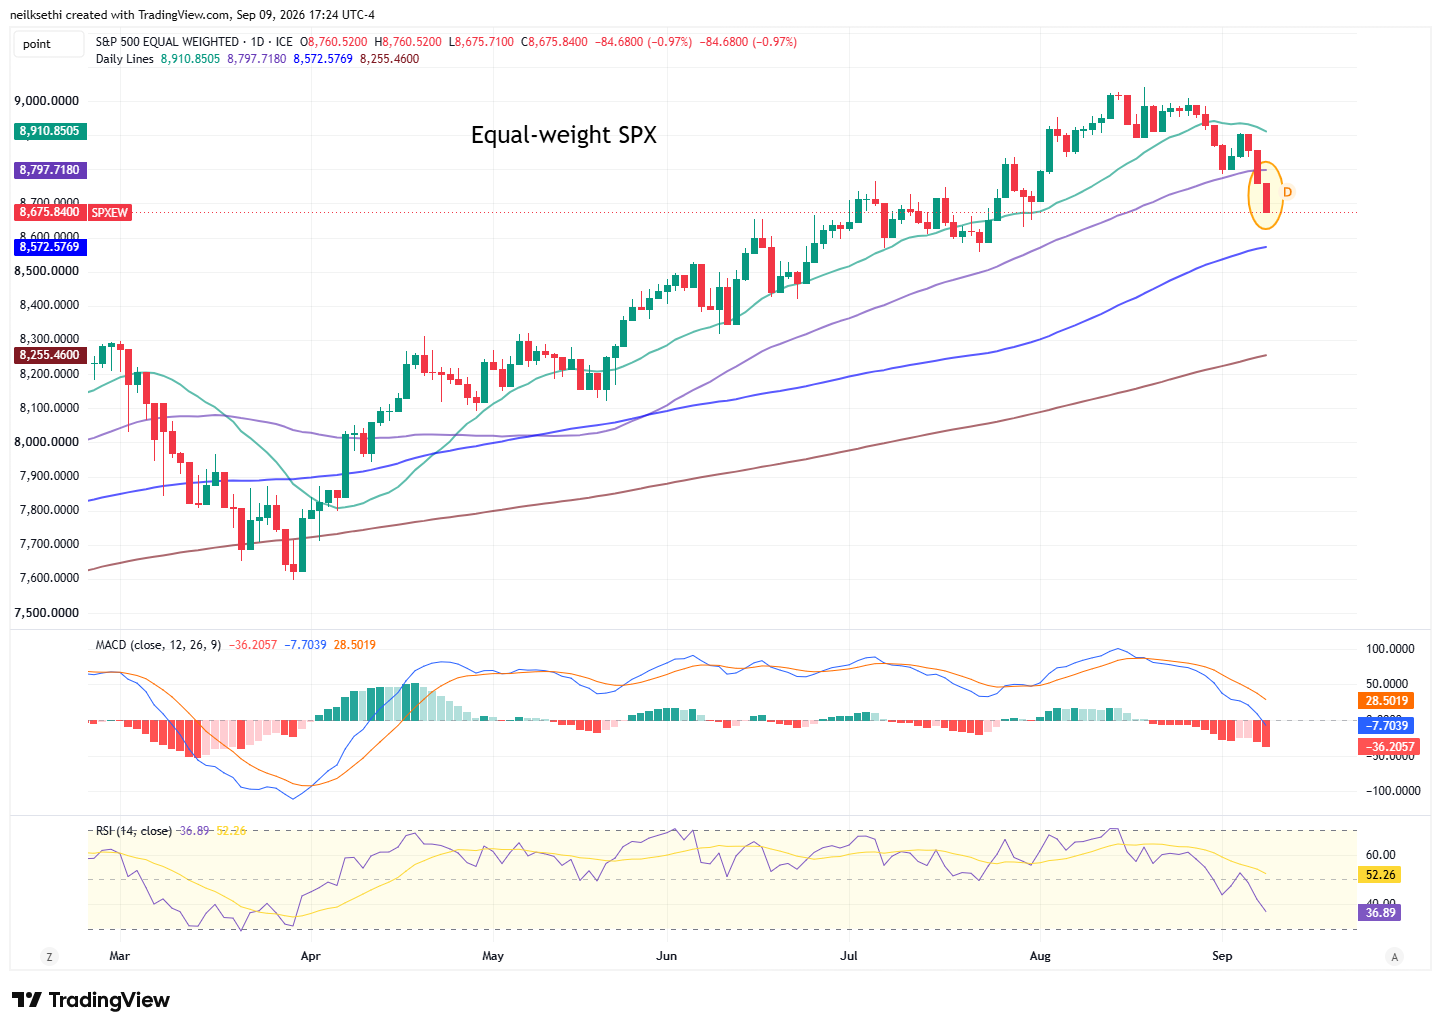
The equal-weighted SPX I said Tuesday “had been perhaps the strongest chart since the March bottom is now the most concerning.” So a -1% day isn’t a shock, and it really has no good support anywhere close. It has the most severe MACD separation, and the RSI is the weakest since late March. I mentioned Tuesday, “I did take off most of my holdings in RSP (RSP) for now.” I’ll be looking for a tradeable bottom to form.
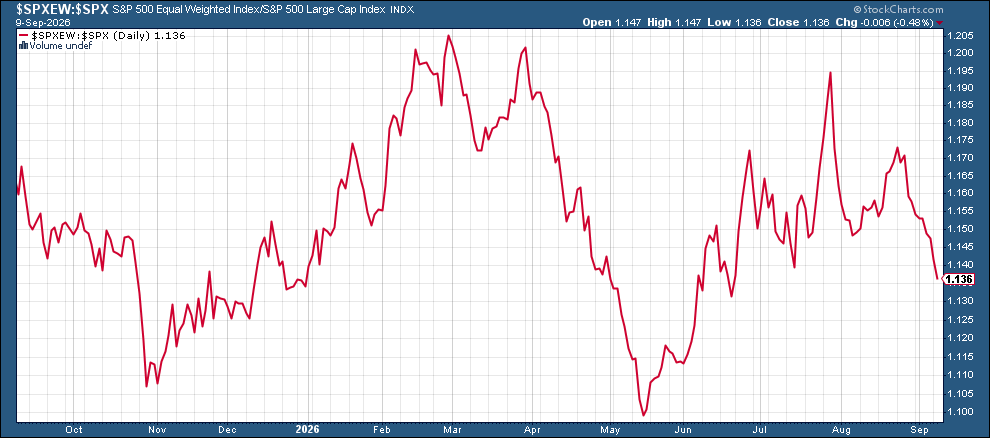
Ratio of the SPXEW to the SPX the lowest since June.
And if you missed it, Helene Meisler did a write up on RSP today – What If ‘Equal Weight’ Isn’t Equal?
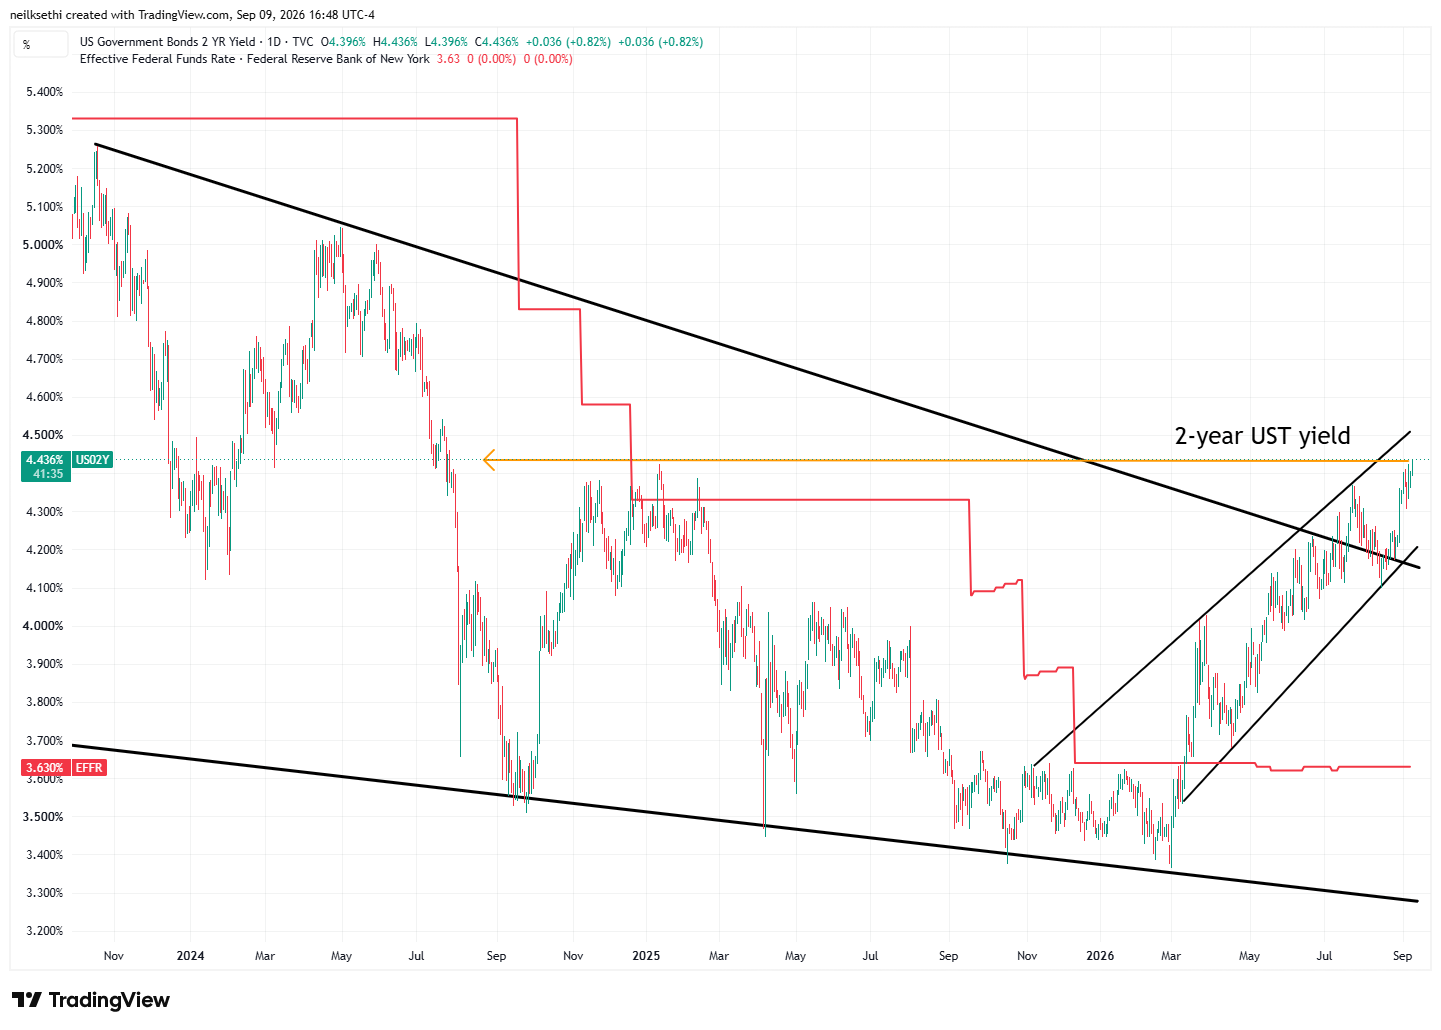
Treasury yields rose across the curve Wednesday once again but this time in a “bear steepening” (meaning longer maturity yields rose more than shorter maturities (bearish because rates are going higher)):
The two-year Treasury yield up four basis points to 4.44%, the highest close since July 2024.
It is ~77 basis points above the Effective Fed Funds rate (red line), screaming for rate hikes. That’s the furthest above the EFFR since November 2022.
Despite Scott Bessent’s efforts (more on that below) 10-year yields were up five basis points to 4.84%, the highest since November 2023.
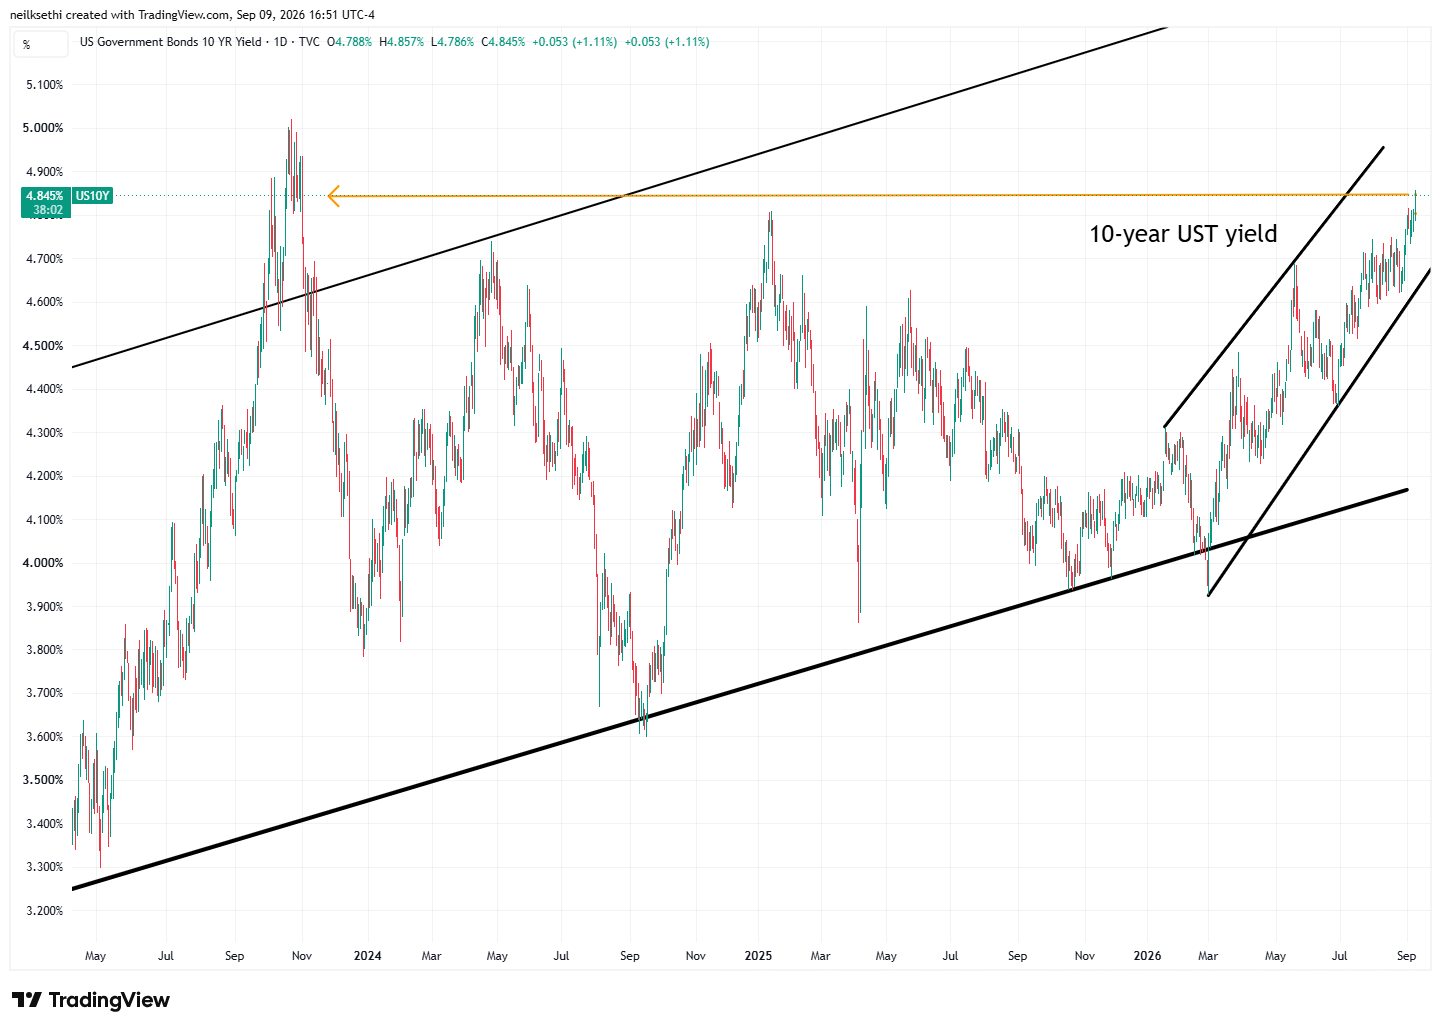
More on 10-year yields and the Treasury buybacks from TheStreet Pro:
- Chris Versace – Treasury’s Big Move Leaves the Market Unimpressed
- James “Rev Shark” DePorre – Buyback of Bonds Backfires
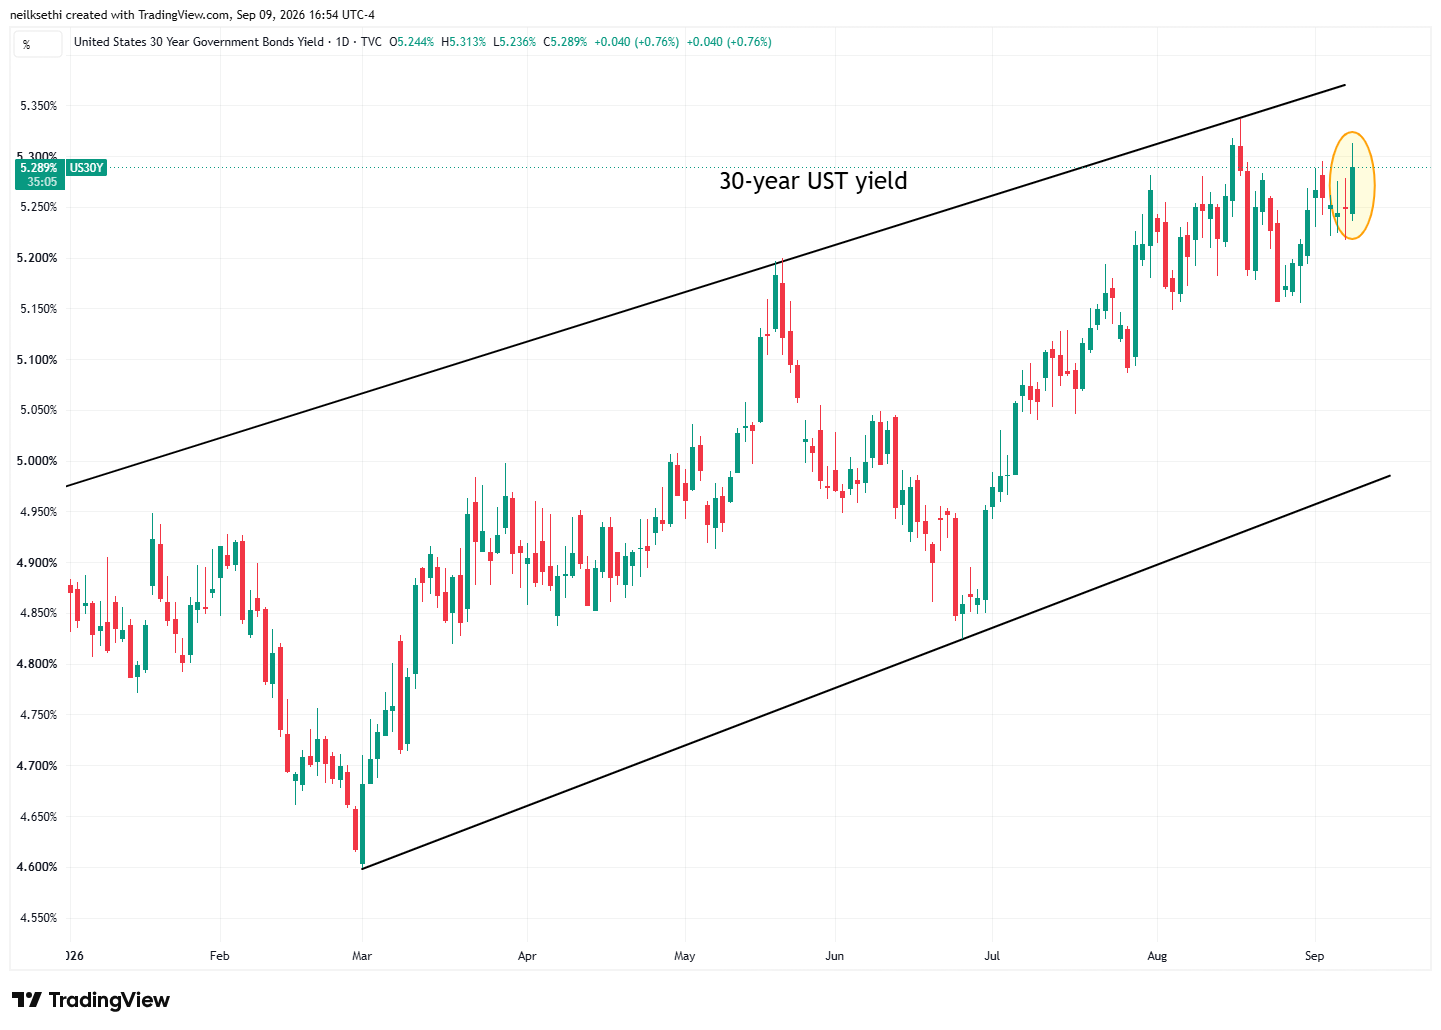
30-year yields were up four basis points to 5.29%, now just two basis points from their close August 17th (which was the highest since 2007) that instigated Bessent’s initial buyback announcement.
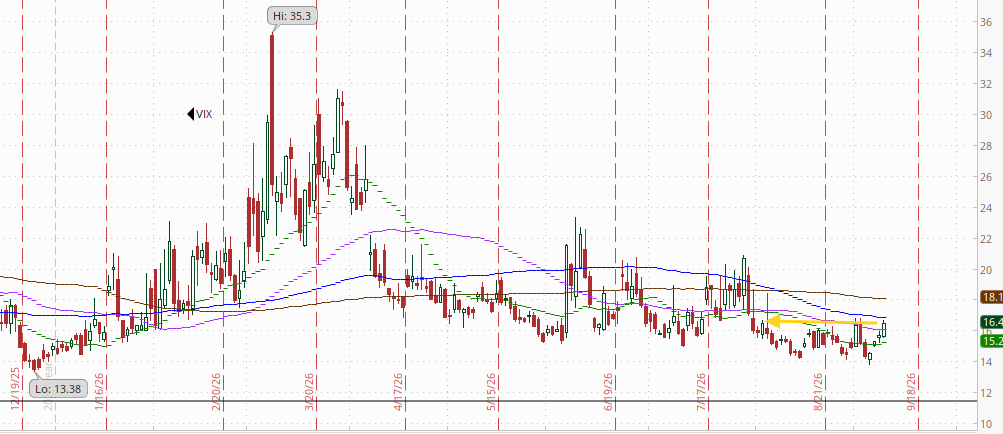
VIX rose for a fourth session to 16.5, the highest since July. The indicator is moving towards the middle of its “normal” range post-GFC, consistent with ~1.03% average daily moves in the SPX over the next 30 days.
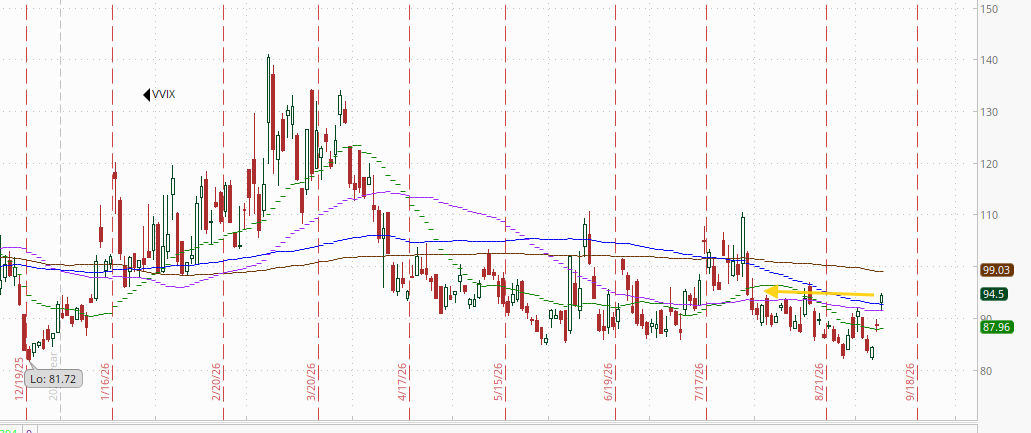
The VVIX (VIX of the VIX) also rose to the highest close since July at 94.5, after touching the lows of the year on Friday.
The current level is consistent with “moderate” daily moves in the VIX over the next 30 days (historically, normal is 80-100, but we’ve been above 90 most of the time since July ‘24). Above 100 is the level flagged by Charlie McElligott as indicating higher stress.
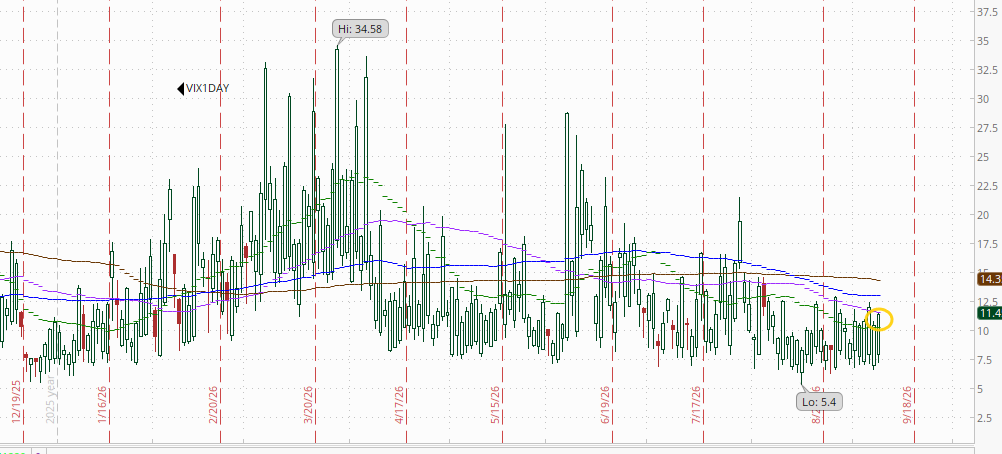
1-day VIX though more subdued edging up to 11.5, more elevated than we saw at the end of August but less than the beginning. The current reading isconsistent with a move of 0.72% in the SPX next session.
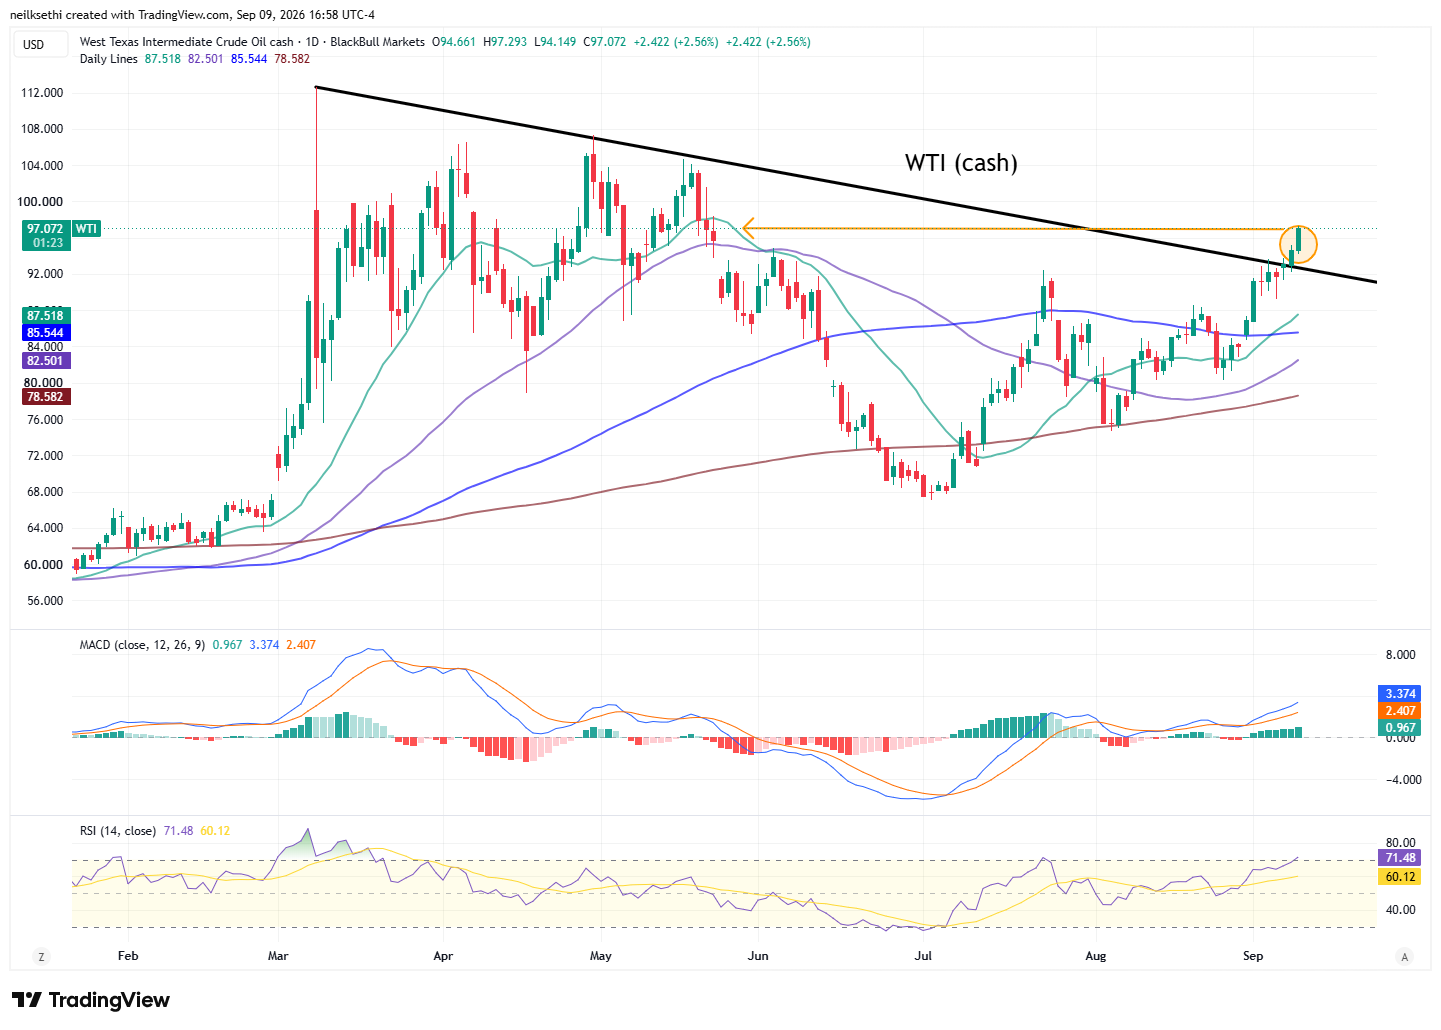
WTI (cash) up another 2.6% to the highest close since May 20th. While it’s a fundamentally driven market, the technicals are quite strong. As long-term followers know, a quarter of my portfolio is in MLPs so from that standpoint I have no complaints.
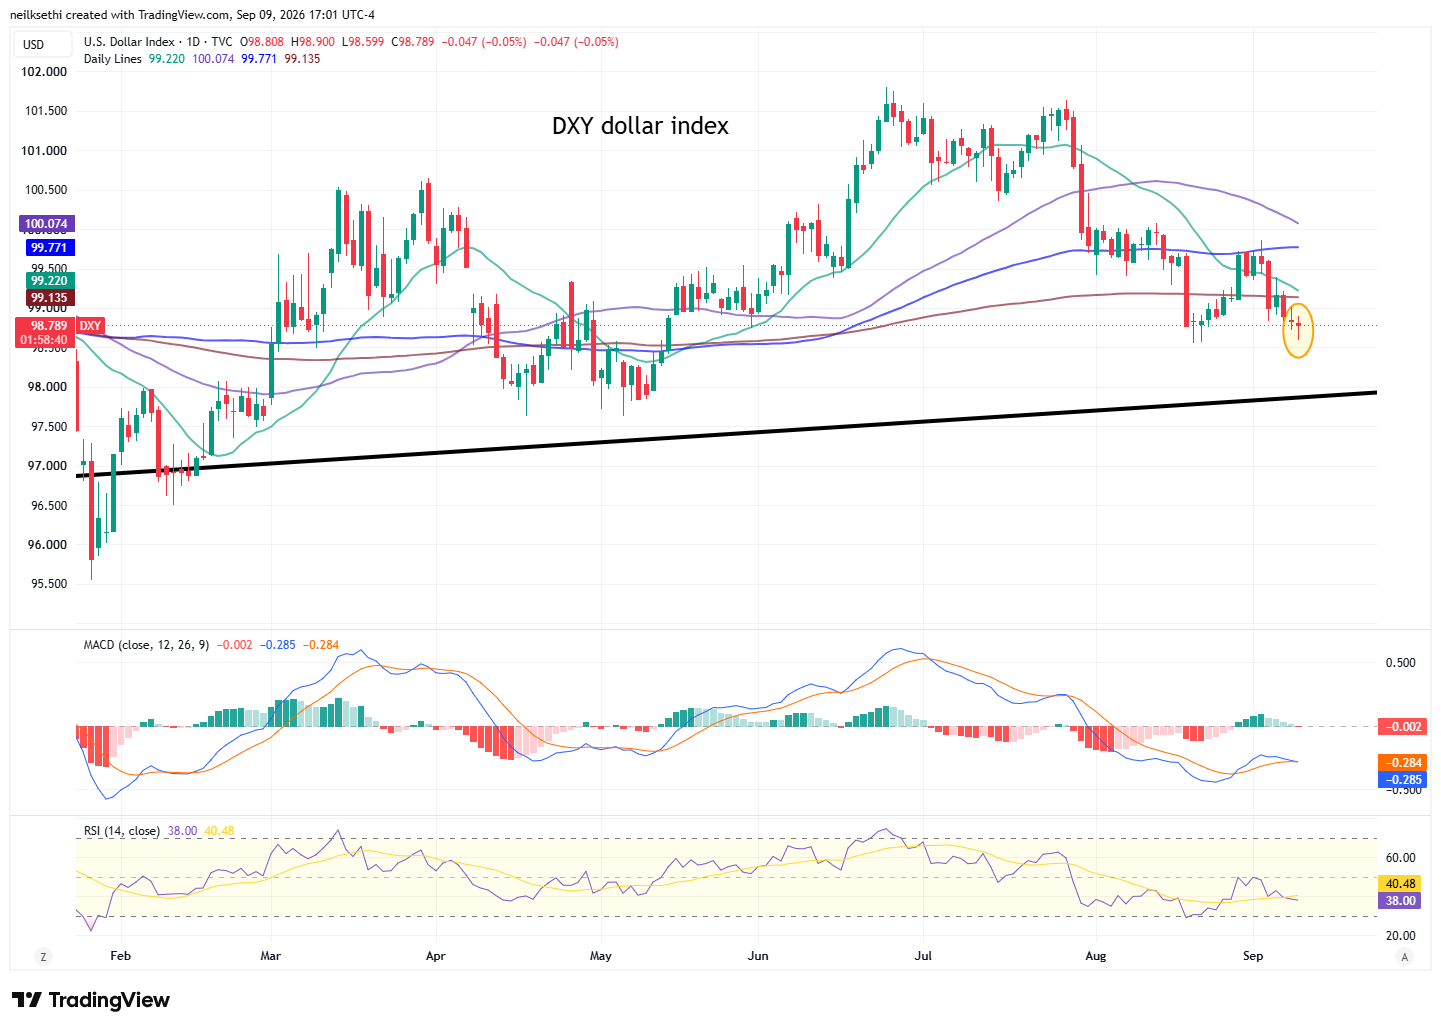
The DXY dollar index (which is fixed weighted with a heavy (57%) weighting vs the euro), edged back to just above the close August 19th, which was the lowest since May 13th.
The daily MACD has softened to neutral while the RSI is under 40, so not a lot of technical strength with heavy resistance above.
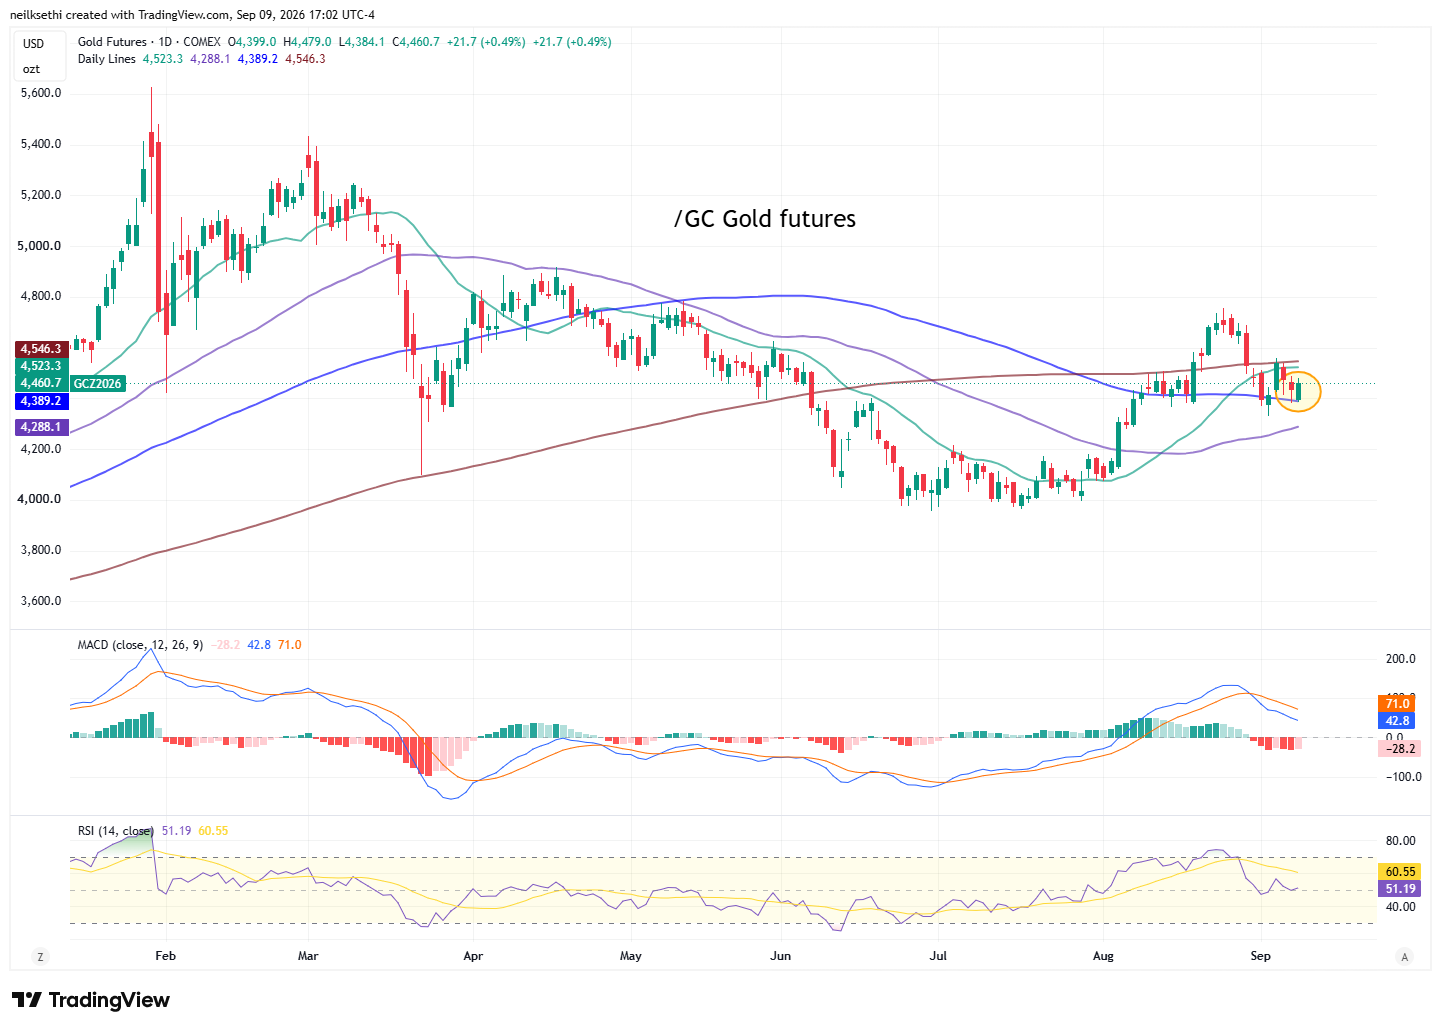
Gold futures (/GC) able to find support at the 100-DMA but remains under the 200-DMA. The daily MACD remains negative while the RSI is at 50. As mentioned Tuesday, “I will wait for it to get back over the 200-DMA to add back what I took off when it fell below.”
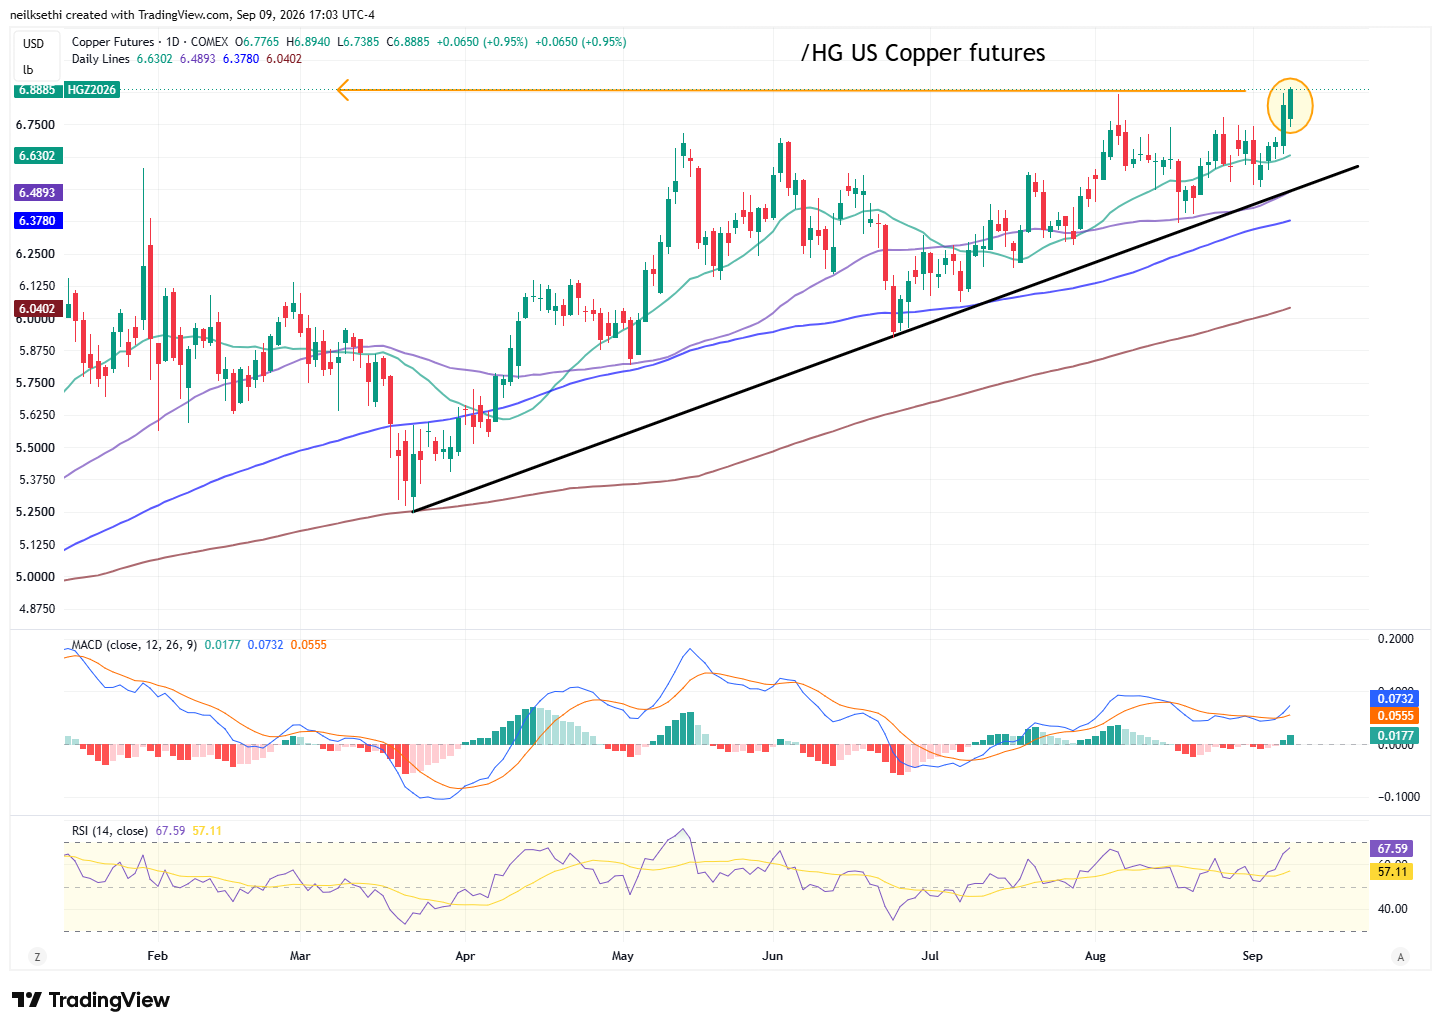
US copper futures (/HG) added another 1% to another all-time high, remaining in the uptrend from March (in addition to the longer term uptrend running to February 2020). Technicals also continued to move more positively. I remain bullish as I have been since April.
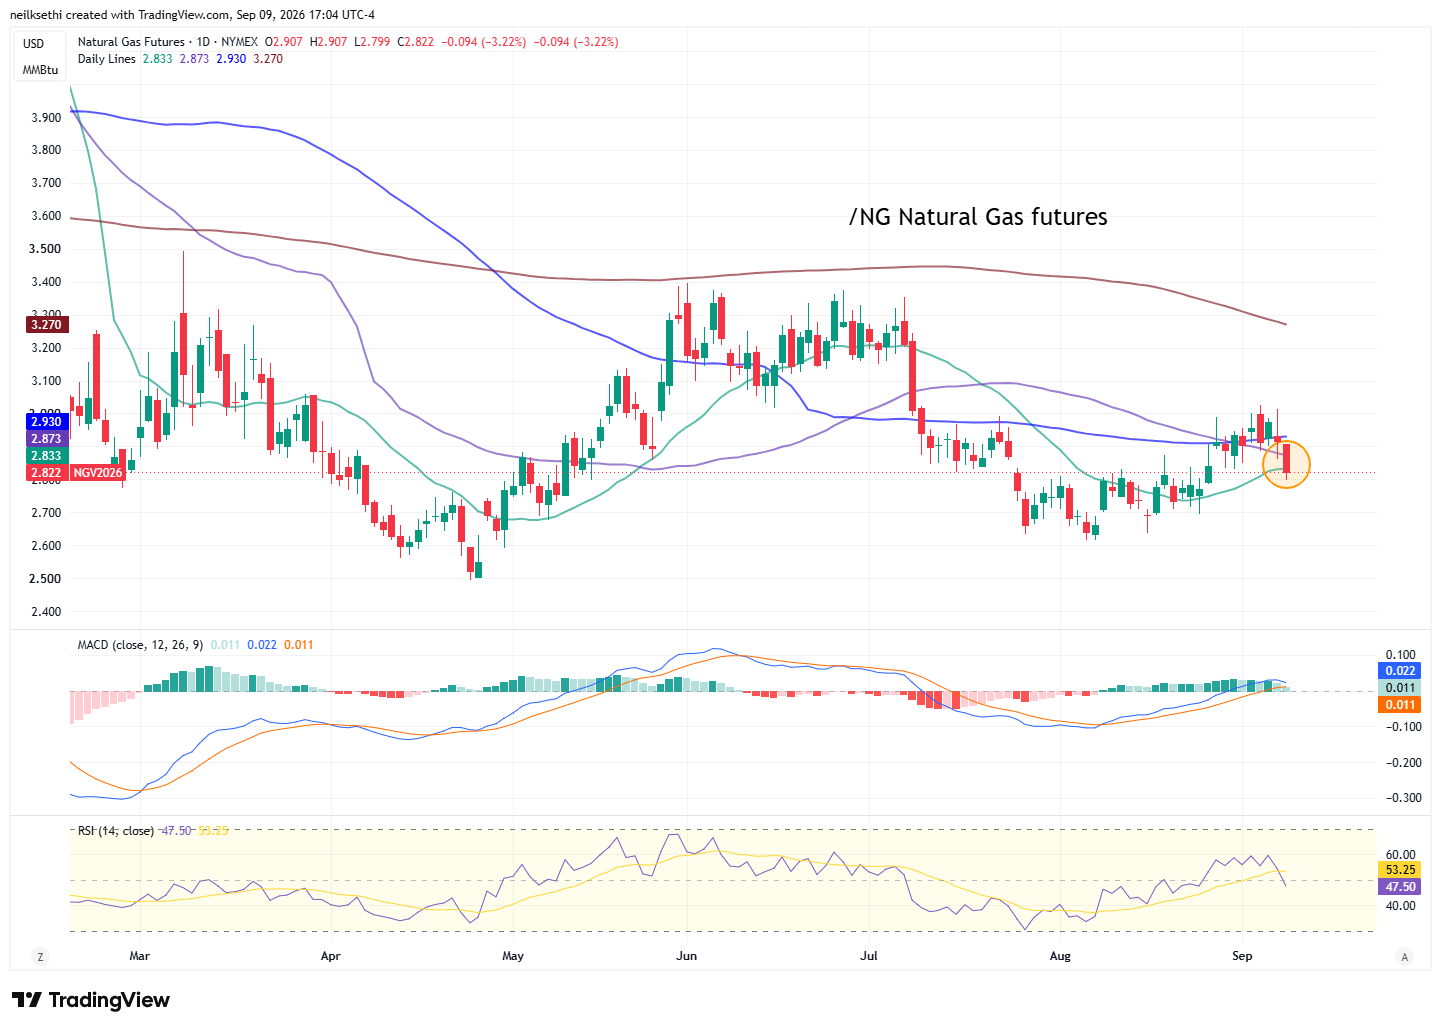
US natural gas futures (/NG) fell back sharply after having failed at retaking the $3 level for the previous four sessions. The daily MACD still tilts positive but the RSI fell under 50. Overall remains in its range since mid-July.
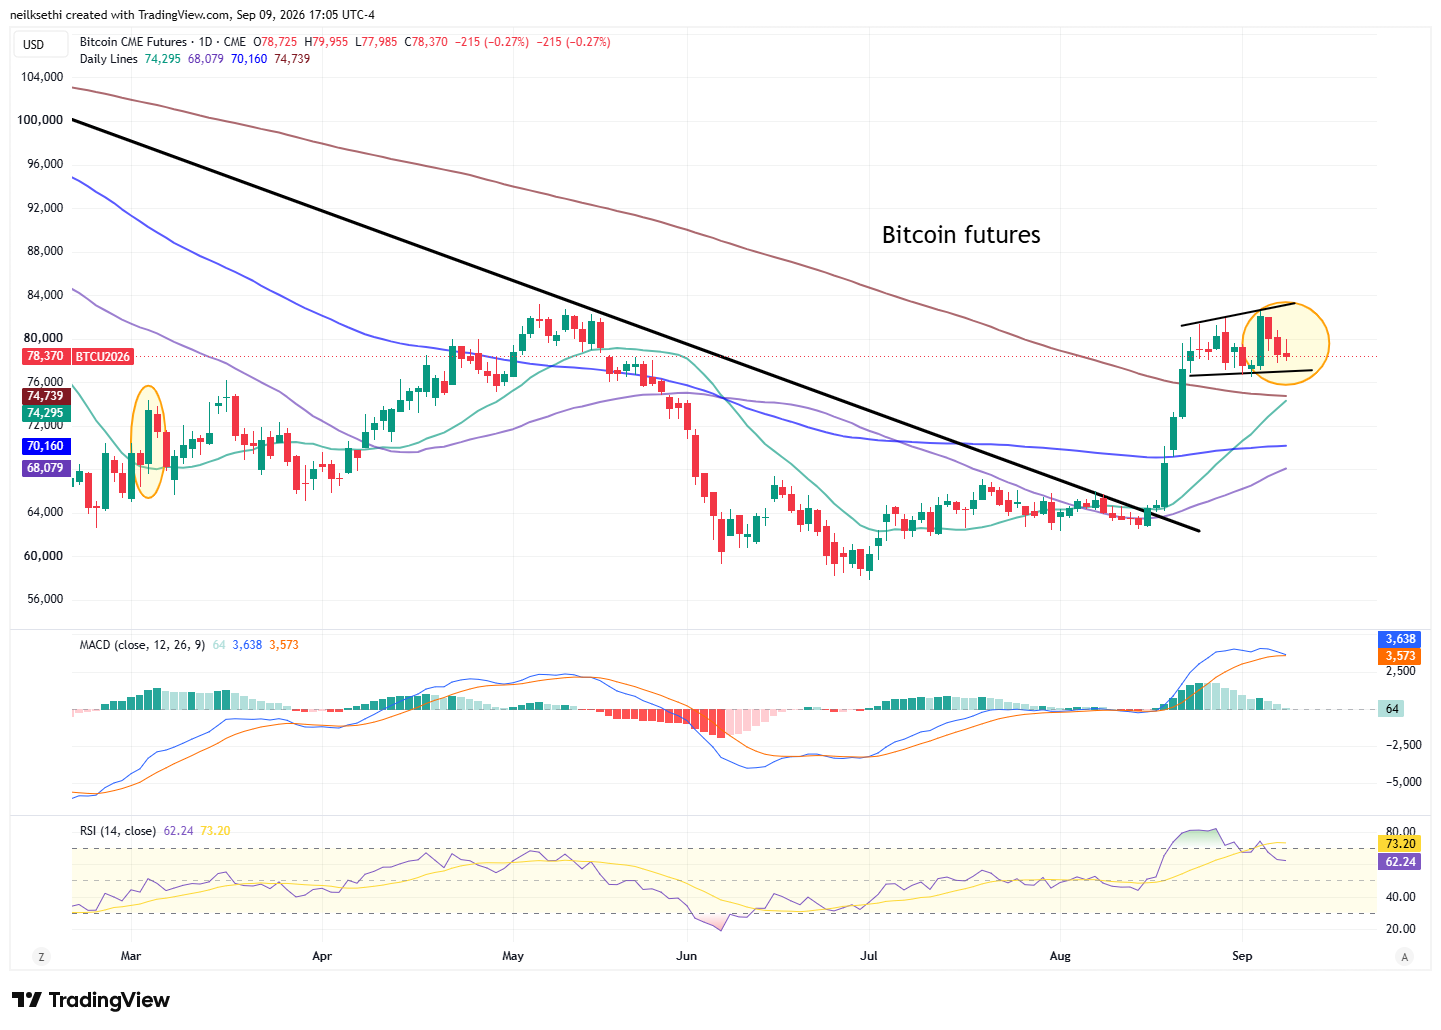
Bitcoin futures continue to trade in their range over the past two weeks consolidating their August gains. As mentioned Tuesday “seems to be forming a sort of bull flag? Daily technicals are starting to slip though. I’ll stay long as long as it holds above the bottom of the flag (and will add if breaks above).”
More From TheStreet Pro:
- Stephen Guilfoyle – Is the ‘House’ on Solid Ground?(“a look at the yen, trade war with Canada, out of control AI”).
- Bret Jensen – Setting the Stage for Stagflation?(Love Bret, but note we often disagree).
- James “Rev Shark” DePorre – Risk of a Market Breakdown Is Building as Oil Pressure Continues
- Chris Versace – Oil Tops $100 Per Barrel, Mortgage Rates Hit 14-Month High: 8 Key Items Shaping the Stock Market Wednesday
Note: I will start putting the early morning notes into the morning update.
Miscellaneous:
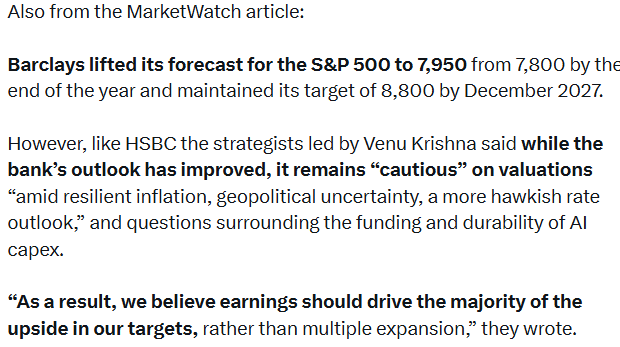
Wrap-up – The Lull Continues
As I said Tuesday:
I mentioned in the Week Ahead the “lull phase” at the end of each earnings season this year noted by Deutsche Bank, as well as the many reasons to be watching for a September pullback, so today’s weakness is not a big surprise.
It was nice to see the AI trade reengage, but less nice to see the broad weakness outside of Energy and Utilities. That has me concerned about the broader market, particularly with the technical deterioration in the equal-weighted SPX.
All of that holds true once again Wednesday. While Ed Yardeni might say that the bond vigilantes (the term he coined) are not back, the market action today seems to indicate otherwise. Since August 25th there’s only been one day that the 10-year yield closed lower, so it seems very much that the market is testing both Treasury Secretary Bessent as well as Fed Chair Warsh. It might not even matter what the CPI prints Friday. As I mentioned in the Week Ahead, markets seem to want their “pound of flesh” and a rate hike might be the only way out unless Bessent is willing to do a lot more than he did today.
Until we see rates cool off (and oil would be a nice complement), it’s clear the non-Tech trade will struggle, and even within Tech things have gotten very bifurcated.
That said, I will again for now remind myself of what I wrote Monday:
The economy continues to look resilient, if uneven, with GDP trackers still pointing to solid growth. Earnings have been extraordinary, and while expectations are for growth to slow, it holds at double-digit levels through 2027. Valuations have continued to ease. Positioning is not uniformly stretched — on the discretionary side in particular there is plenty of room to move higher. And outside of BofA’s Bull & Bear Index (which hasn’t been much use since it was reformulated in December), sentiment sits just moderately bullish to neutral (a good place for equity gains historically).
The technical and flow picture reinforces it: dealer gamma is positive again, suppressing volatility and encouraging larger systematic holdings; buybacks are back in full force; and retail continues to keep allocations high. None of this eliminates downside risk, but together it makes it hard to turn too negative unless the data, rates, or flows deteriorate more meaningfully.
So my view continues to be that the setup is constructive — but with positioning this extended and markets on edge, this is not a time to be complacent. Pullbacks and chop come with the territory, and a material pullback would not surprise me. But as of now there’s no reason to make that our base case.
We haven’t gone far enough for any of that to have changed, but we’re edging closer in many respects (gamma is thinning, CTA sell triggers are closer, key technical levels are drawing closer (or have been broken), rates are drawing closer to levels where we’ve seen market pullbacks in the past, etc.). And I’ve found myself doing more selling than buying this week as positions hit stop out levels (like with the SPX equal-weight index mentioned earlier). As I said “this is not a time to be complacent”.
Things Start to Pick Up Thursday
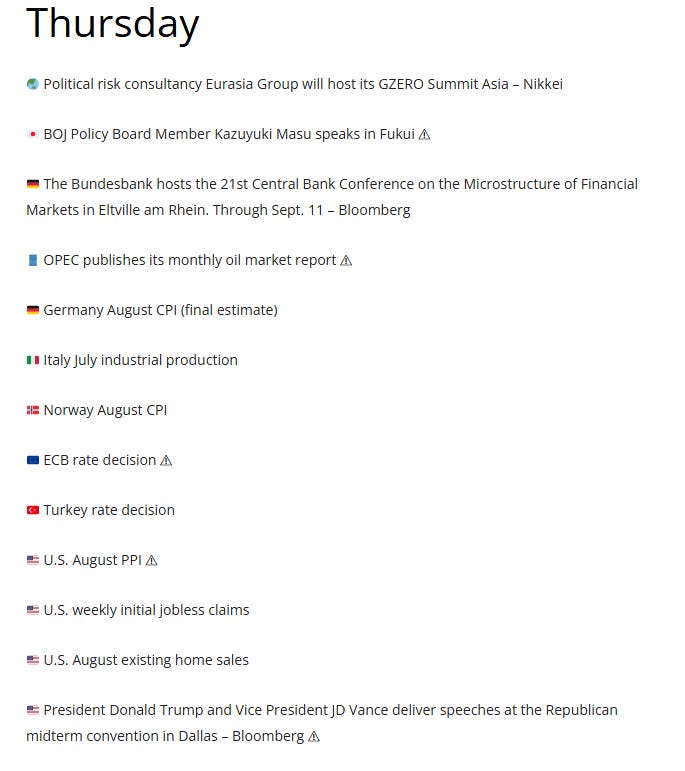
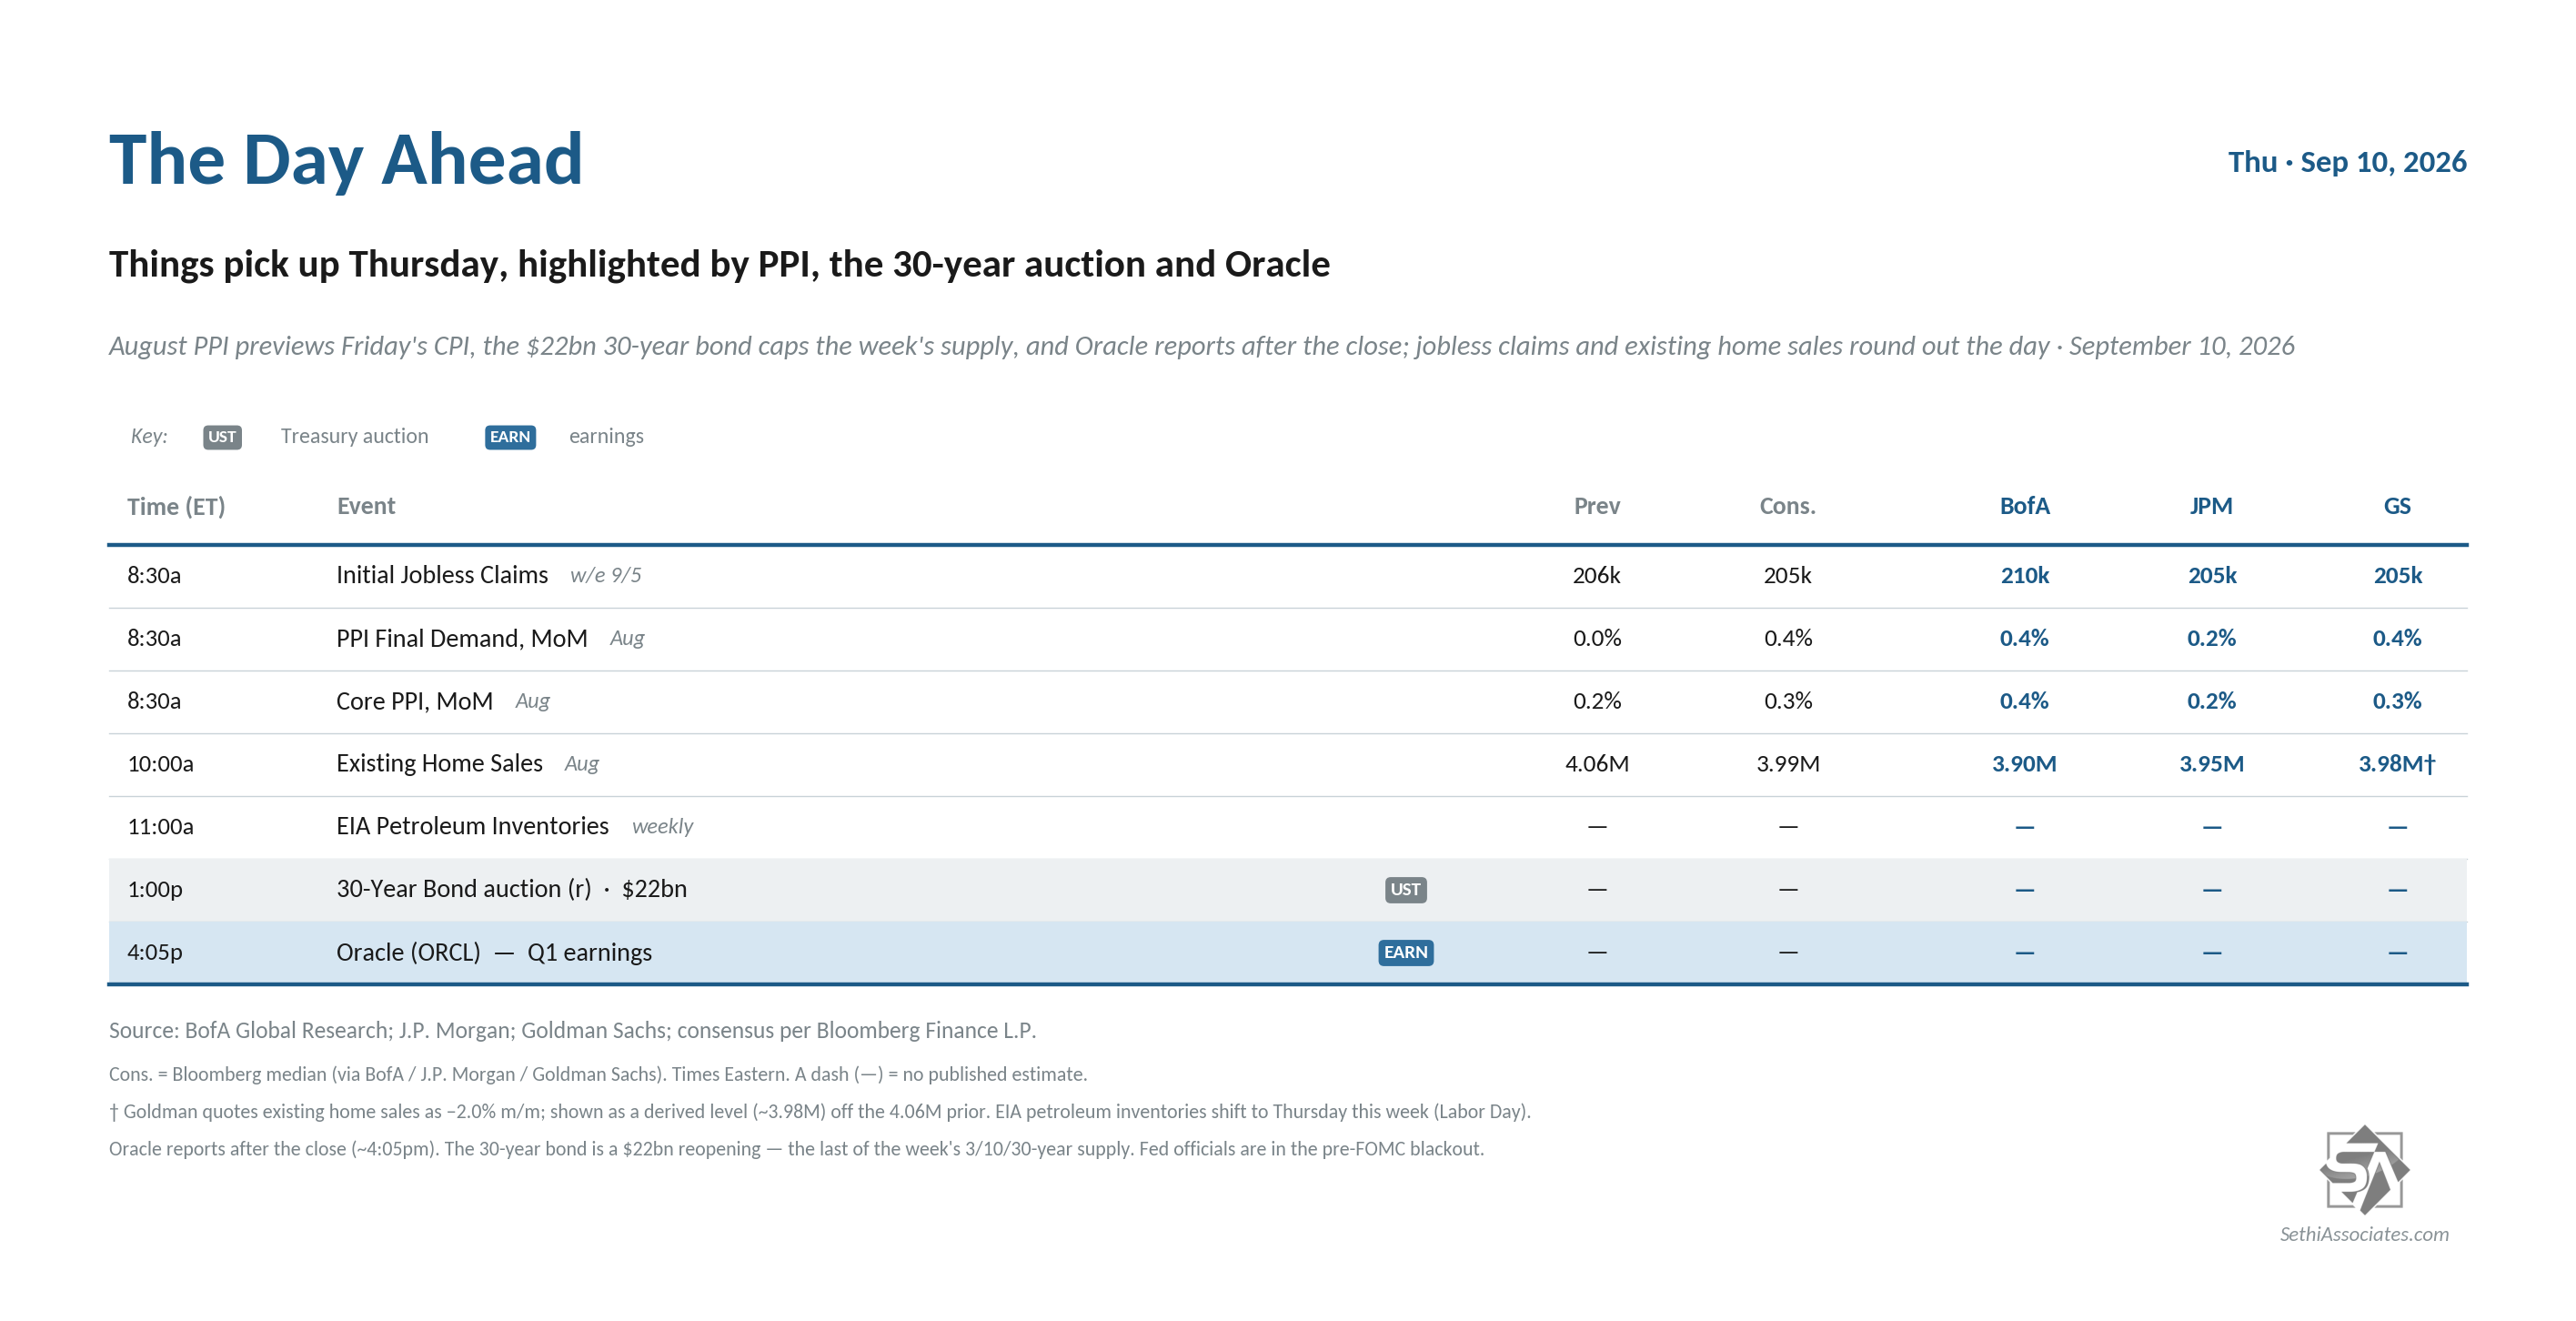
Thursday things pick up with the first of our double shot of inflation reports this week in August producer prices. We’ll also get August existing home sales and weekly jobless claims and US petroleum inventories.
No Fed speakers with the blackout in effect.
Non-Bill (>1yr in maturity) US Treasury auctions wrap up with another anticipated auction in the 30-year bond.
In terms of corporate events, we continue to wrap up Q2 earnings season but a heavier day Thursday with three SPX components reporting led by hyperscaler Oracle (ORCL) along with Adobe (ADBE) and Copart (CPRT).
Ex-US highlight is the ECB’s rate decision where a rate hike is a virtual lock, so attention will turn quickly to any indications of the likelihood of future increases. We’ll also get a policy decision from Turkey, CPI from Germany and Norway, and UK house prices. OPEC also publishes its monthly report.
Finally, US President Donald Trump and Vice President JD Vance are expected to deliver speeches at the Republican midterm convention in Dallas.

From Christophe Barraud’s Week Ahead: