What If ‘Equal Weight’ Isn’t Equal?
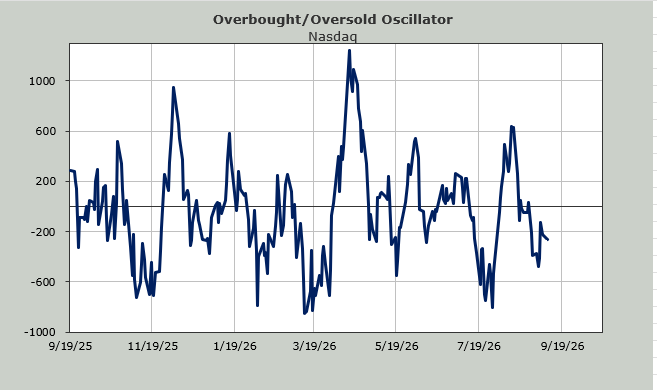
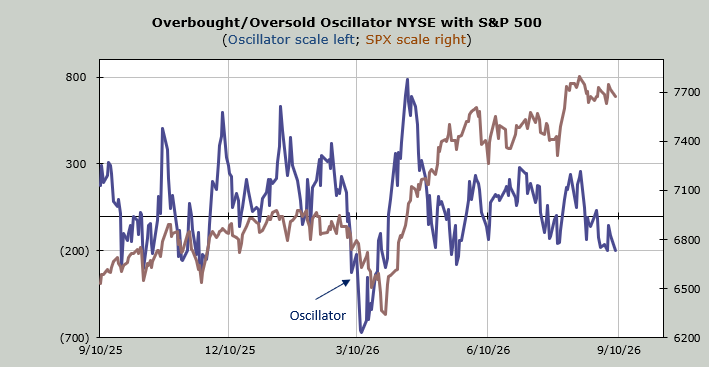
Now I know why the RSP doesn’t look like any breadth indicators I follow.
You've reached your free article limit
You've read 0 of 1 free Pro articles.

Up until recently I have rarely looked at the Invesco S&P 500 Equal Weight ETF (RSP). It’s not that I was opposed to it, it’s that I have so many other indicators that represent what the market is doing as a whole and I can see in my charts how it is distributed.
For the last month I have been harping away that RSP looks nothing like all the other indicators I have that represent the “others.” I have desperately tried to figure out why and quite frankly the only thing I can come up with is that it isn’t equal weight in the same manner that, say breadth is. And likely not the same way most think it is.
The ETF has just over 500 stocks in it. Eleven of those stocks are energy. Twenty-eight are semiconductors or related. For healthcare and biotech there are 30-35. I can go on but I won’t. But let me ask you this: Doesn’t equal weight to you mean equal? If you decide how many stocks of whatever group are in your index then aren’t you basically weighting it? Oh I know they mean market cap but it’s still a weighting isn’t it? Because healthcare is officially 8% of the S&P and in the equal weight it’s closer to 11%.
Using their methodology, healthcare is pretty much equal weight to semiconductors. That’s great. But energy is one-third of what healthcare and semis are. Not so equal. But at least now I know why the RSP doesn’t look like any breadth indicators I follow.
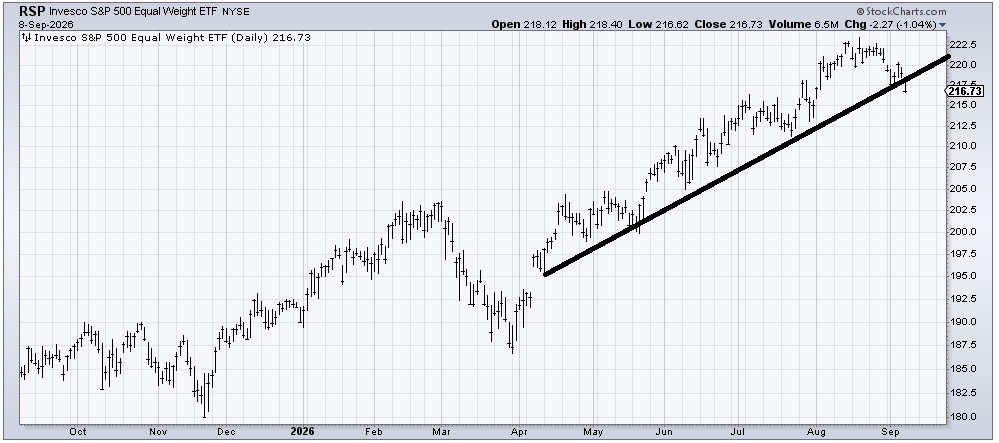
With that rant out of the way, let’s check in on the RSP chart because no one talks about how great the equal weight is anymore. And when was the last time you heard about the market’s broadening out? Right, because since the second week of August it has been narrowing and in the last week or more that has accelerated.
If you squint hard you can see the RSP broke that uptrend line dating back to April. I will give it some leeway to recapture it, but that is a minor lower low (than last week).
It has been my contention that the “others” should underperform in August and for the first two weeks of August that was the wrong call, but it has caught up in the last few weeks.
Elsewhere not much changed except we finally got some movement in the Daily Sentiment Indicator for Crude Oil. It tagged 90 on Tuesday. Can it go higher? Sure. Can oil go higher? Sure. But when the DSI gets to 90 or more I see the runway as short.
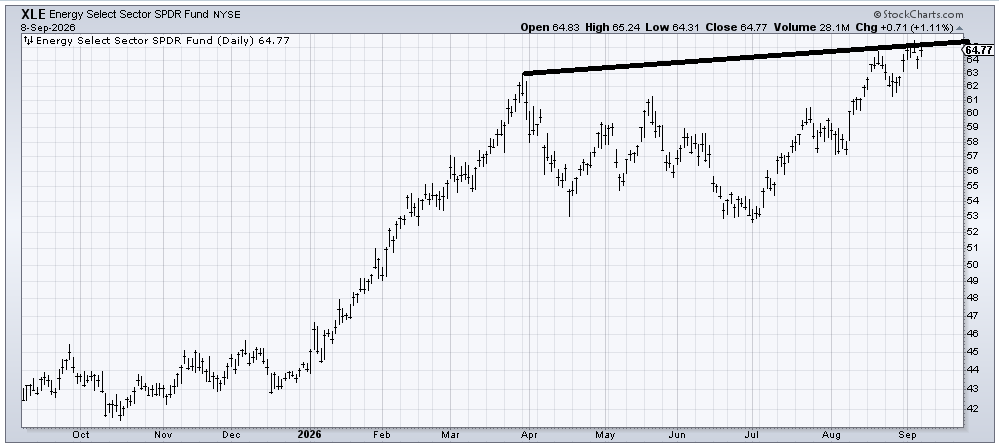
The State Street Energy Select Sector SPDR ETF (XLE) has been smacking up against resistance for a week now, after having gotten there in mid-August and backing off. It’s always possible something in geopolitics heats up more and this goes parabolic but barring that, I think energy is tired up here and profits should be taken.
Aside from that none of the indicators changed. This seems to be a daily refrain now. It was more dribbling and more complacency while tech felt some love for the third straight day.