How Well Is the Market Holding Up? Could Be Better.
The equal-weight S&P is off 5% and new lows are climbing. Is that healthy? Let’s look closer.
You've reached your free article limit
You've read 0 of 1 free Pro articles.

The Market
You know what today resolved? Nothing.
You know what today’s action gave us? A whole lotta folks who discovered the equal-weight S&P has been garbage for weeks now. It broke the uptrend line (yesterday), and that continued today. I even heard someone say, albeit just casually, that the RSP is now down almost 5%. Like it’s no big deal.
Then I heard someone say that ‘there is so much bearishness’ out there. I, too, hear the chatter. I see none of it in the data. None of it. The put/call ratio for today, despite the now near 5% decline in the RSP, was .82. Yesterday’s equity put/call ratio was .48. Where is the action to go along with all the bearish chatter?
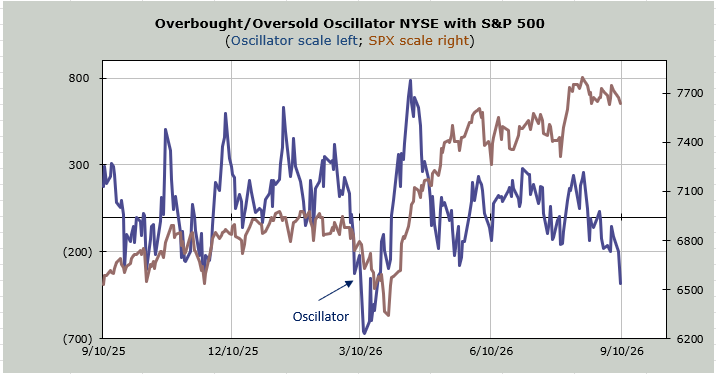
Then I heard a discussion about how well the market holds up in spite of the move in rates. What market? The S&P that can’t break 7600? That must be what they are discussing because, again, the RSP, which was so well loved mere weeks ago, is down 5%. And we don’t get my Overbought/Oversold Oscillator oversold if the market is holding up so well.
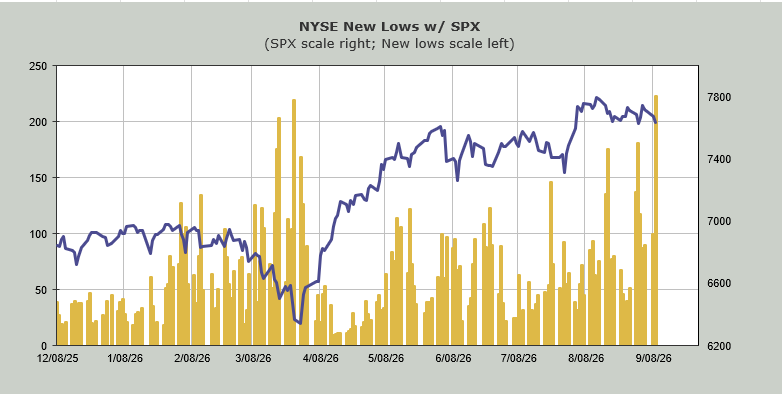
And we don’t get the number of stocks making new lows on the NYSE topping where they were at the late March low if the market is holding up so well.
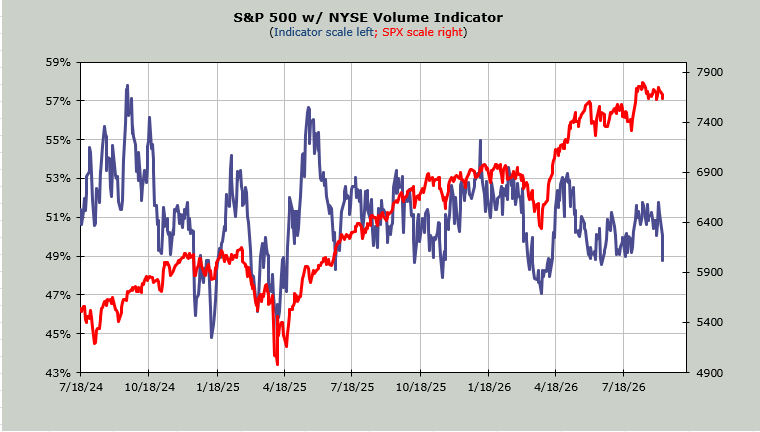
And we don’t get the Volume Indicator (shown below) down to 49% if the market is acting well. What they really mean is the S&P doesn’t break down. The S&P has held that 7630 area, with this being the third trip down. The DJIA did the same, but today it broke (chart shown here yesterday). The IWM is also sitting right at a critical level (290). So are the midcaps. So are the banks.
The SOX is now green for five straight days; it hasn’t gone six straight since late April. That makes tomorrow a test for the semis. It also means that if the semis/tech are red, it would allow the others to have a bit of an oversold rally. But what we should really want is a day where everything goes down together. Because that would shake up these complacent folks.
New Ideas
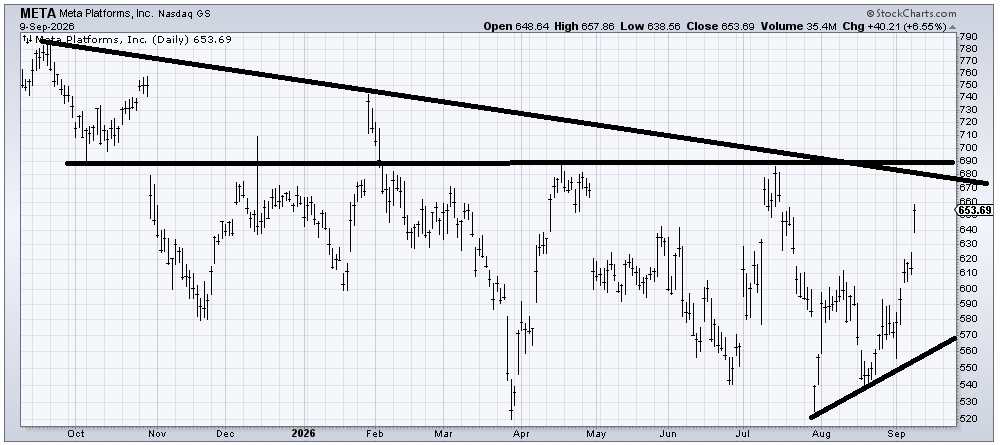
I recommended Meta (META) last week, the day it had that big reversal (it closed just under 580 after having traded just under 560). I have been asked for a follow-up. At the time, I did not know it would surge as it has. I thought it might take a more meandering route. That having been said, it is short-term overbought up here. But I think after a pullback, it ought to make its way up toward the top of the range.
Can it break out over the top? I think it can, but in this market, I am going to be conservative and stick with the top of the range for now.
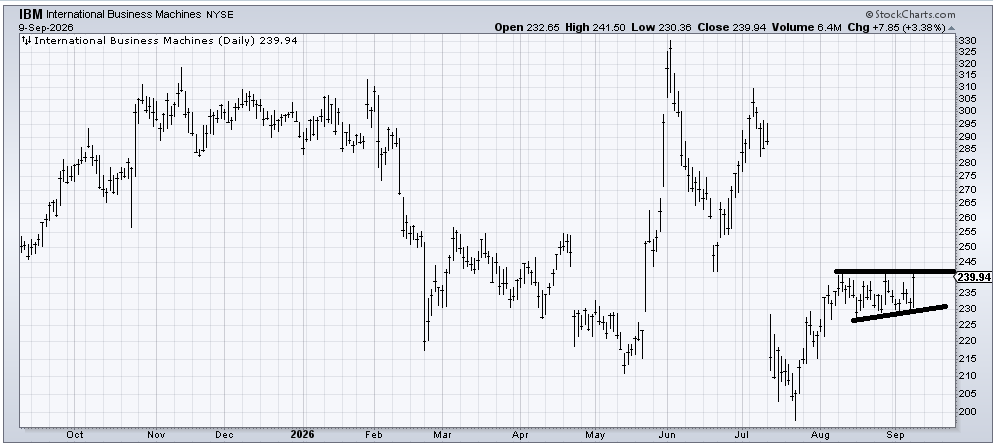
I would also note that IBM (IBM) has had a nice sideways consolidation after its lift off the July low. I would use a stop under 230.
Today’s Indicator
The Volume Indicator is discussed above.
Q&A/Reader’s Feedback
Helene welcomes your questions about Top Stocks and her charting strategy and techniques. Please send an email directly to Helene with your questions. However, please remember that TheStreet.com Top Stocks is not intended to provide personalized investment advice. Email Helene here.
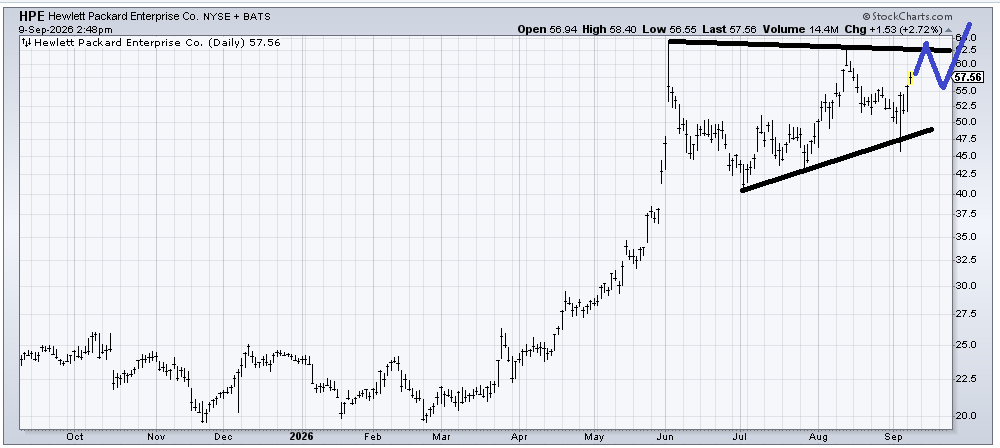
Hewlett-Packard Enterprise (HPE) has had a nice correction since June, and it has held support, so the stock is just fine. But those two spikes at 62-63 are a problem as best as I can tell. I am inclined to think that stops the rally in the near term, but if it can map out as I have drawn in blue, then I would get more interested in believing it can breakout.
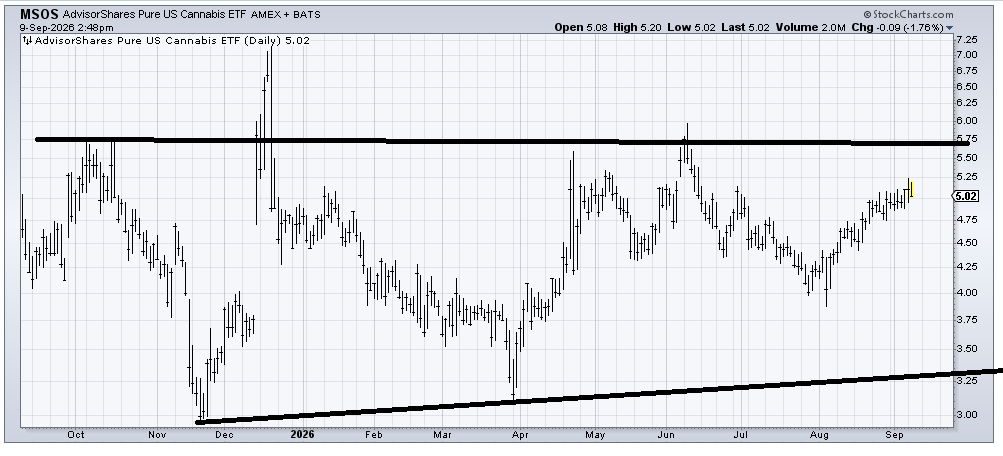
MSOS (MSOS) is an ETF to be long the pot stocks. I realize it looks like a giant base is building but it always seems to look like a base is building and goes nowhere. I think it can rally toward resistance around 5.75-6, but it doesn’t look to me as if it wants to break out.
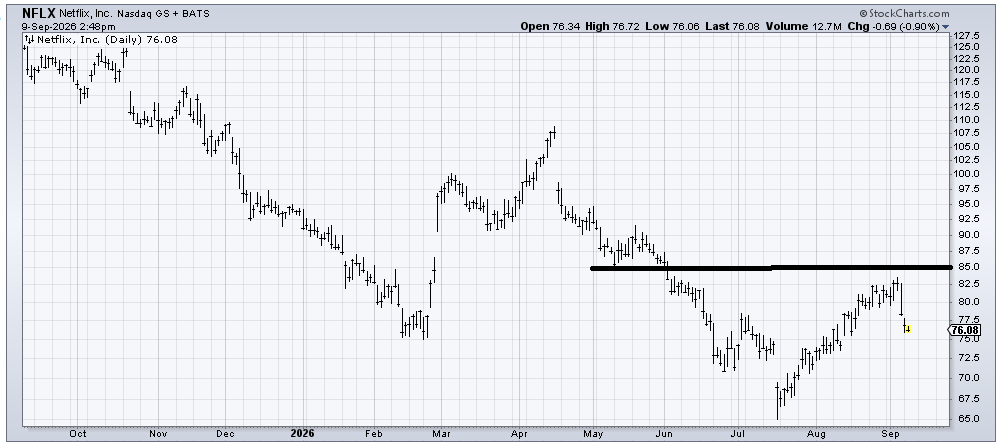
Netflix (NFLX) is short-term oversold, and it has some minor support at 75, but that’s the best I can say about it now. If the stock can hold and mill around 75 for a few weeks, I might warm up to it, but otherwise, it looks like it’s in the middle of nowhere to me.
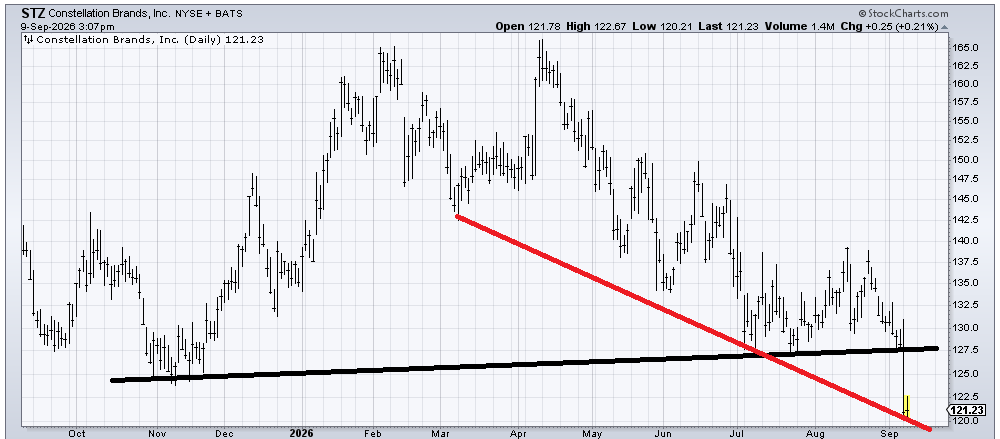
Constellation Brands (STZ) broke down from some decent support. Short term, it is oversold and should bounce off that red line, but a rally to the black line should halt it. Perhaps a decent year-end tax loss candidate, but that’s the best I see now.