Here’s What Needs to Happen Before Stocks Have a Tradable Rally
Let’s look at the indicators to see if investors are panicking and how close we are to some sort of a potential rally.
You've reached your free article limit
You've read 0 of 1 free Pro articles.

The Market
Well, we got an up day in Nasdaq but not the S&P. Can we try for another green day tomorrow? This is not what folks want to hear, but a green day tomorrow followed by some renewed downside might finally get us to a market that is oversold and sees sentiment as bearish, which would be enough for a tradable rally. Hear me out.
I don’t love the fact that the Investors Intelligence bulls notched up four points this week to 41.5% and the bears fell to 22.6%, but if we see a push lower into next week, I don’t think we’ll get more bears than bulls, but we could get the bears to the upper 20s and the bulls into the mid-30s. To get a truly durable low, I think we will need to see this get at/near 1.0.
The DSI for the S&P is now 15. Nasdaq’s is 20. A push down into early next week should get the S&P close to single digits and maybe even Nasdaq under 15.
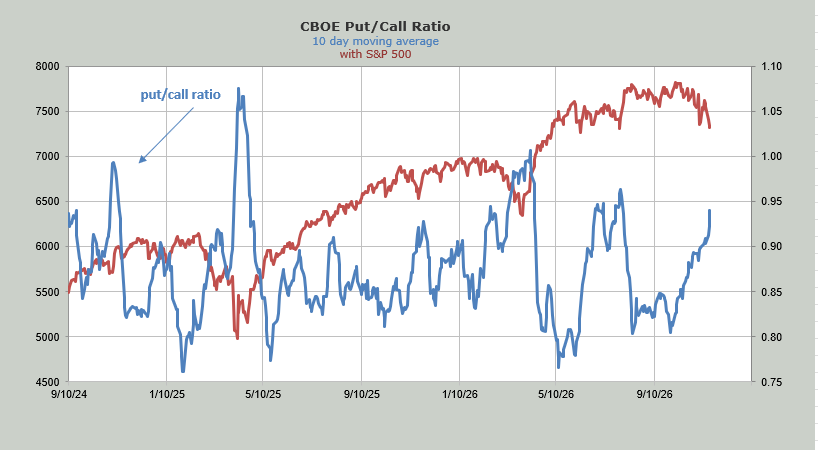
The ten-day moving average of the put/call ratio is now at .97. Tomorrow’s moving average ought to tick down (it’s the math), but if the next few days after that are in the 95+ area, this could match the July reading.
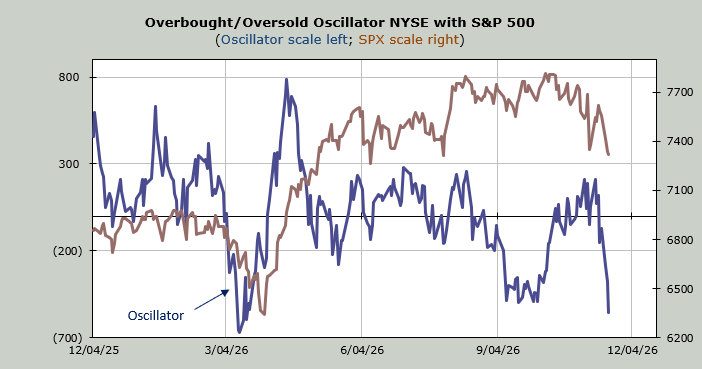
My own Overbought/Oversold Oscillator, which you might recall a week ago I said was overbought this week, would be back to an oversold condition midweek next week. I know it looks oversold now, but the math says a bounce tomorrow and one more push down would get it there.
The Hi-Lo Indicator, which I noted last week had begun to roll back over, is now in the upper teens. It is possible it scoots back under .15 to an oversold condition early next week. The chart will be shown Sunday.
The McClellan Summation Index is still heading down. But over on Nasdaq, where it has never bounced, and I use net volume instead of net breadth, it now requires a net differential of +7 billion shares to halt the decline (up minus down volume). Get that to +10 billion shares or more, and it’s oversold.
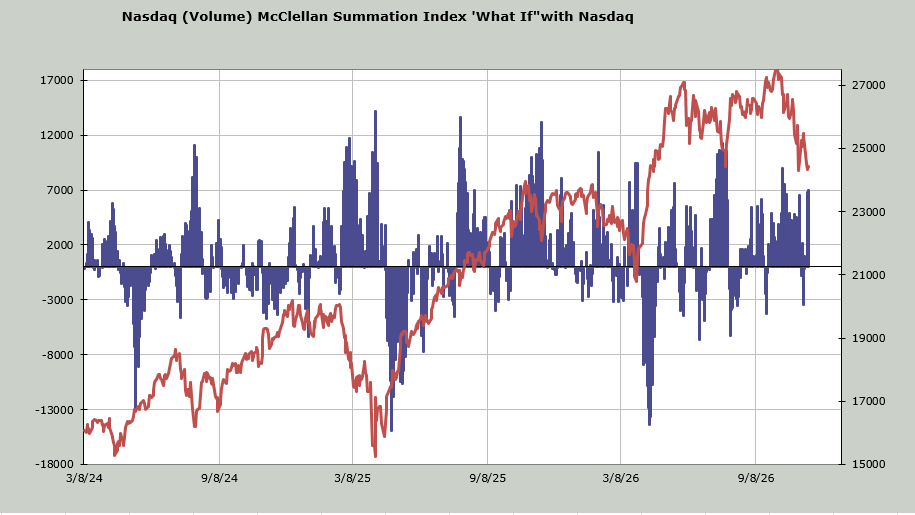
This is a possible setup. We haven’t seen the indicators get this close in a long time. I know folks don’t want to hear it, and none of us wants to see it in our portfolios, but we really are on the verge of a panic; the seeds are in place.
What if we just rally without the panic? Then I think we’ll just see more of what we’ve seen: rallies that don’t last long, and the declines are more drippy than anything else.
New Ideas
I am just going to list some of the DSI’s that are extreme here. Most of the readings are in the metals. Gold is at 10. Silver at 9, Platinum at 9, Palladium is 9. Copper is still (relatively) high at 15.
The DXY is still only 78, but the Euro, its largest component, is 10. Bitcoin is 13.
So it really does feel as if we are close to some form of extreme.
Today’s Indicator
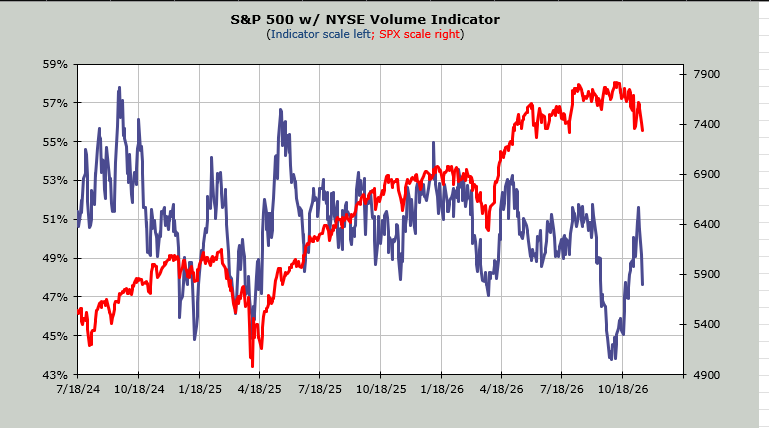
The Volume Indicator is back down to 48%. If we get this back under 47%, it too will get oversold.
Q&A/Reader’s Feedback
Helene welcomes your questions about Top Stocks and her charting strategy and techniques. Please send an email directly to Helene with your questions. However, please remember that TheStreet.com Top Stocks is not intended to provide personalized investment advice. Email Helene here.
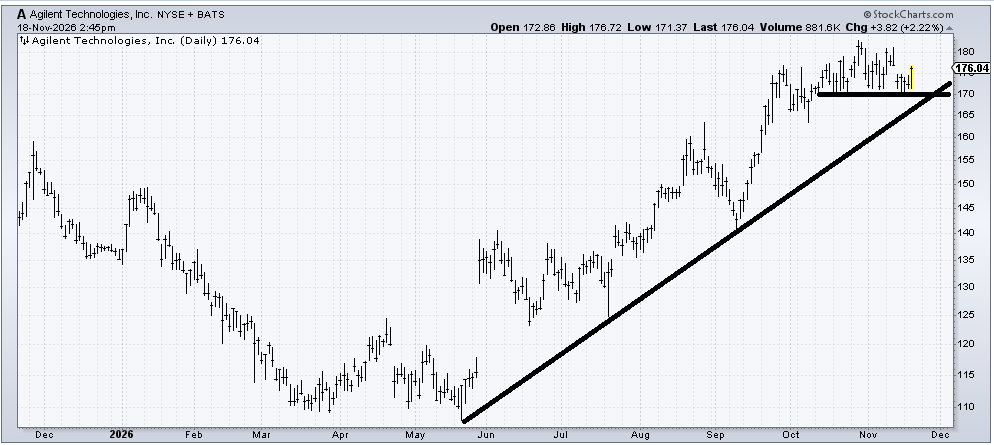
Agilent (A) hasn’t done anything wrong yet. If it breaks under 170, it would break that uptrend line and the flat line at the same time. If you want to give it more leeway, use 165, but I would not take my eyes off it, and I would get very concerned if that support area is broken.
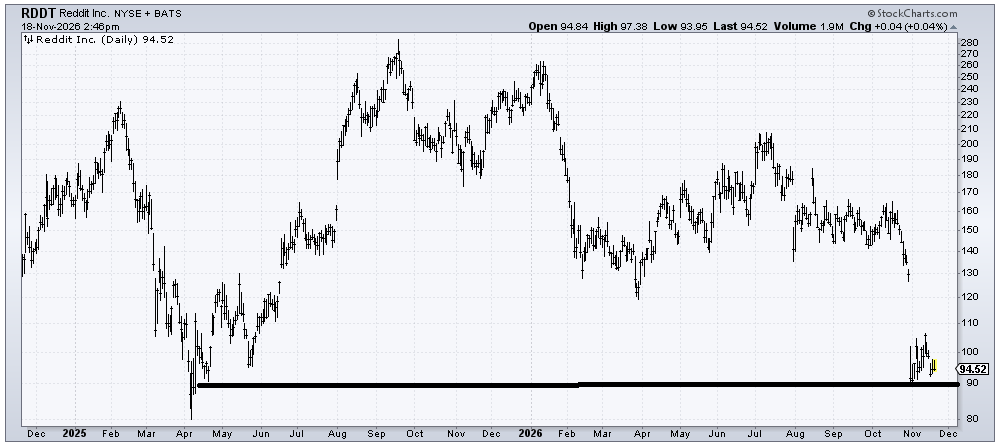
If the market were in better shape, I’d look for Reddit (RDDT) to have an oversold bounce/tradeable rally. But the market isn’t in great shape. But that’s the best I can say about Reddit now: oversold rally potential.
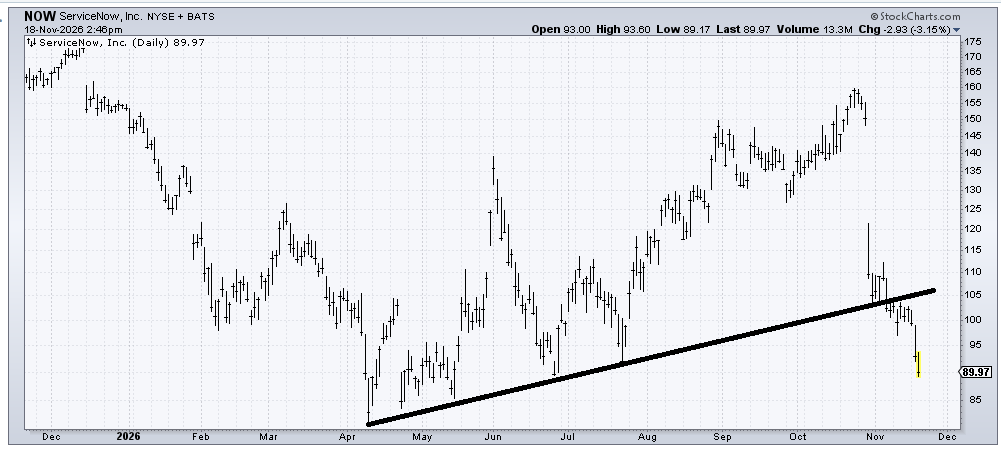
ServiceNow (NOW) is into a support area, but I’m not sure there is much else to say about it. It’s oversold, but where is it going on the upside? If it rallies to 100, I’d sell.