Did Today’s Dull Trading Foreshadow a Rise in Volatility?
Despite the dullness, there were some interesting things to notice. Let’s dig into the NYSE New Lows indicator and more.
You've reached your free article limit
You've read 0 of 1 free Pro articles.
The Market
This was probably the dullest day of the year for the market indexes. And all the statistics confirm it. Heck, NYSE volume was higher on the Friday before July 4th weekend!
There were some interesting tidbits, though. The number of stocks making new lows on the NYSE expanded. As most of you know by now on Nasdaq, my line in the sand is 200 for new lows. I prefer to see the number of new lows stay under 200. Once over that level, the markets tend to get dicey.
For the NYSE, the level is around 100. Get over 100 new lows, and we tend to show weakness in the coming weeks. If this goes over 100 while we are getting overbought and while sentiment is getting giddy, it could mean the latter part of August will see a rise in volatility.
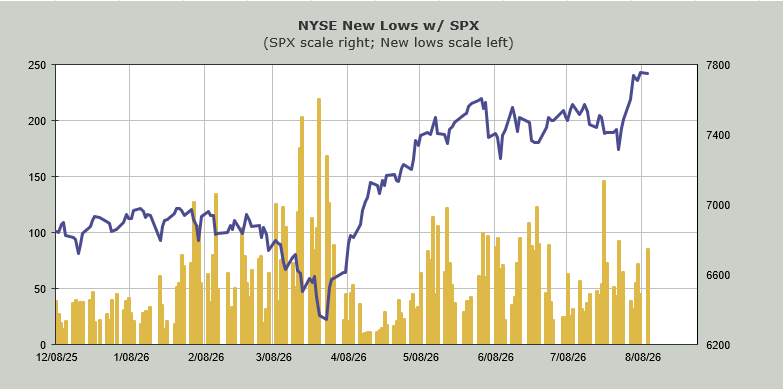
And we are now overbought or will be by midweek. And I know the RSP, everyone’s favorite new index, was not red today, but breadth was. And the McClellan Summation Index remains stuck, unconfirming this move in the RSP.
Finally, not one of the readings on the DSI changed today. For example, Gold stayed put at 79. If it creeps into the low 80s, I will fuss, and if it gets over 85, I will do more than fuss!
The DSI for the VIX is still 17. Bitcoin’s DSI did drop to 16. And bonds are at 22.
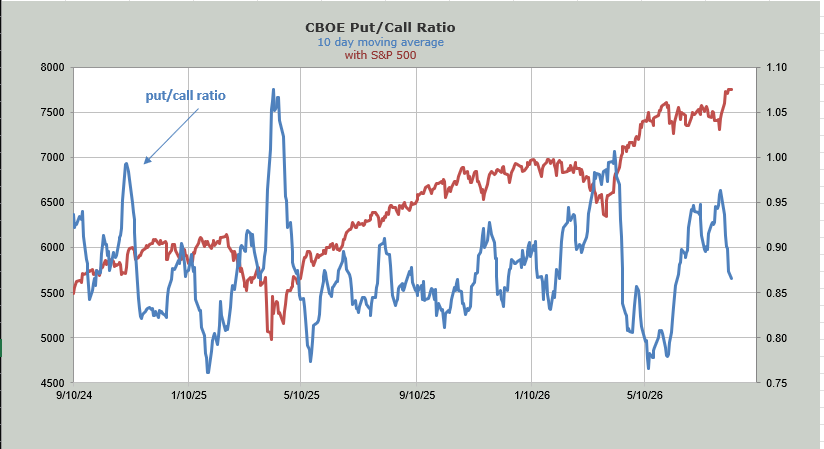
The ten-day moving average of the put/call ratio fell a bit more and now resides at .86-ish. I expect that to fall more as the week moves on.
Generally speaking, with the exception of software and energy, it was a day of sloshing around.
New Ideas
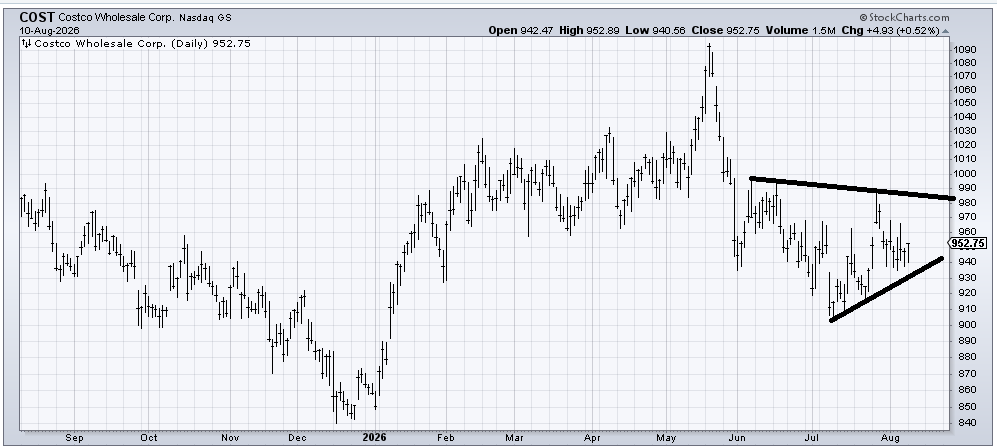
Costco (COST) hasn’t done much since I recommended it a few weeks ago, but it continues to shape up. I would prefer to see it stay over that 920-930 area.
Today’s Indicator
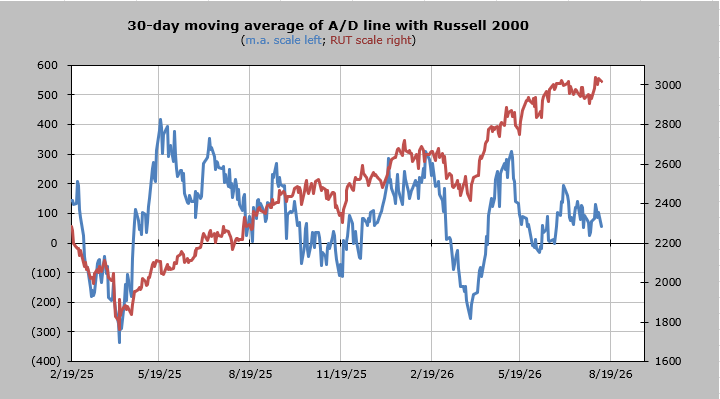
The 30-day moving average of the advance/decline line is overbought.
Q&A/Reader’s Feedback
Helene welcomes your questions about Top Stocks and her charting strategy and techniques. Please send an email directly to Helene with your questions. However, please remember that TheStreet.com Top Stocks is not intended to provide personalized investment advice. Email Helene here.
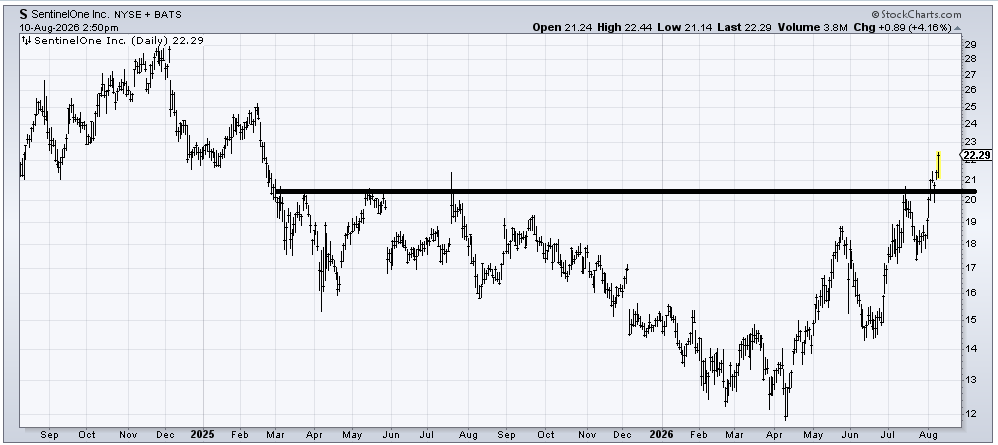
Sentinel One (S) finally broke out of the base we’d been eyeing for a while. There is resistance all the way up, but as long as the stock does not break back under 20-ish, the target is up near the old high (27-28-ish).
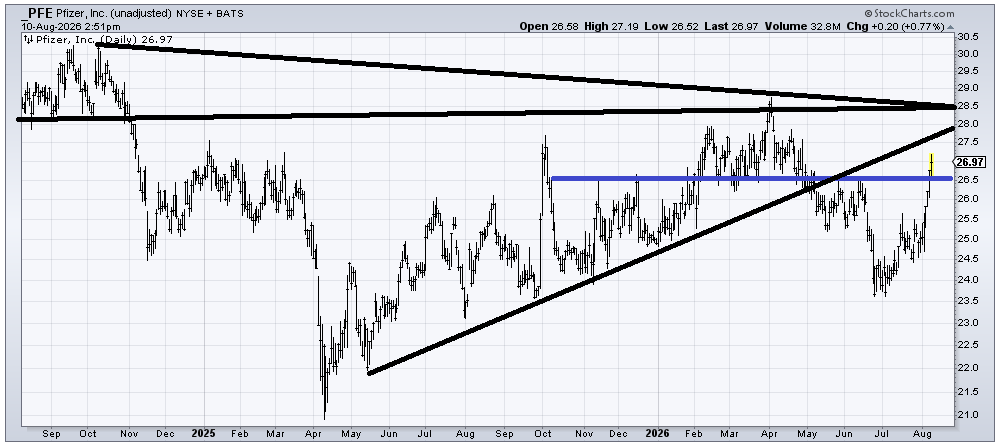
Pfizer (PFE) finally moved. We must be near the end of the rally! (smile). It is into resistance now and has a ton of resistance in the 28-29 area. I would not want to see this retreat much under 26.50 on a dip (blue line).
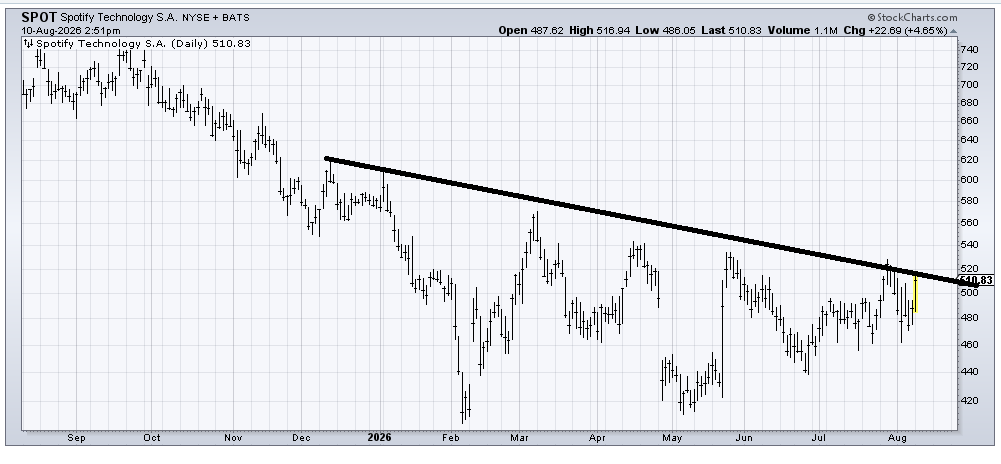
Spotify (SPOT) is trying to base. And trying to cross that downtrend line. I like the chart, but I don’t want to see it back under 460, and I want to see it up over 540.
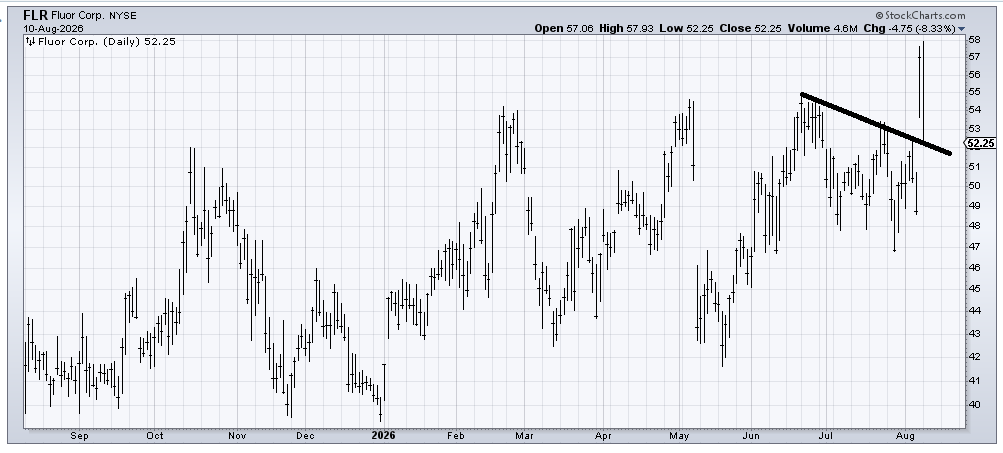
I have no idea why Fluor (FLR) gapped up and then gave it all back and more today, but that is not great action. If the stock can hold this 51-52 area, then it will be okay, but it must hold, or else this will be a false breakout.