Despite Semis Shock, the Market Remains Firmly Complacent
Do we bounce early and then go down again or do we just slide? That will tell traders a lot.
You've reached your free article limit
You've read 0 of 1 free Pro articles.

The Market
Last week, as it has seemed to be for almost every week this year, was about the semis. So let’s talk about Nasdaq and the semis.
In the big picture — call it “intermediate term” — I still see complacency. My guess is that some of the sentiment indicators will change this coming week, but as of last week we had the Investors Intelligence bulls at 55.5%. We had the AAII folks leaning toward the most bullish stance since January. We had the NAAIM folks at 95 in their exposure.
On Friday, we finally got the put/call ratio to rise to .97 — but consider that on July 8 it was 1.03 and on June 26 it was 1.12. So, at least there was a little more concern on Friday.
The Citi Panic/Euphoria Model remains solidly in Euphoria. The insider selling had become elevated a few weeks ago (that chart was shown here three weeks ago). Of course, no one cared three weeks ago and now that the market has sold off there was much chatter about it late last week.
The Market Vane bulls remain at 77 (very high and extreme). The Consensus bulls are at 76, which is also near the extreme. And the VIX is far from elevated let alone jumpy.
In addition to this, none of my intermediate-term indicators are solidly in oversold territory. Some of them sit on the precipice of getting there, but have not tumbled over to get there.
I can give a lot of reasons for the complacency, but I suspect it’s because the selling last week was primarily in the semis. But recall that, about two months ago, I noted that if you wanted to make a story about the economy you would say that commodity/economically sensitive stocks have bearish charts while the more defensive names are being favored. Yet bonds have not lifted to show a lower interest rate yet. Now you can see why I am so bad at narratives!
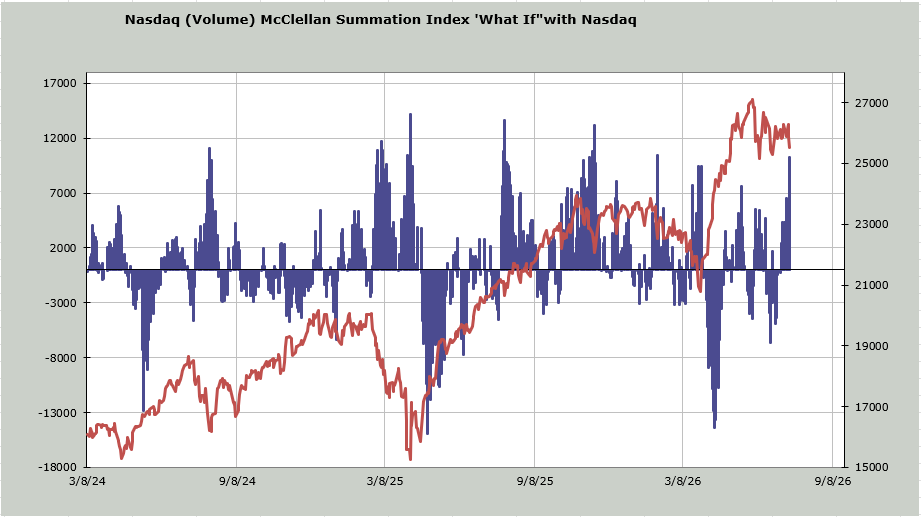
In the near term, the semis/Nasdaq is getting oversold. We can see it in the “what if” for the McClellan Summation Index. Nasdaq’s, where I use volume, has been heading down for weeks (bearish). Now it will take a net differential of +11 billion shares (up minus down volume) to halt the decline. Since Nasdaq trades approximately 7 billion to 8 billion shares each day, you can see that it would take at least two amazing days of upside volume just to halt the decline in the indicator. That’s what makes it oversold.
Then I go to the Nasdaq Momentum Indicator. I plug in lower closing prices for Nasdaq over the next two weeks to see when/if the indicator stops going down and turns up while price goes lower (that’s the definition of oversold). With the usual caveat that this is not meant to capture the exact day, but the general time frame, that day is about a week from now, on July 28.
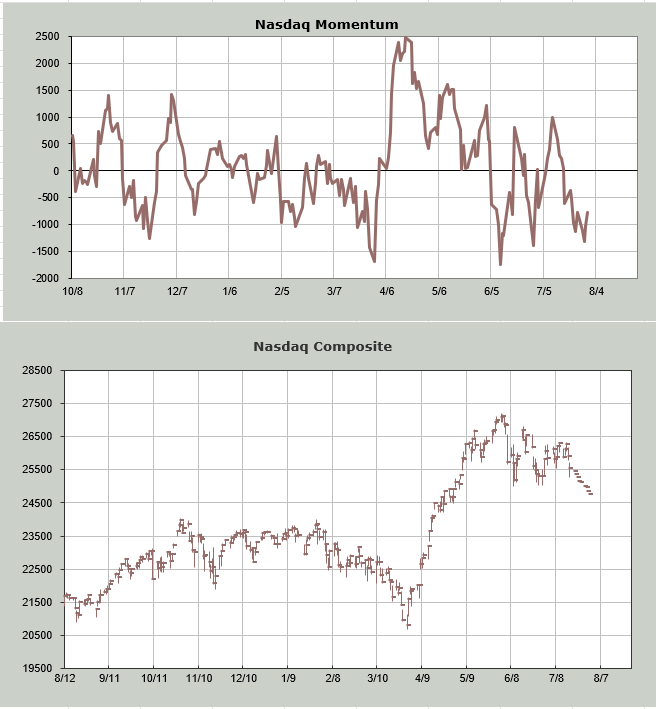
What I am grappling with right now is which scenario plays out: do we bounce early this week and then down again or do we just slide? Both get us to a short-term oversold condition late this week/early next week. But which one gets the VIX jumpy? Which one gets sentiment to shift from complacent to panic?
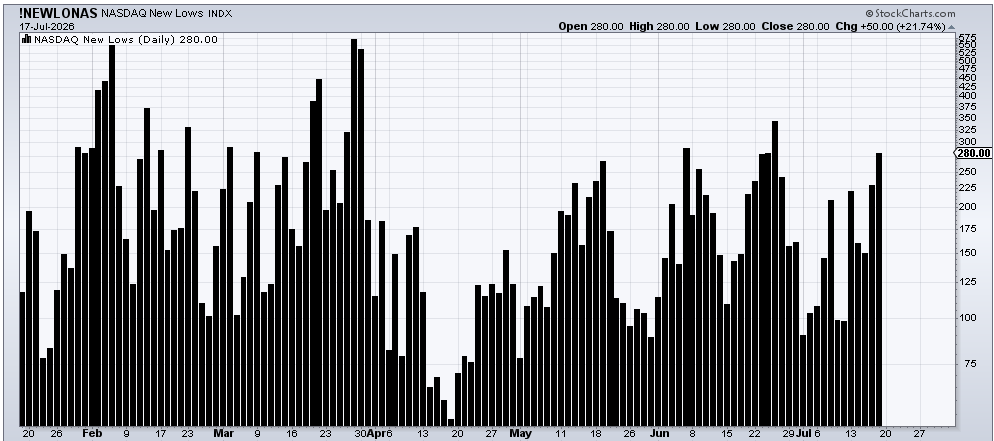
One indicator that I will have on my screen should we see Nasdaq break this 25,300 area (the twin June lows) is the number of stocks making new lows. Will it exceed the 344 we had in late June or will it not? The latter is bullish.
New Ideas
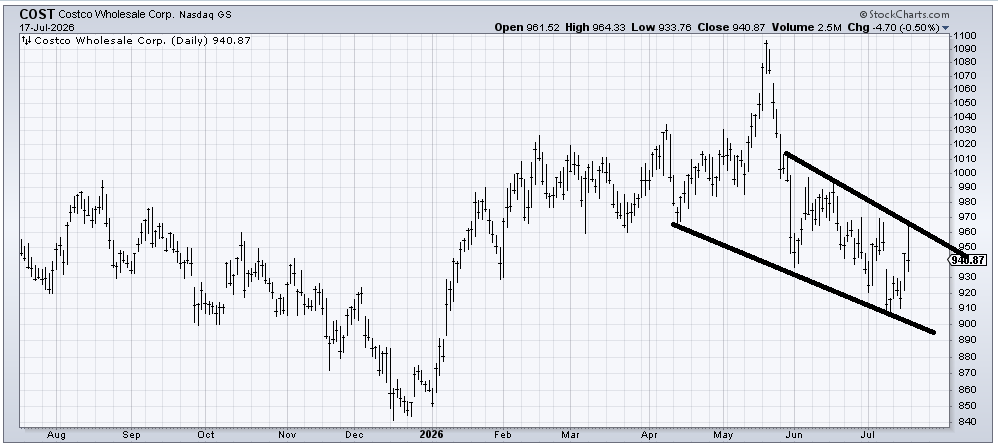
We’ve had several great trades in Costco (COST) in the last year. And one giant stinker, when it broke out and I thought 1,030 would hold and rally. Instead it sliced through it like a hot knife through butter. But now COST has broken down and bounced. It has left a lot of resistance overhead too. Yet, somehow, I am drawn to it now. I think dips can be bought. I’m not sure where I would say I am wrong but I know if it can get up and over 970 that makes the chart improve a great deal.
Today’s Indicator
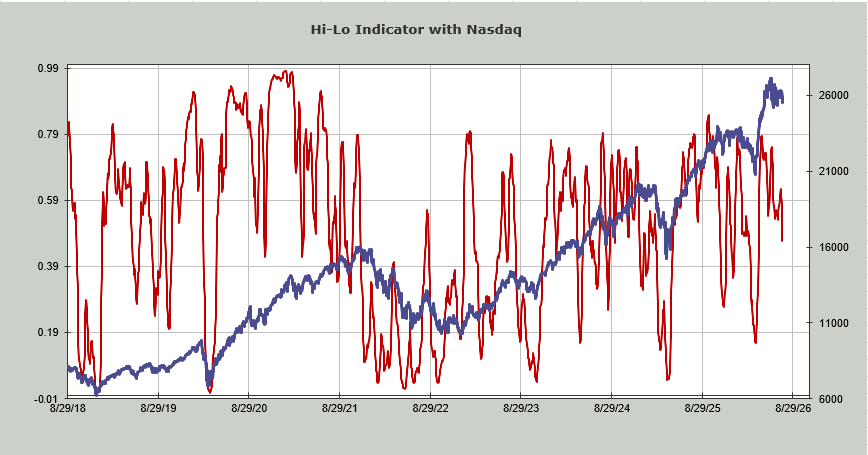
The new lows are discussed above. Nasdaq’s Hi-Lo Indicator sits at 47%. An oversold reading is far away, under 20%.
Q&A/Reader’s Feedback
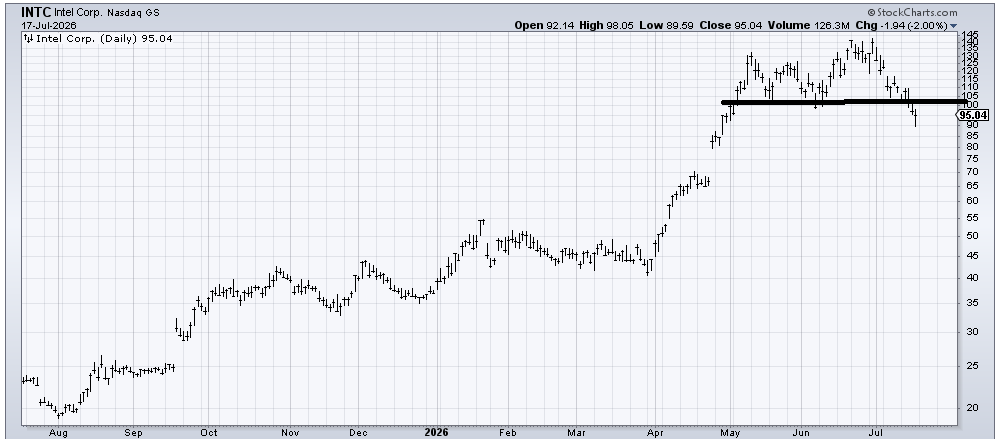
Intel (INTC) is the first semiconductor stock I flagged as having gone parabolic, back in early May. It spent the next two months building a top which it broke down from last week. I think it is a little short-term oversold. What I would like to see over the ensuing few months (yes, I said months) is for the stock to gradually make its way toward that 70 area. That would fill the gap and complete a measured target. If it can do that, I think we’d be staring at an intermediate-term oversold condition.
In the near term, a rally that cannot get over 110 would give me more confidence in the scenario I would like to see. Earnings are out this week so a reminder that I don’t like to “play” earnings, but if it hasn’t bounced before Wednesday it would be heading into earnings very oversold (short term)
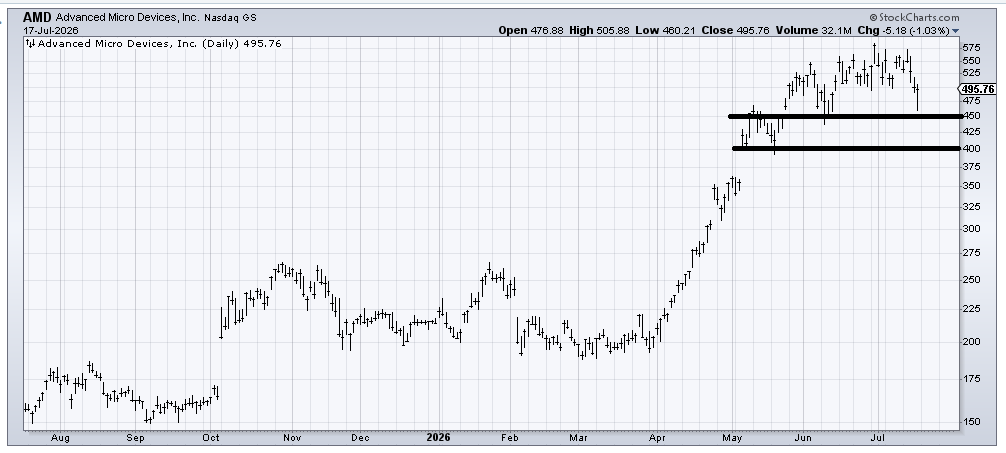
I don’t love the chart of Advanced Micro Devices (AMD) but it still hasn’t broken that early June low, let alone the May low. Right now, in the near term, I would focus on that 500 area that it broke on Friday. If it can recapture it in a hurry that would be good. If it cannot then I think it will at the very least retest 450 and possibly 400.
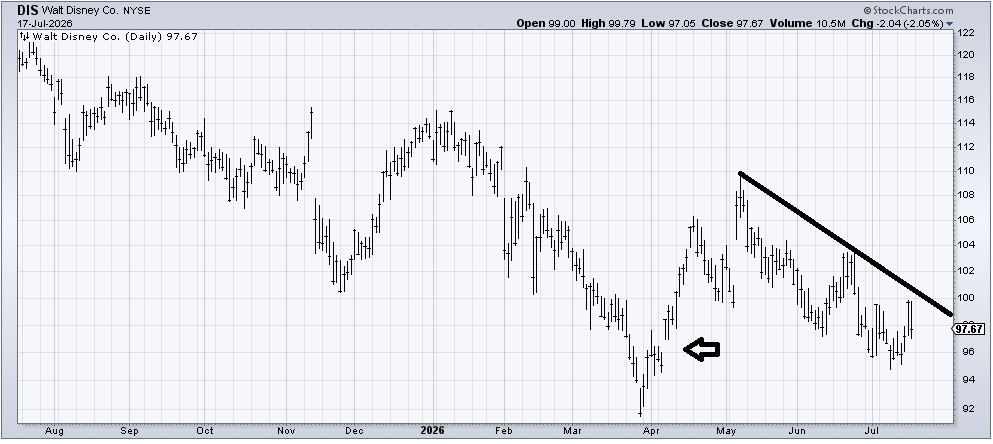
It feels as if I have tried to bottom fish Disney (DIS) a number of times, with very little success. It managed to fill the April gap so now if it can cross over that downtrend line at least we’d have something to sink our teeth into since it would at least get it up and over these twin peaks in July around 100.
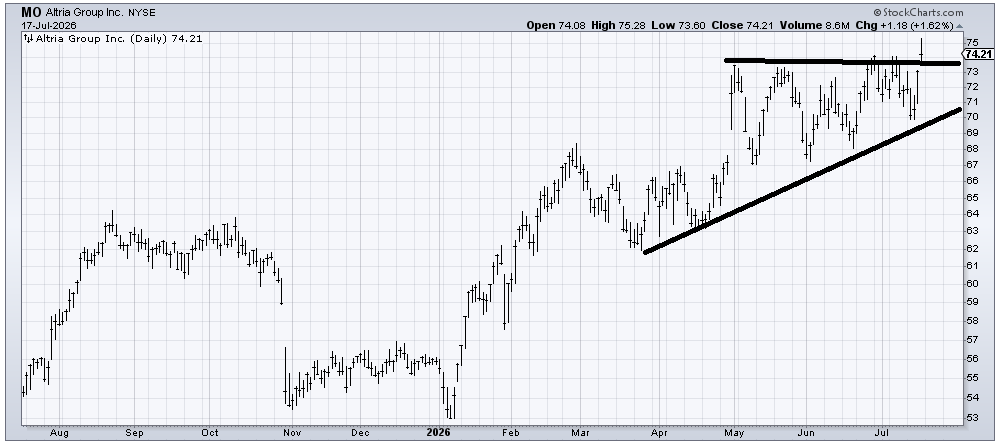
I recommended Altria (MO) about a month ago as it was coming off that low. It finally broke out on Friday but the stock closed very poorly. The chart does measure to 78-80 but if it trades back under 73 I’d have to consider this may have been a false breakout. Earnings are out soon.
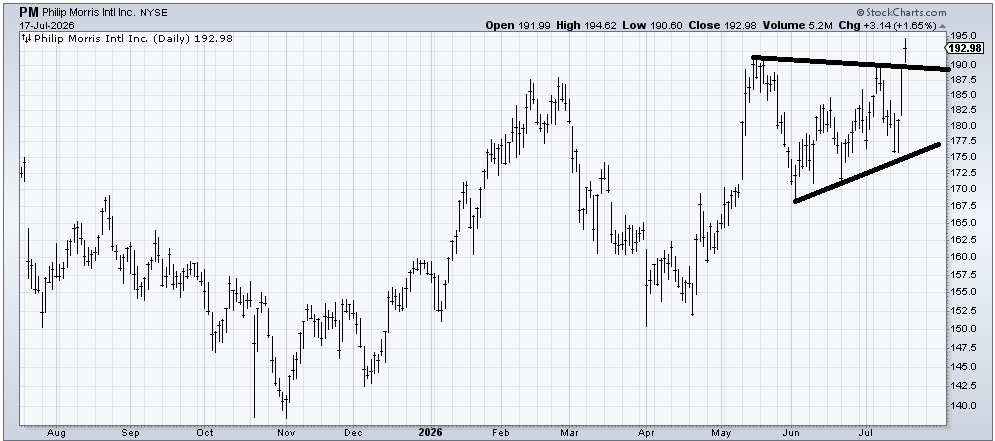
Philip Morris (PM) also had a breakout on Friday and closed a bit better than MO did. It measures into the 210 area but again, a break back under 190 and we’d consider this a false breakout. Earnings are out soon.
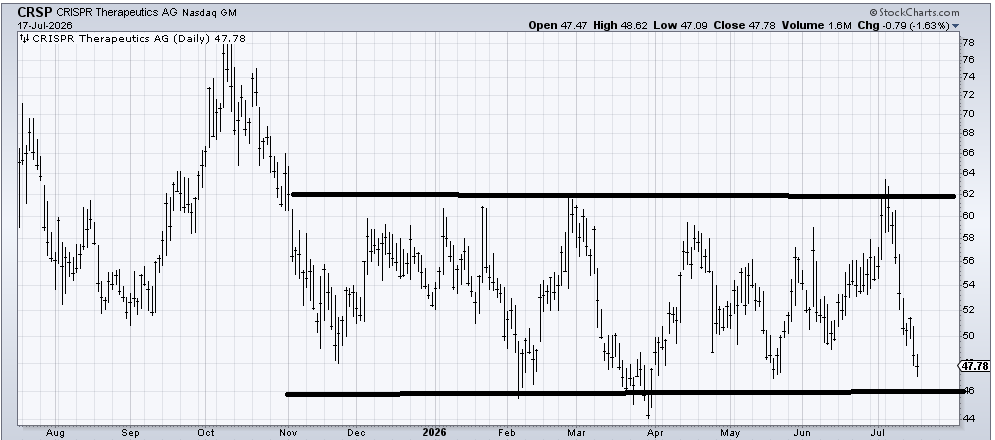
CRISPR (CRSP) has been in a giant trading range for nine months now. In the short term, it is oversold enough to bounce off this 46 to 47 area but aside from that I don’t see any signs of the stock improving. Perhaps this will be one of those stocks that continues to meander for a few months before it becomes a tax loss bounce candidate later in the year.
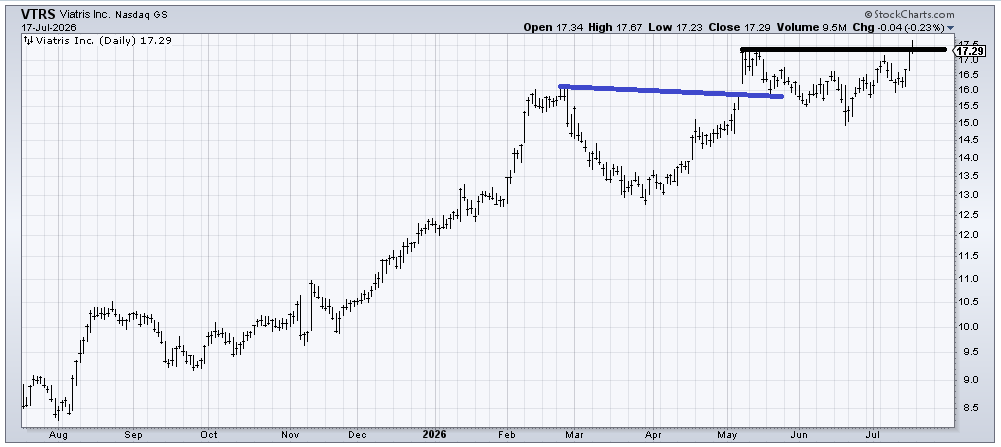
Viatris (VTRS) had this similar bowl shaped pattern in May. It gaped up and then died. If it can hold onto 17-ish then it should be OK, but it has a tendency to look like a breakout and then pullback (see November) so if you want to have more patience, then use a stop under 16.
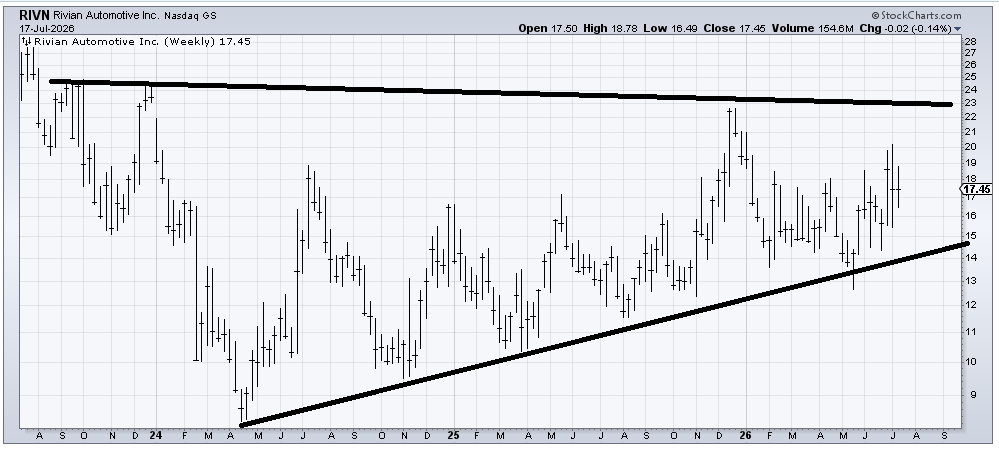
I am going to jump right to the three year weekly chart of Rivian (RIVN) since I have said for almost a year now that this is one giant base and I keep waiting for it to come to fruition. They say patience is a virtue. Mine is wearing thin! But that base is still there.
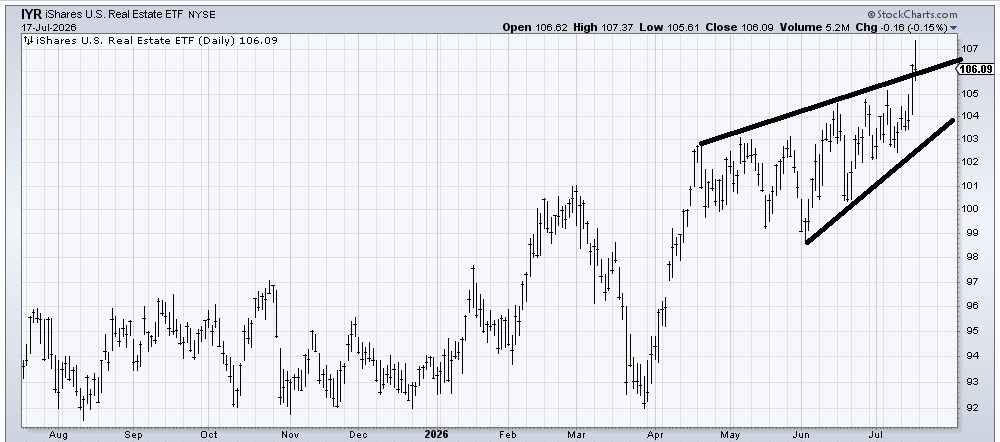
I don’t love Friday’s action in (IYR), an ETF to be long the REITs. I recommended it back in January only to get sucked in, spit out and then see it go. I would get concerned if it breaks the lower line, otherwise I think it should still get to that target in the 108 to 110 area.
Helene welcomes your questions about Top Stocks and her charting strategy and techniques. Please send an email directly to Helene with your questions. However, please remember that TheStreet.com Top Stocks is not intended to provide personalized investment advice.
