AT&T: Is an Upside Breakout Coming?
The communications giant reported a first-quarter profit beat Wednesday, but here's what the charts are telling us.
You've reached your free article limit
You've read 0 of 1 free Pro articles.
AT&T T shares are reacting after the communications giant reported a first-quarter profit beat Wednesday, as phone subscribers rise and the company affirms its 2024 outlook.
Let's check out the charts and indicators and hopefully we won't get a busy signal.
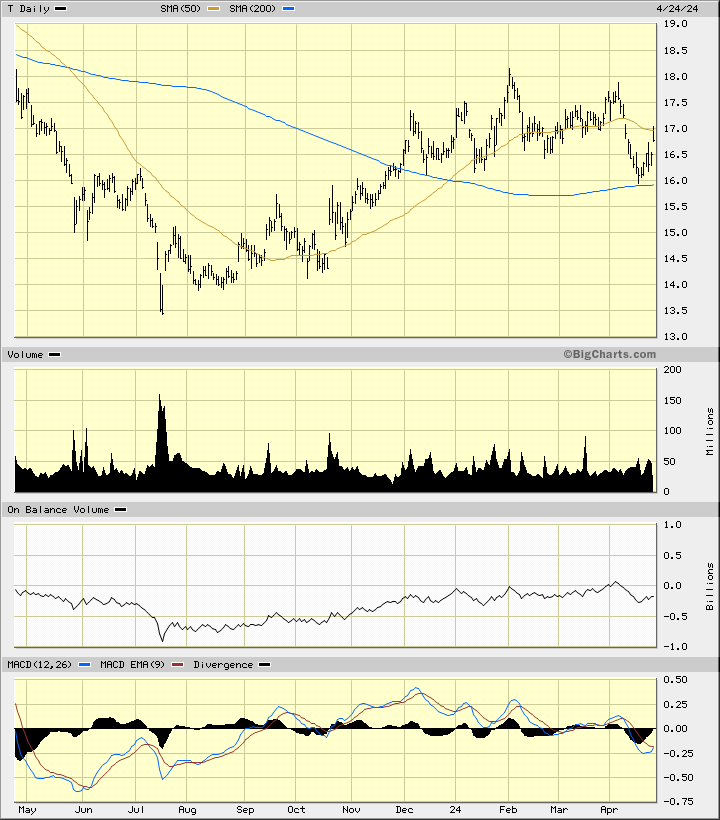
In the daily bar chart of T, below, I can see that the shares rallied to retest the underside of the declining 50-day moving average line. The slope of the 200-day moving average line is positive and prices dipped to test the line earlier this month.
Trading volume shows a slight increase since the middle of March. The On-Balance-Volume (OBV) line shows us a rising pattern since July and only some modest weakness in April. The Moving Average Convergence Divergence (MACD) oscillator is below the zero line but poised for a cover shorts buy signal.
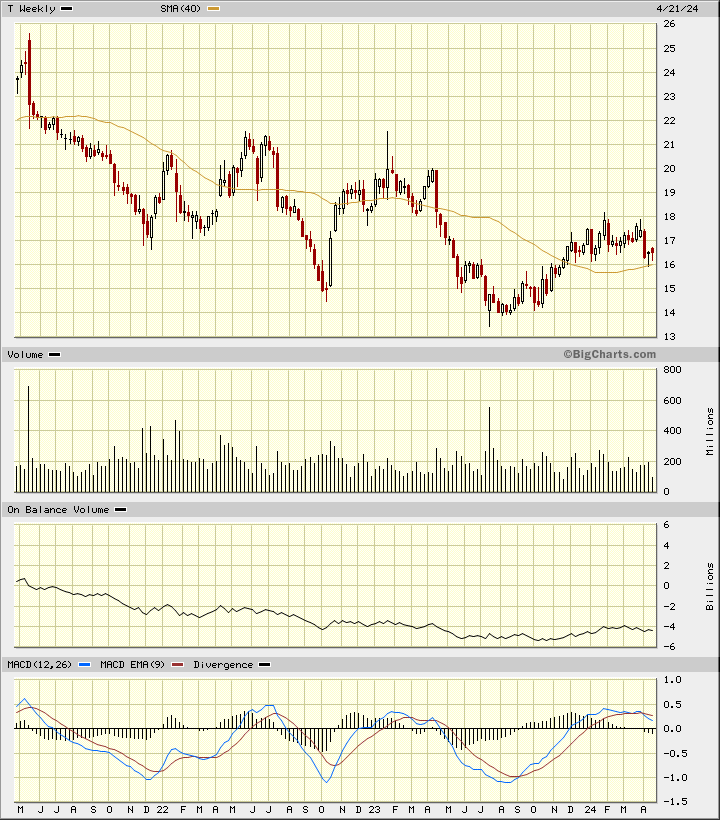
In the weekly Japanese candlestick chart of T, below, I see a longer-term downtrend playing out but some improvement. T trades above the rising 40-week moving average line. The 40-week moving average was successfully tested the other week.
The weekly OBV line turned upwards from a low in October but has weakened slightly in March and April. The MACD oscillator has been correcting but remains above the zero line.
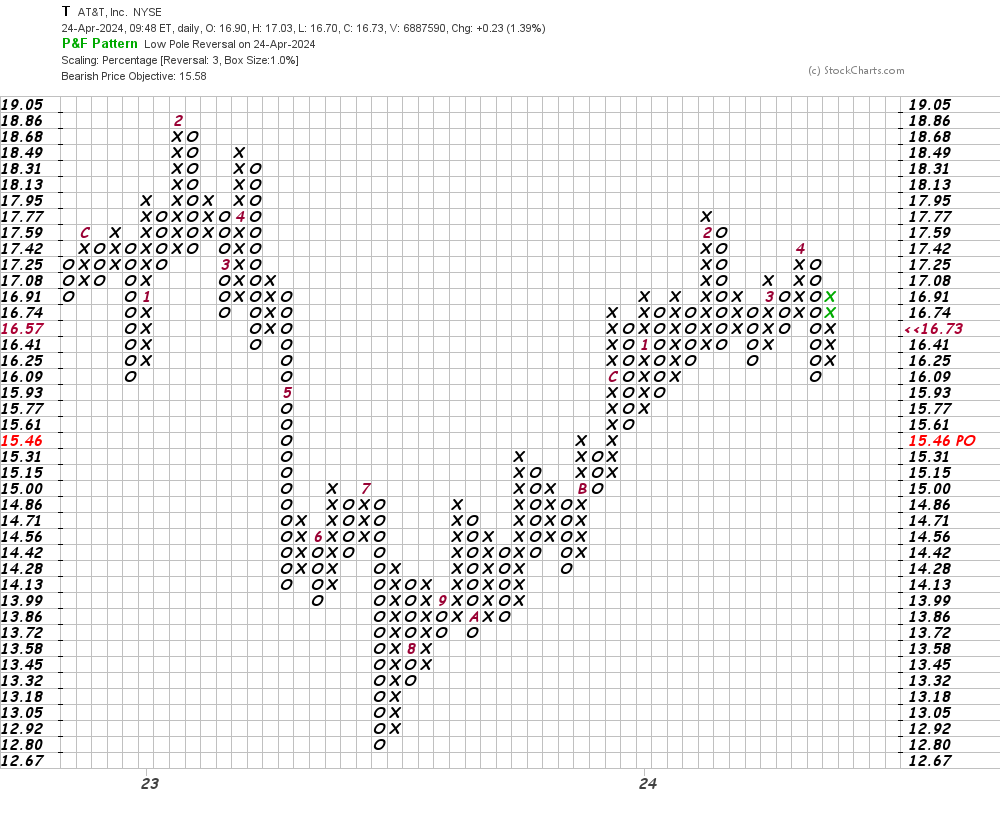
In this daily Point and Figure chart of T, below, I can see that the software is projecting a downside price target in the $15.50 area but a trade at $17.42 or higher will turn things more positive.
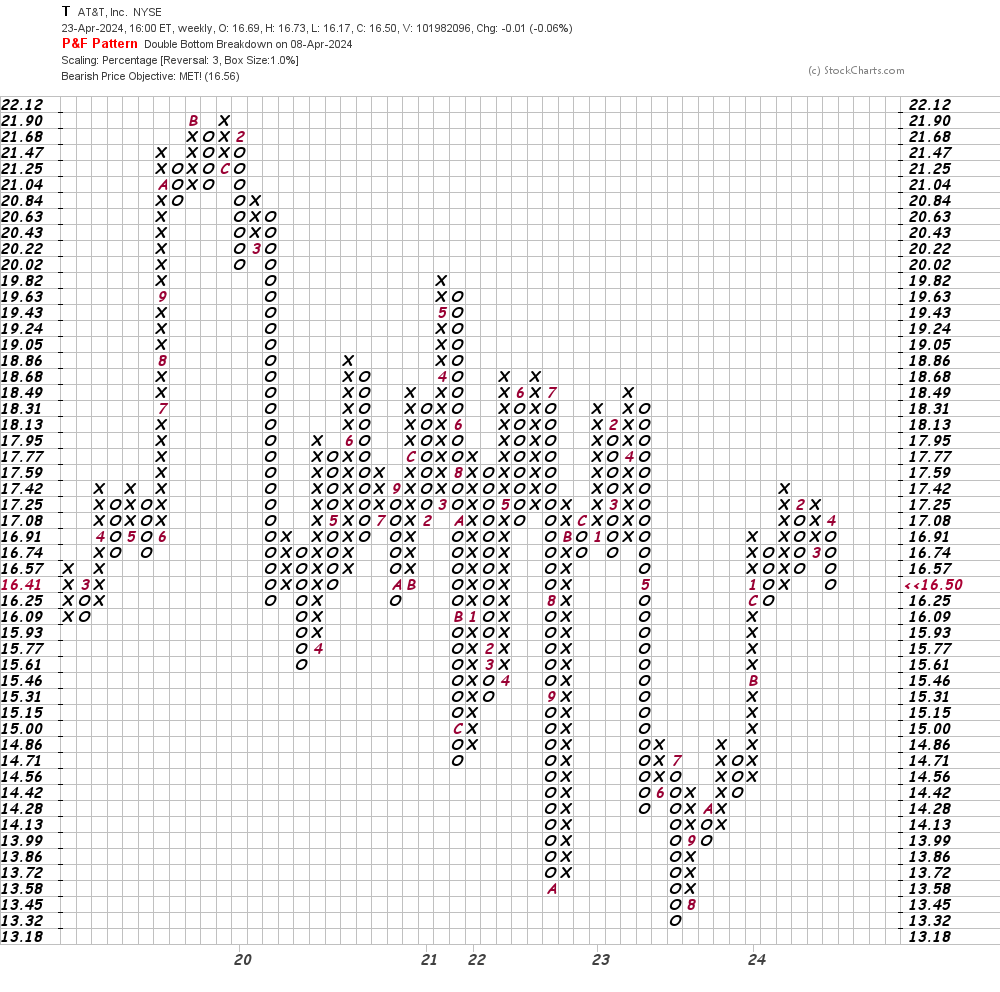
In the weekly Point and Figure chart of T, below, I see a mixed picture. The shares have reached a downside price target in the $16.50 area but my eyes are drawn to a downtrend line (not drawn) along the highs of the past four years. A close above $17.25 could break the line and may open up the upside.
Bottom-line strategy: Many sell-side analysts will point out the hefty yield that T pays out to shareholders. That's very nice but I would like to see the stock price rally. Aggressive traders could go long T at current levels risking to $15.50. Add to longs above $17.50 and above $18.00.
Employees of TheStreet are prohibited from trading individual securities.