All It Takes Is a Down Day for People to Remember That We're Overbought
Eight up days, and nobody recognized that the market was getting pricey. Let's also look at LITE, SQ, ELV, GBPUSD, and LHX.
You've reached your free article limit
You've read 0 of 1 free Pro articles.
The Market
I am always amused at what one down day will do to sentiment after a big string of up days.
Yesterday, no one was talking about the market being overbought. I even noted how my entire Twitter feed got on my case when I said it. The Twitter folks are still skeptical that we can pull back, but the folks on television? Today, they are a wee bit cautious.
Not all of them, but many of them.
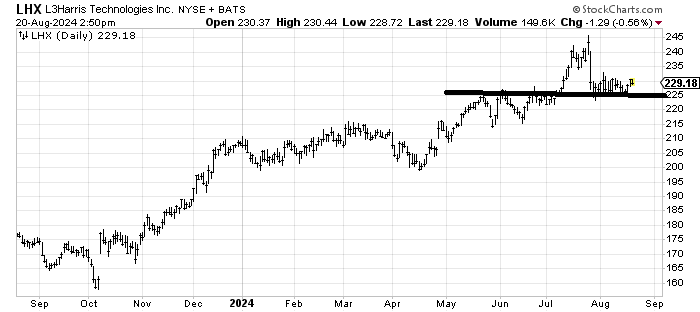
But let’s look at the statistics. Monday’s put/call ratios pretty much tell you what folks are expecting from Chair Powell later this week. The total put/call ratio was .72. Equities chimed in at .47, the lowest since the spring. The Index ratio was .88, and the ETF options players showed up with a ratio of .83. That is an awful lot of folks leaning heavily on the call side on Monday.
But what about Tuesday? I don’t have the final tally as of this writing, but the total put/call ratio came in around .82. Just two trading days ago, the ten-day moving average of the put/call ratio was 1.08. Now it is .94.
I grant you the market swings have been wild but that’s a lot of emotion for a market in a two-week period. If this call buying goes on for another day or two, this moving average is going to fall back under .90 and maybe toward .85 in a heartbeat.
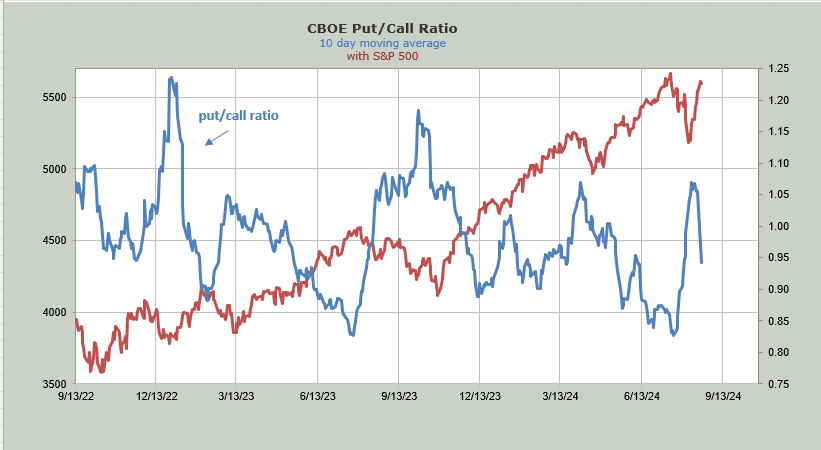
A few other items to note. The DSI for the Dollar is now 17, and today folks on television finally started talking about the buck. The Dollar is down four percent in six weeks. In currency land, that’s a lot. I would like to see sentiment get a bit more extreme but we are getting closer.
Finally, bonds are still rising (rates falling), but please notice the Utes are stalled out and were down today. I would not chase bonds here.
New Ideas
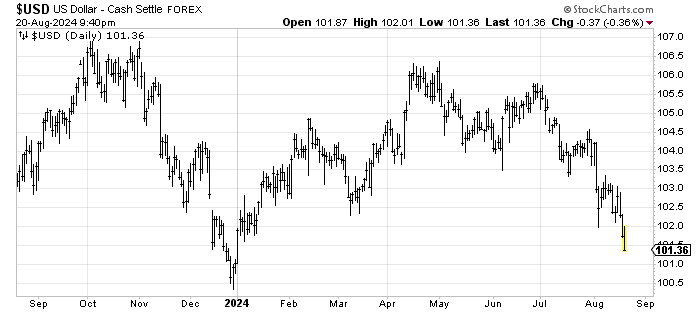
I have highlighted Lumentum’s LITE long-term chart before, and I’m going to do it again. In the near term I would not chase it. But take a step back and notice that this stock has been going sideways for almost two years now. And the volume last week was the highest since February, only this time it was to the upside. Put the stock on your radar. Perhaps the next time the market gets oversold the chart will be interesting on the daily.
Today’s Indicator
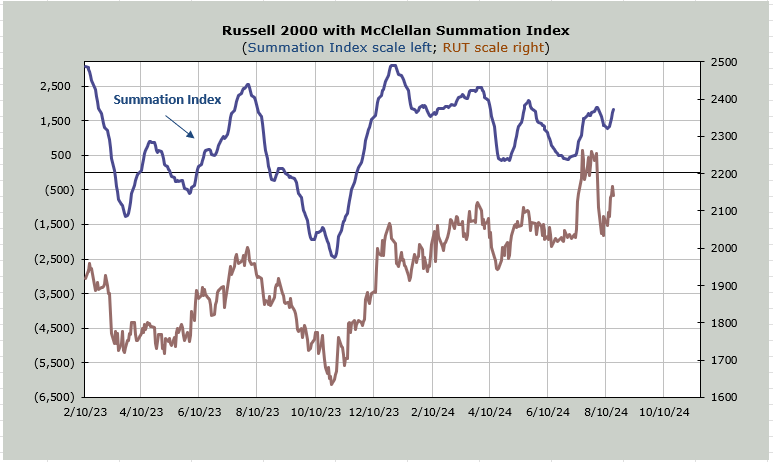
The McClellan Summation Index is heading upward.
Q&A/Reader’s Feedback
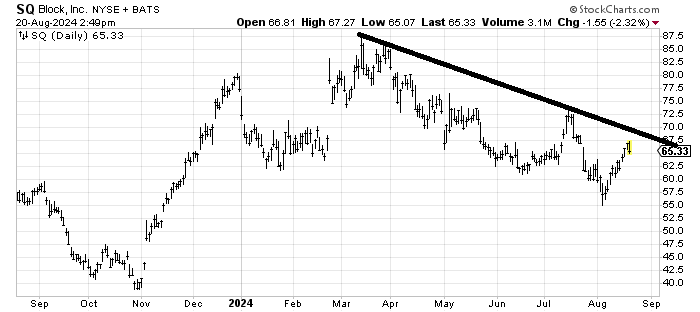
I suspect Block SQ runs into trouble at that resistance line. However should it get through and make it to 72-73 instead of stopping at 70, then I would look to buy pullbacks to the line. Otherwise I think it stops at resistance.
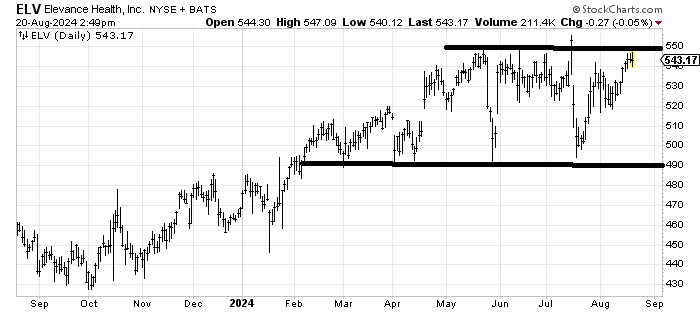
I always struggle with charts like Elevance Health ELV because it has been up here so many times and hasn’t been able to break out. I’m not even sure that getting over 550 helps it but at least that would be helpful. Mostly, I see it in a trading range.
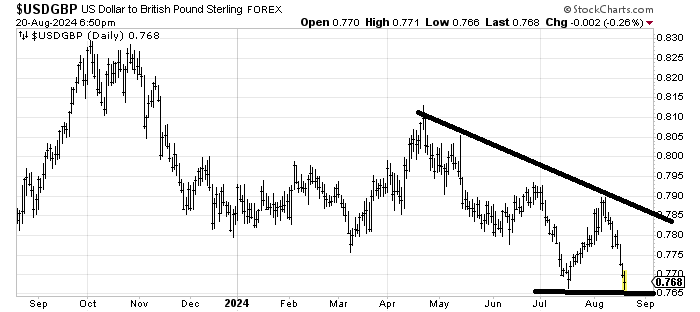
I would love to tell you that the USDGBP looks oversold here AND that the DSI is enough for me to trust a bounce. But all I see now is an oversold chart, so I’m not inclined to trust a bounce just yet. But I do think it bounces.
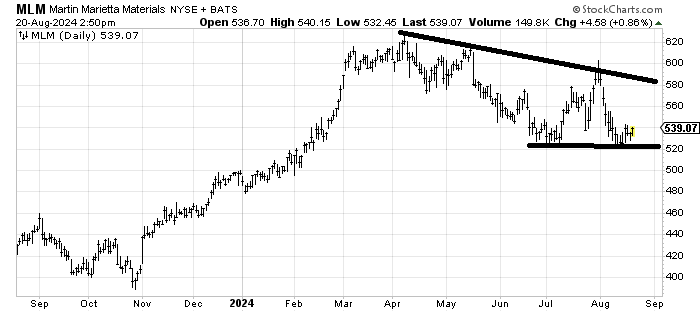
Martin Marietta MLM has one of my favorite patterns: a W. The stop is clear at 520, so the risk/reward is good.
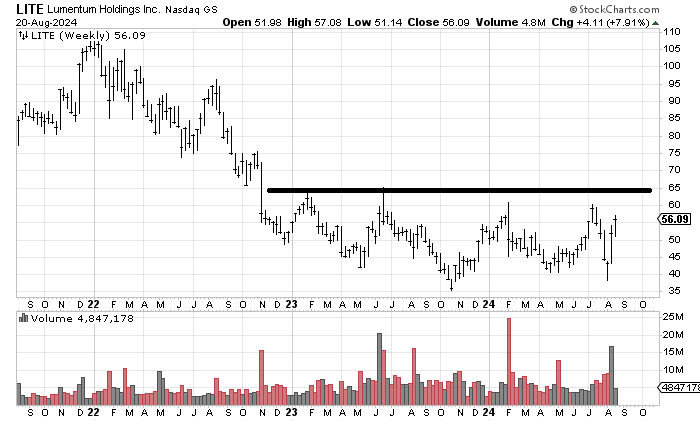
L3Harris LHX doesn’t have the same W pattern as MLM does, but there is decent support back at 225. I would love to see it dip back there, or close to it, so it can have a bit better risk/reward, but I’d lean toward liking this chart.