Live Quarterly Meeting Transcript: Helene Meisler Offers Investment Ideas to Watch
TheStreet Pro's Helene Meisler offered her view on the intermediate term for the market, sentiment and top things to watch.
You've reached your free article limit
You've read 0 of 1 free Pro articles.
TheStreet Pro recently hosted our Live Quarterly Meeting around the theme of a "Summer Investing Road Trip."
It was a chance for our subscribers to hear firsthand markets insight from some our leading contributors at a critical point in the calendar. Below is a transcript of comments from Helene Meisler, a world-renowned market technician and equity trader, who shared insight into intermediate-term indicators, market sentiment and investment groups to watch.
Read All the Live Quarterly Meeting Transcripts
- Peter Tchir on Geopolitical Risks, Inflation, and Rates
- Maleeha Bengali on Interest Rates, Crude Oil and Bitcoin
- Chris Versace Shares 3 Picks From the Portfolio
Intermediate Term Indicators
But in terms of the markets, let's just start with the charts. If you guys want to start with my intermediate term indicators. There we go. Those who read me regularly will know that I've been talking about "the others" rallying since probably the middle of June because that was just before I left on my vacation.
And we've gotten "the others," the small-caps, the 493, whatever you want to call it. And now I've been discussing that I think the intermediate term that got oversold there-- as you can see right there at the end of June-- will reach an overbought condition somewhere, I'm pegging somewhere towards the end of the month.
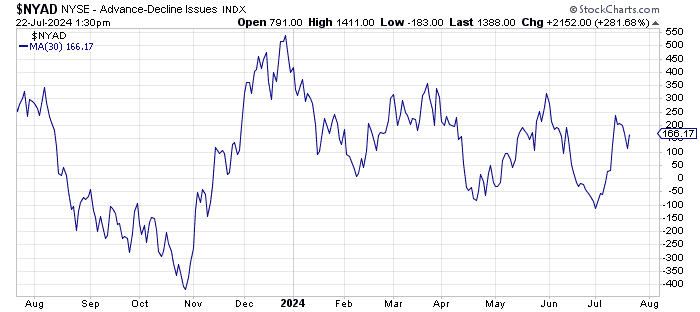
It's been looking like somewhere, I don't know, let's just call it late July, early August. I'm going to couch it. By that I mean, I expect this indicator will get up there, probably into the, call it 350, 400 area, which you see on the right-hand side of the chart. And then, my guess is it'll peak somewhere around there.
And if we move to the next chart, which you see me talk about quite frequently. The Volume Indicator. This also got quite oversold down there at 46% at the end of June. And it is currently sitting, just middle-of-the-road, around 50% or 52%. Now it gets overbought when we get to somewhere in the mid-50s to 60. Mid- to upper-50s is usually what I call it.
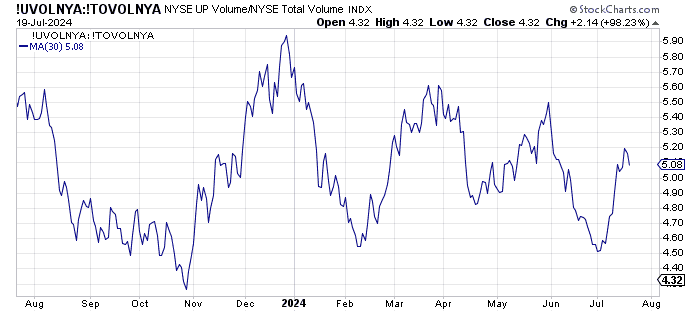
My sense is that it should get to 55-ish by about this time next week. But I'll be honest with you, considering the move in the small-caps, and the move that we've had in, quote, unquote, "the 493," I expected this to be higher. Like today, net volume on the New York Stock Exchange is kind of flat, which is a little surprising considering, you know, the Russell is up another 1%. So, I'll have to see what's happening there.
However, that is my expectation. I often say, based on the math, and that's what it is. But I just see that the market can get back up there and not get overbought until about a week, a week and a half, two weeks from now.
Sentiment
And then, I want to move on to sentiment, because I base a lot of my work on sentiment. And right now, usually the market moves all together. But what we've had since May, first we had all the index movers ratcheting up while everything else either just laid there or went down. So it's, first of all, quite unusual to have sentiment so bullish when the indexes are still flat on their backs like the Russell was.
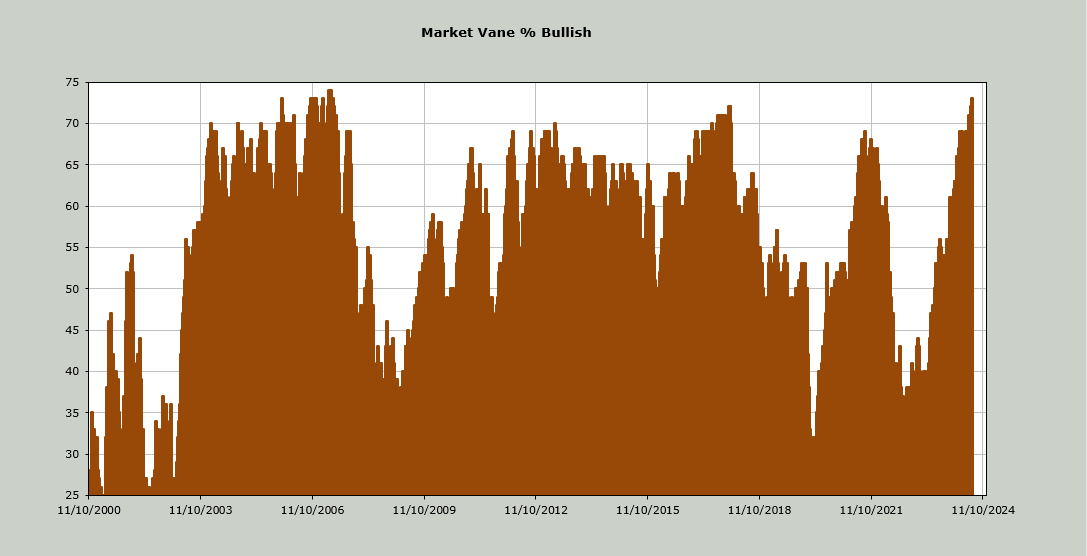
But in any case, we now have the Market Vane. And I don't use this very often because, as you can see, it doesn't get extreme very often. But Market Vane Bulls are now at 73%. This comes out weekly. The last time it got anywhere up in this area was the spring of 2007. So, it's a rare event for it to get up here. Can we get more stretched over the next few weeks? Heck, yeah. Why not? I mean, I've never really seen it get to 80% and I've been tracking this for about 30 years or so.
But, why not? I mean, I guess it could. But no matter how you slice or dice it, this doesn't scream, "brand new up leg" without a correction first. At least, that's how I interpret it. And then if we move to the next chart in terms of sentiment, this is the Equity Put/Call Ratio. I used to write about this quite frequently, but I haven't because it's kind of been doing absolutely nothing. But I have been tracking this for 20 years, as you can see. And we generally stay in this range.
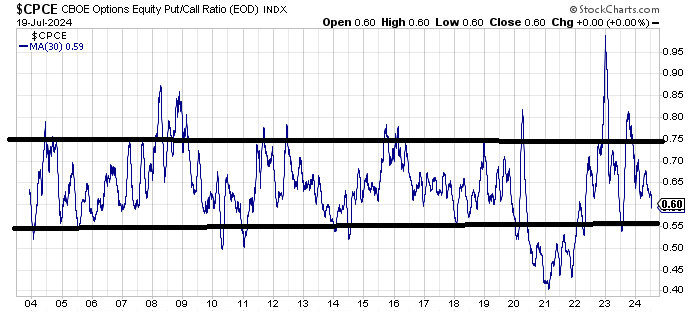
I mean, those two black lines are pretty much where we rarely get out of. You can see going all the way back to 2008, there's your '08 and '09 lows. And you can see how extreme we got on the upside there, meaning people were too bearish. And then, even if you take a look at-- I'm not going to go through it all, but in 2010, that low down there came just before the flash crash. And then in 2011, that was the European bank crisis and so forth and so on.
Anyway, we don't generally get out of the range very often. If you take a look at the period from 2020 to the present, we have gotten a lot more extreme than we have in the past. Just before the COVID decline in March of 2020, we did slip below there, under that 55 area. And then you can see the decline in COVID came and we got right up to 80.
And then we had that whole period of time where we had the "options mania," is what I'll call it, in 2020 and 2021, which is when we spent all that time below 55. In any event, I expect that this is going to tag that 55 area, maybe lower, but I think it's only going to get to that 55-ish area sometime in the next two weeks.
And generally speaking, that has led to a correction in the market. And the last time we had a reading like that, we were back in July of 2023, and we know that the market corrected 10% in the summer and into the fall.
Ideas: What to Watch
All right. Let's move to the next chart. So that brings us to what groups we should be watching. Well, I'm always a fan of watching the semiconductors and the banks. I think they're both very important groups. The SOX hasn't done anything. Now, basically, it's trading where it was back in late May, surprisingly.
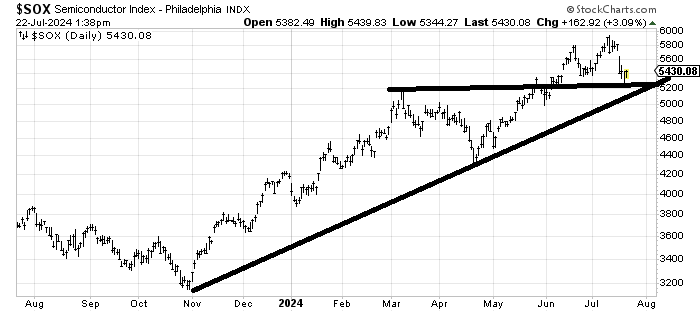
But I do see support. I'm going to call it that 5,000-ish area from that uptrend line. It's not a great uptrend line. And obviously 5,200 will be bounced off of. One thing to note is that the SOX has made a marginal lower low versus the June low. And that's the same thing that happened in April. Can you see? You see that point in April, right when we had the lows. And we bounced and we came down to a higher low.
I'm going to watch. The SOX is currently enjoying a rally or somewhat of a rally now. I would like, only because this is always my preference, those support lines to break sometime in August. I think that would change sentiment. I think it would get, if you will, those Market Vane Bulls would probably go right back to 60% pretty quickly. I think that equity put-call ratio would spurt higher and get off that 55 level. And I think sentiment does need to change. So, I'm looking for things that could change and I think if you broke a line like that on the SOX, people would get a little concerned.
Now, if we move on to the Bank Index. If you've been reading me, you know that I've been bullish on the banks for a while. But in the last week I have said, well, I said this months ago, but in the last week I've highlighted the fact that I think the Bank Index, which is very different than the KBE and the KRE, so I don't want to get into the semantics of it, or certainly the XLF, they don't only have banks in them.
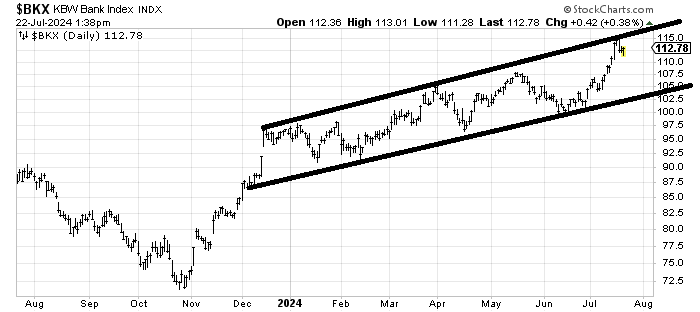
Anyway, I've been tracking the Bank Index since the early 90s. And I have a measured target around 115, which happened to be the high late last week. It's not written in stone and usually I say you got to couch it a little bit. There's a lot of resistance from about two years ago on the Bank Index at 115.
And then we've got this channel line that we've been riding all year. I think, sure, it's possible we break out to the upside, but I don't think so. I think any rally in the Bank Index from here forward is probably going to get stopped at that line. Banks have become very much loved, maybe even a little over-loved. Not maybe not quite over-loved yet, but I think we're heading in that direction. I don't know that I would say the banks are done. But I'm inclined to think that the banks should have quite a correction into the fall, should they stop up there at that 115 area.
And finally, we may as well talk about the small-caps. This is a weekly chart of the IWM, which everyone is all hot and bothered about. I would do just a little bit of the math, and this is the same way I got my target on the Bank Index. I take the high of the pattern. In this case, it's 195. I subtract the low of the pattern, 160. You get 35. Someone should check my math, but that comes out to 230. And look at that. 230 is the high from November 2021.
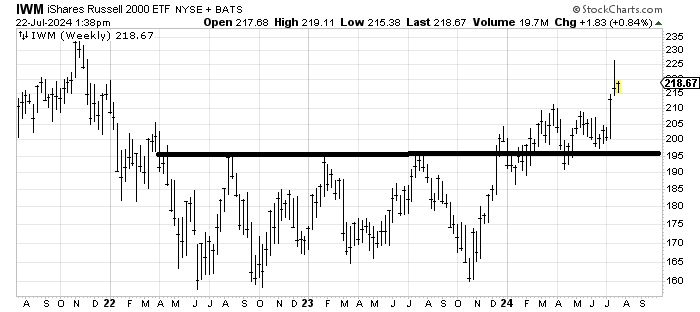
I'm going to actually couch the 230 to 240 because if I move that line that you see up a little bit to 200, 205, maybe you add another 10 points or something like that. But again, that's going to be a measured target. They're not written in stone. They're not perfect. But if you consider that the IWM maybe gets up into that general target area, the Bank Index gets into that general target area. At the same time, we've got sentiment getting incredibly stretched. At the same time, I expect we'll be intermediate term overbought. I'm looking for August to be a pullback month. And that's it.
