Who the Heck Is Inseego? We’re Buying the Small-Cap 5G Firm
We’re taking a closer look at the defense contractor following a recent peak.
You've reached your free article limit
You've read 0 of 1 free Pro articles.

Ever hear of Inseego Corp (INSG)? Probably not.
Shares of the small-cap provider of 5G mobile broadband and fixed wireless access as well as IoT solutions have been hit hard after peaking in early May. The firm is a defense contractor, which is why it’s on my radar. It was then that the firm reported a tough quarter, posting a Q1 adjusted EPS of $0.06 on revenue of $34.34 million. The sales print fell short of expectations.
The firm highlighted some shorter-term headwinds such as delays in new product launches and increased inventories. Revenue guidance for the second quarter landed at $36.5 million to $43.5 million, which Wall Street found disappointing. When the firm reports in early August, consensus view is for an adjusted EPS of -$0.12 on revenue of roughly $39.9 million. That would be down small from the year-ago period.
Not All Is Lost
For the current year, Wall Street still sees revenue growth of 13.5% and of 14.4% for 2027. Q3 is expected to show a profit and accelerate the firm’s sales. Wall Street sees a full year adjusted EPS of $0.29 despite starting off the year with one (expected to be two) lousy quarters. Full year 2027 adjusted EPS is projected at $0.64.
The balance sheet is in much better shape than it had been after retiring the preferred stock earlier this year. While the long-term debt load still stands at $50.4 million, this is down significantly from more than $166 million as recently as late 2022 as the firm has made great strides towards strengthening the balance sheet. There is no short-term debt on the books as the cash position stands at roughly $19.3 million.
In my opinion, the precipitous drop in price was more about profit taking after a parabolic move and weak quarterly guidance. There has not been a fundamental deterioration in the business, and the balance sheet has improved.
The Chart
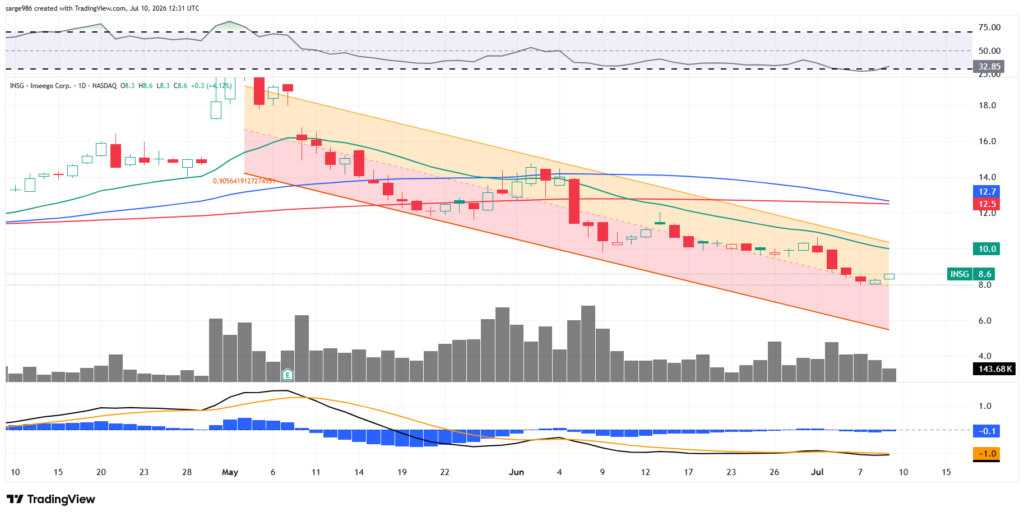
There is no technical setup evident here. All I have to go on is a feeling that the selling pressure has been overdone and that this may be an entry point that presents more potential for reward than risk. Relative strength has crawled out of a technically oversold condition while the daily MACD is showing signs of moving towards a more bullish posture.
About Rackspace
On Thursday, I laid out the case for the portfolio to make its exit from its (RXT) long position. I wrote, “Sarge says… ‘sold,’ while we’re not really in the red on this one.”
In my intentions for the day, I added, “Sell 35 shares of RXT at or close to the last sale of $6.41.”
Well, the shares were trading at $6.41 in the pre-opening session, off a last sale of $6.45, when I wrote that and that is where I would have sold them if I were not also writing for the public.
Hence, readers will see below that I was not able to make an intelligent sale in RXT on Thursday, as by the time that article hit publication, the stock was trading with a $4 handle. At that price, I have to think that the damage is priced in and I might as well hang onto the shares and see if I can at some point, make a better sale than that. I still have no interest in being long the name, but I also have no interest in making this sale. The target price is cancelled as the portfolio bides its time.
Additionally…
On Thursday, analyst Kevin McVeigh of UBS reiterated his “hold” rating on RXT along with his $5.70 target price. McVeigh is rated at three stars out of five by TipRanks. Over the past two years, he has had a 50% success rate but has only generated an average return of 8.3%.
Thursday’s Intention vs Thursday’s Actual Trade
Intention: Sell 35 shares of RXT at or close to the last sale of $6.41
Actual trade: Nothing done
Friday’s Intentions
Purchase 20 shares of (INSG) at or close to the last sale of $8.77. Initial target price: $11.
Current Positions
Long 150 shares of (ALTO) at $5.51. Target price: $8. Last sale: $5.66.
Long 70 shares of (EVLV) at $5.8746. Target price: $8.50. Last sale: $6.04.
Long 200 shares of (OCUL) at $8.271. Target price: $11. Last sale: $10.51.
Short one OCUL $11 September 18 call at $1.65. Last sale: $1.75.
Short one OCUL $9 July 17 call at $0.90. Last sale: $1.40.
Long 250 shares of (ONDS) at $8.976. Target price: $14. Last sale: $7.72.
Long 20 shares of (PL) at $27.8225. Target price: $46. Last sale: $27.31.
Long 35 shares of RXT at $6.4529. No target price. Last sale: $4.37.
Long 145 shares of (SOFI) at $15.9559. Target price: $24. Last sale: $18.85.
Short one SOFI August 21 $20 call at $1.02. Last sale: $1.17.
Long 30 shares of (SWBI) at $15.74. Target price: $19. Last sale: $15.82.
Long 60 shares of (VELO) at $13.6343. Target price: $18. Last sale: $14.69.
Cash: $1,314.16.
Portfolio Value: $10,959.83, +9.6% from inception on March 24.
At the time of publication, Guilfoyle was long ALTO, EVLV, OCUL, ONDS, PL, RXT, SOFI, SWBI and VELO.
