A Simple Trading Strategy for the Dow Jones Industrial Average and the S&P 500
From a long-term perspective, the pullback in stocks is an opportunity.
You've reached your free article limit
You've read 0 of 1 free Pro articles.
Investors and traders are getting a three-day break from the markets, and the timing couldn’t be better.
Some traders are exhausted by the whiplash rallies, air pocket plunges, and soaring volatility of the past few weeks. Others are reveling in those exact same moves, squeezing outsized gains out of an abnormally volatile market.
Now that the market has paused, it’s time to back up, zoom out, and look at the charts to find our next trading opportunity.
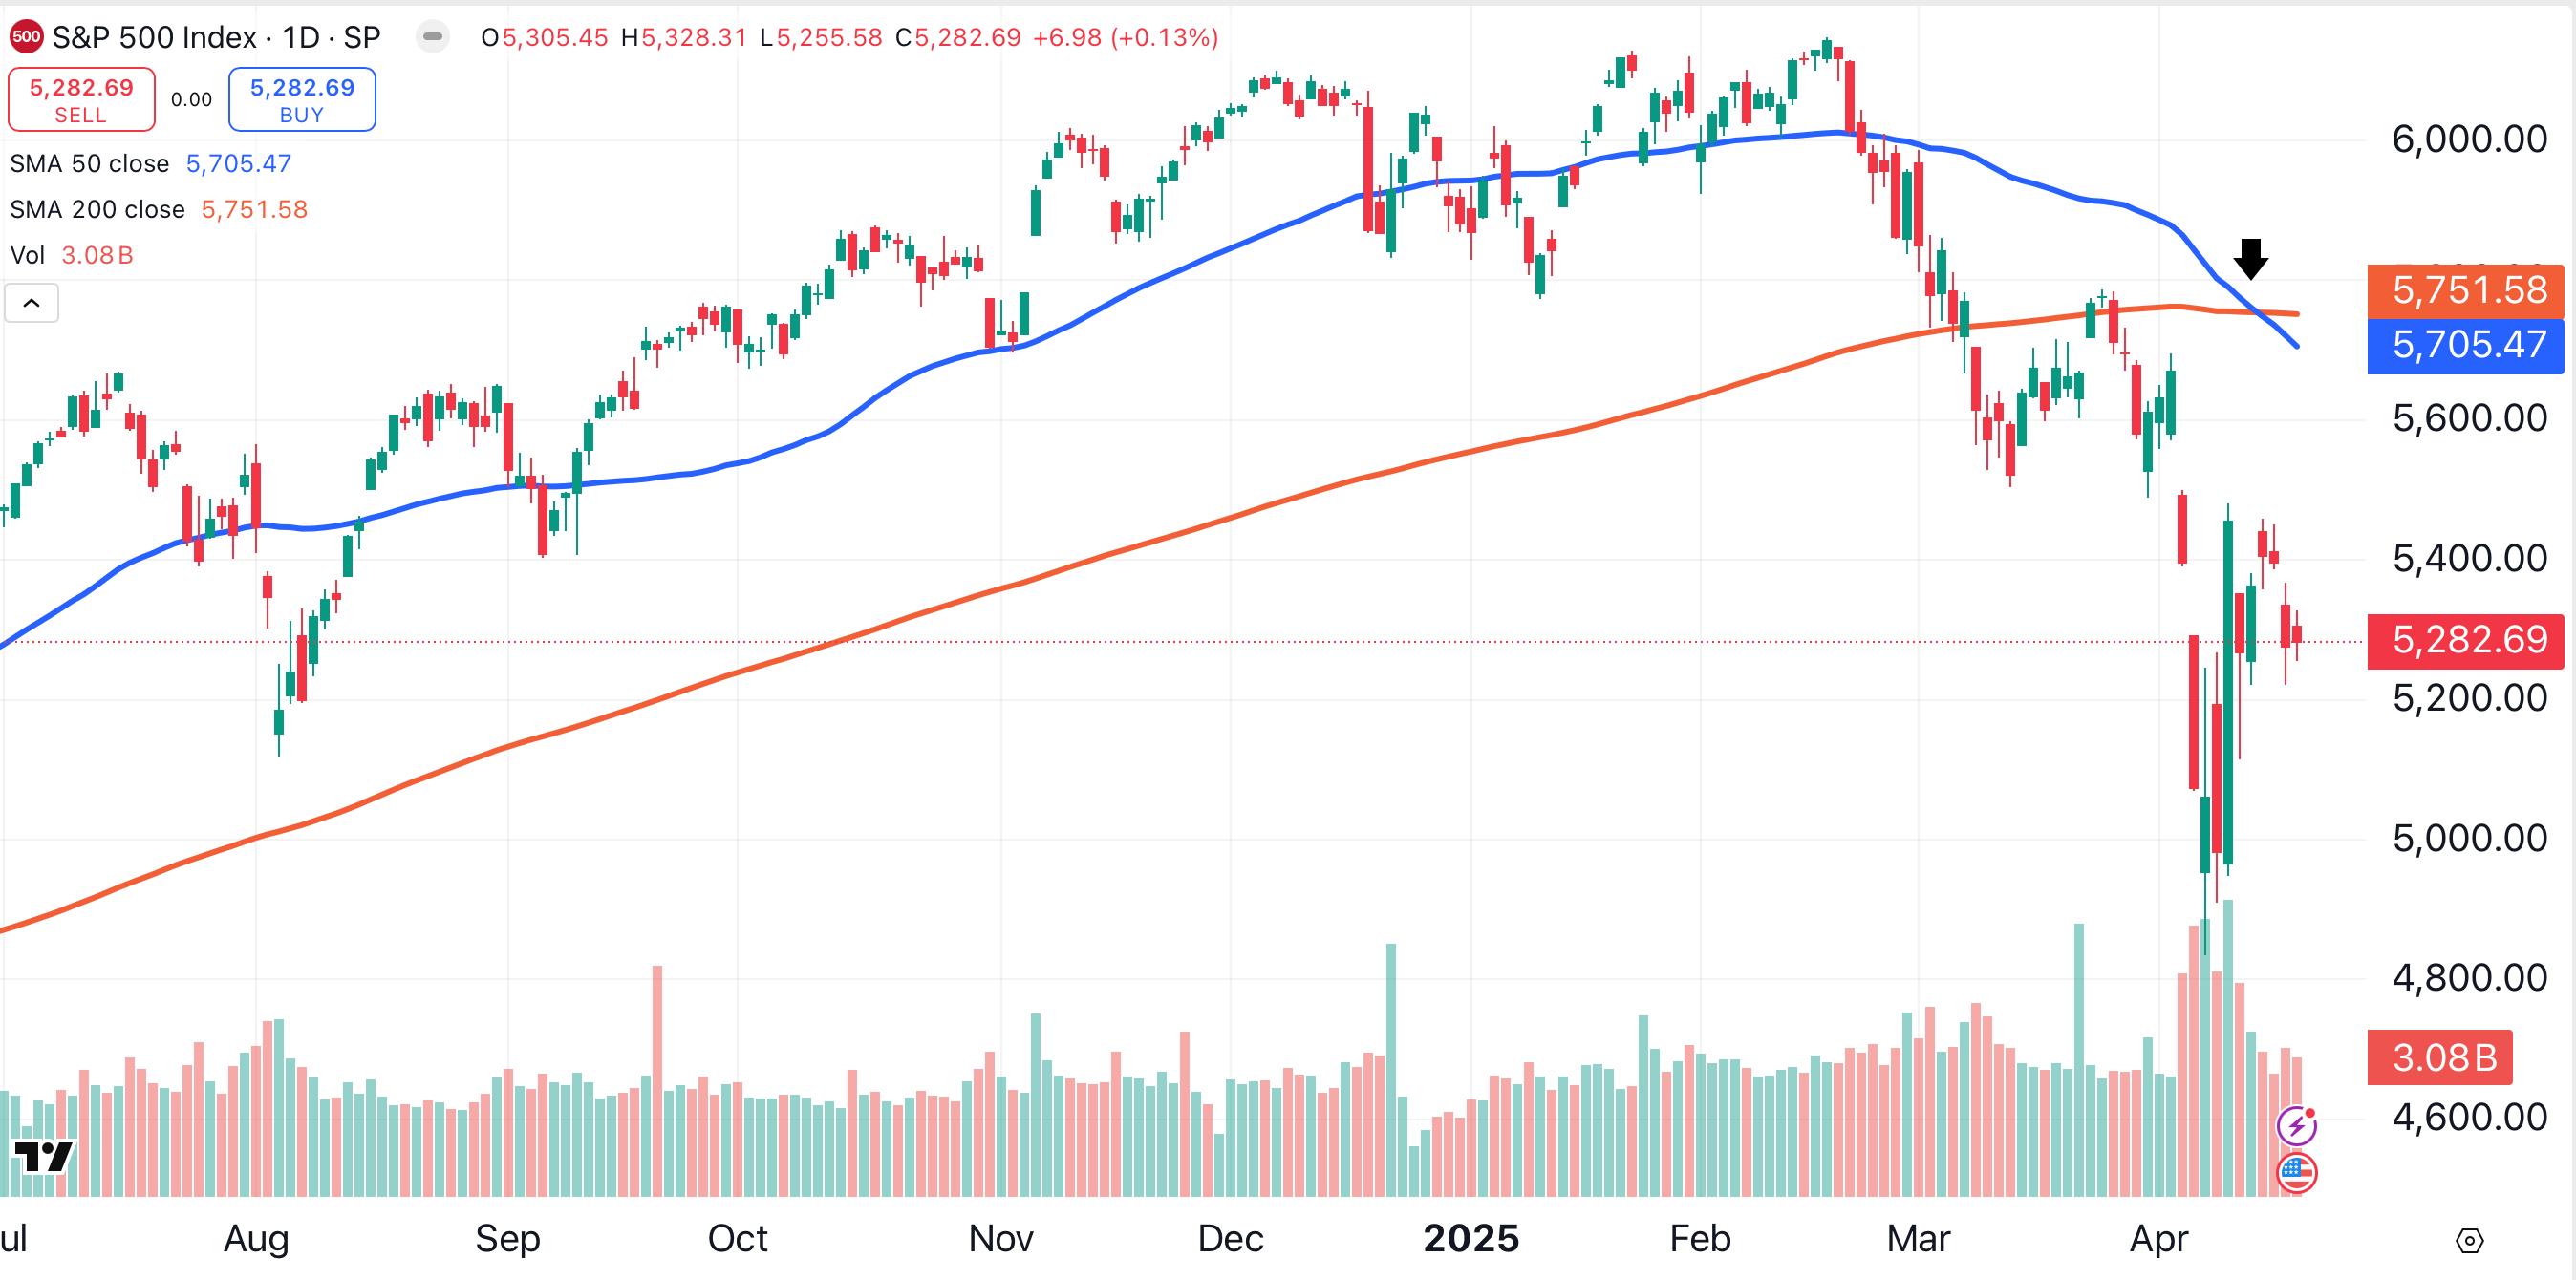
The S&P 500 is the most important index in the U.S. stock market, and its daily chart is a mess. The death cross (explained here) is obvious, but of greater concern is the amount of time the large-cap index has spent below its 200-day moving average (red). That moving average could prove to be a major obstacle to any rally.
Now let’s zoom out to the weekly chart. In this timeframe, the S&P 500’s pullback appears less ominous. This simple chart depicts the S&P 500 bouncing sharply from a 61.8% Fibonacci retracement of the October 2023-February 2025 rally.
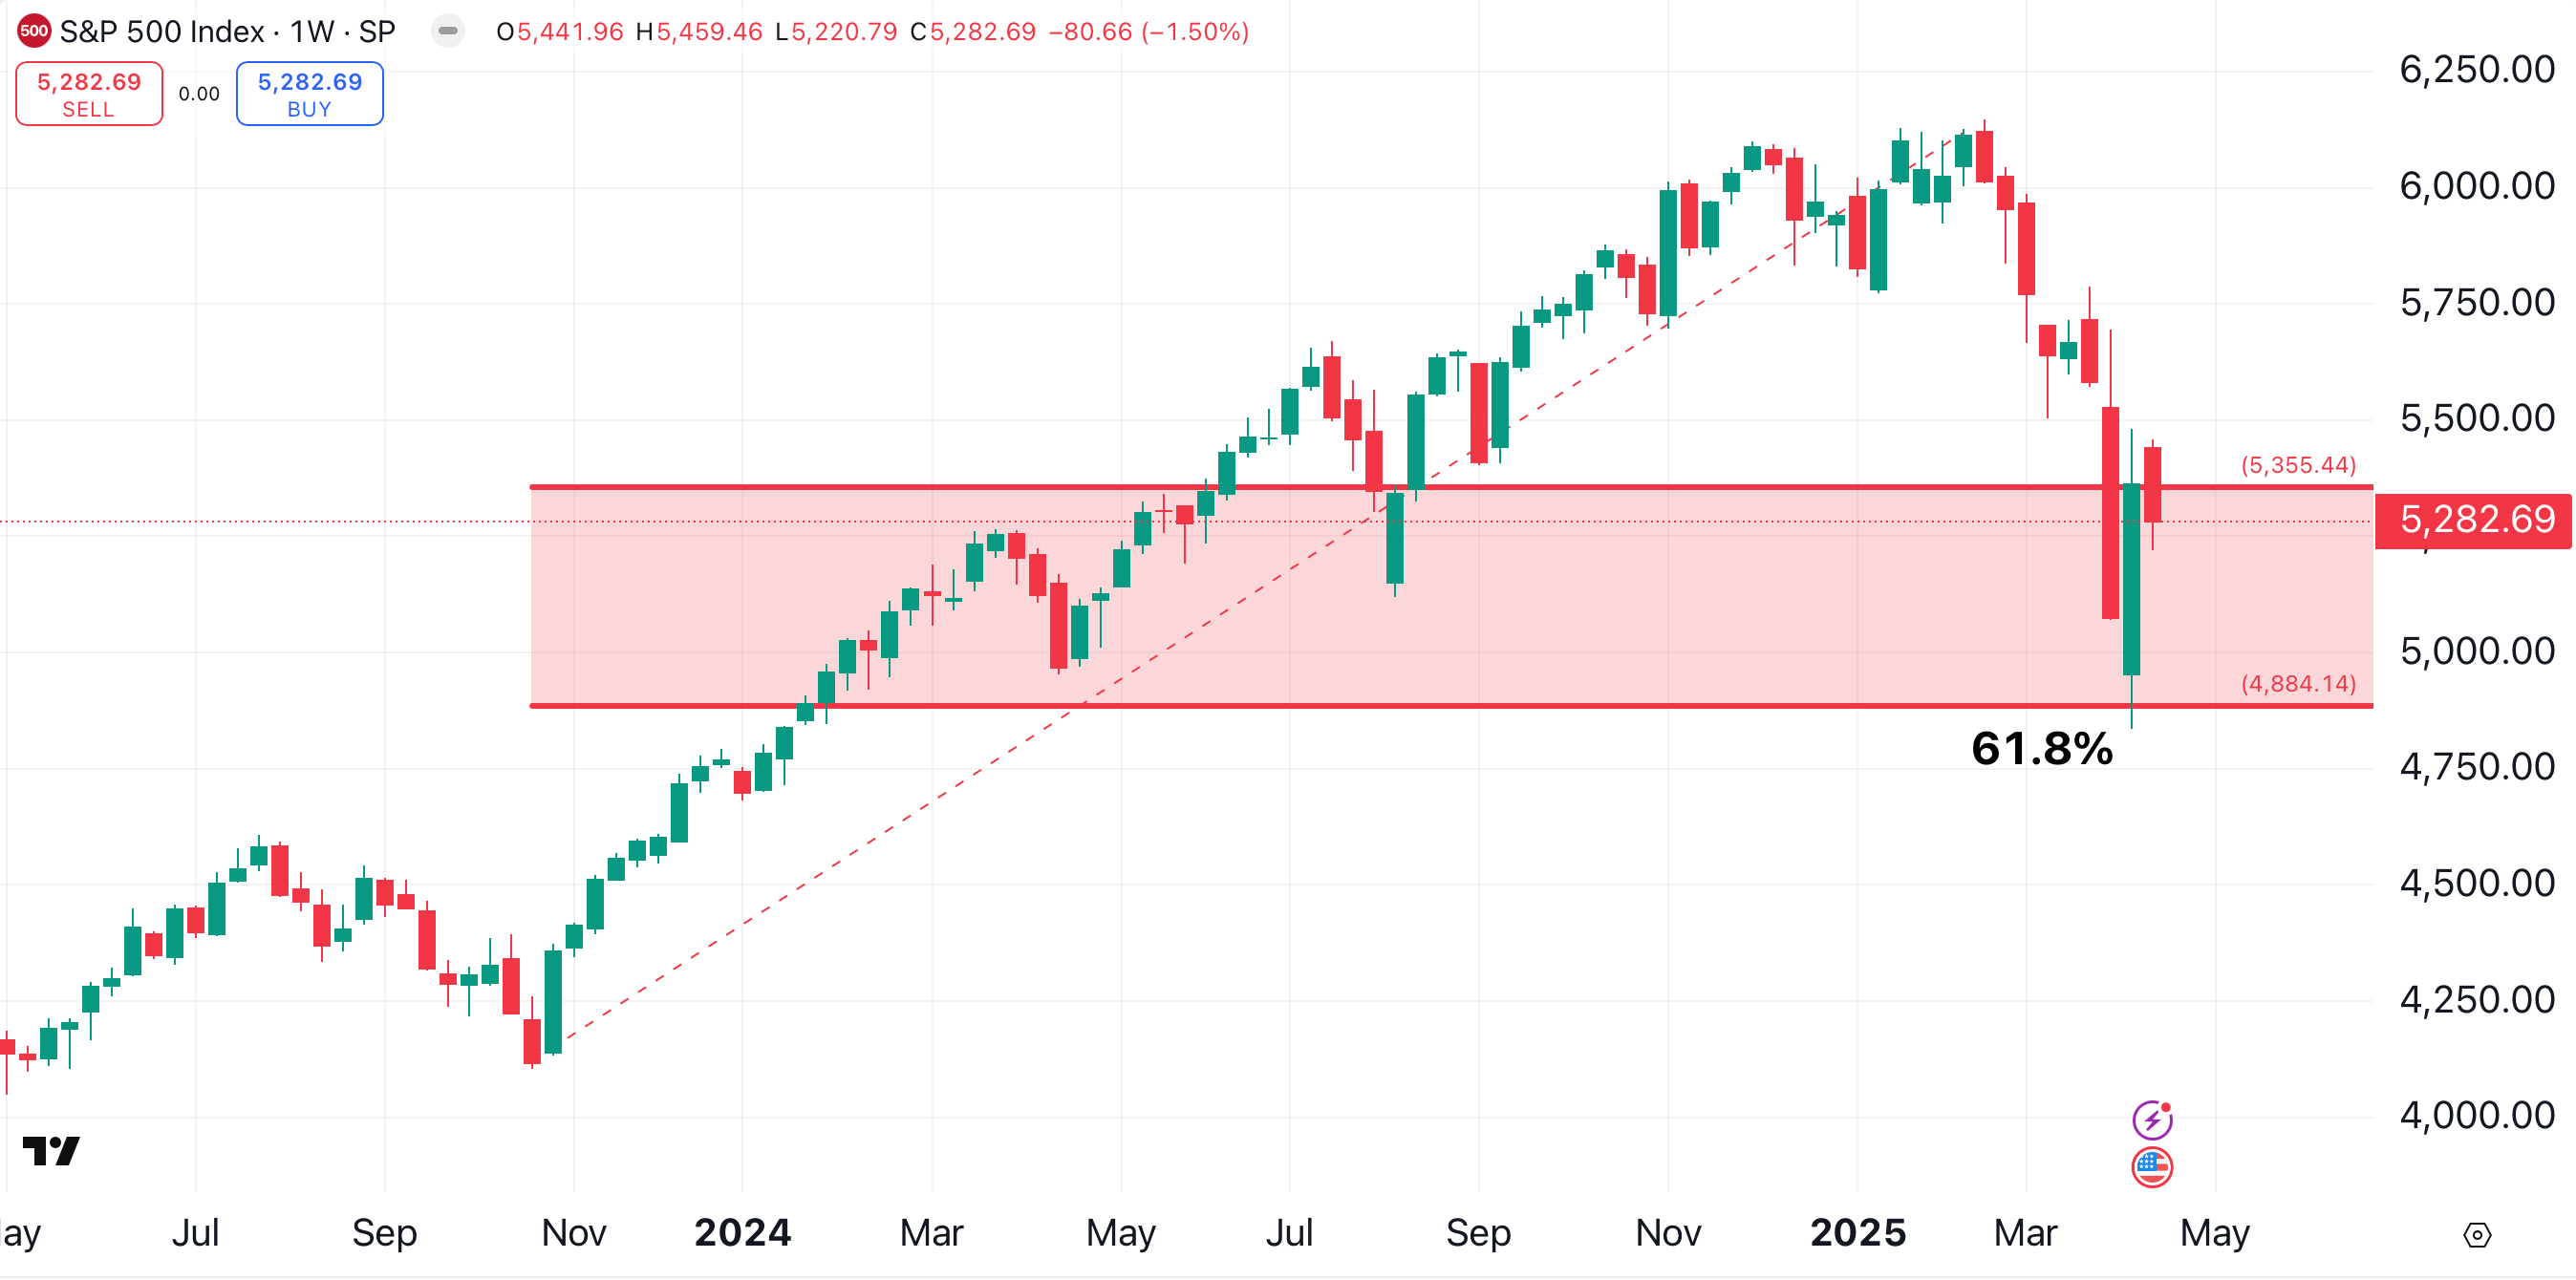
From this perspective, the focus is on the April 7 low of 4835, which is within 50 points of the Fibonacci retracement level.
If a trader buys the S&P 500 now, with a plan to sell if the price breaks below 4835, the downside from Thursday’s close is 447 points. A rally to the all-time high, a logical target if the 4835 low holds, would carry the index higher by 862 points.
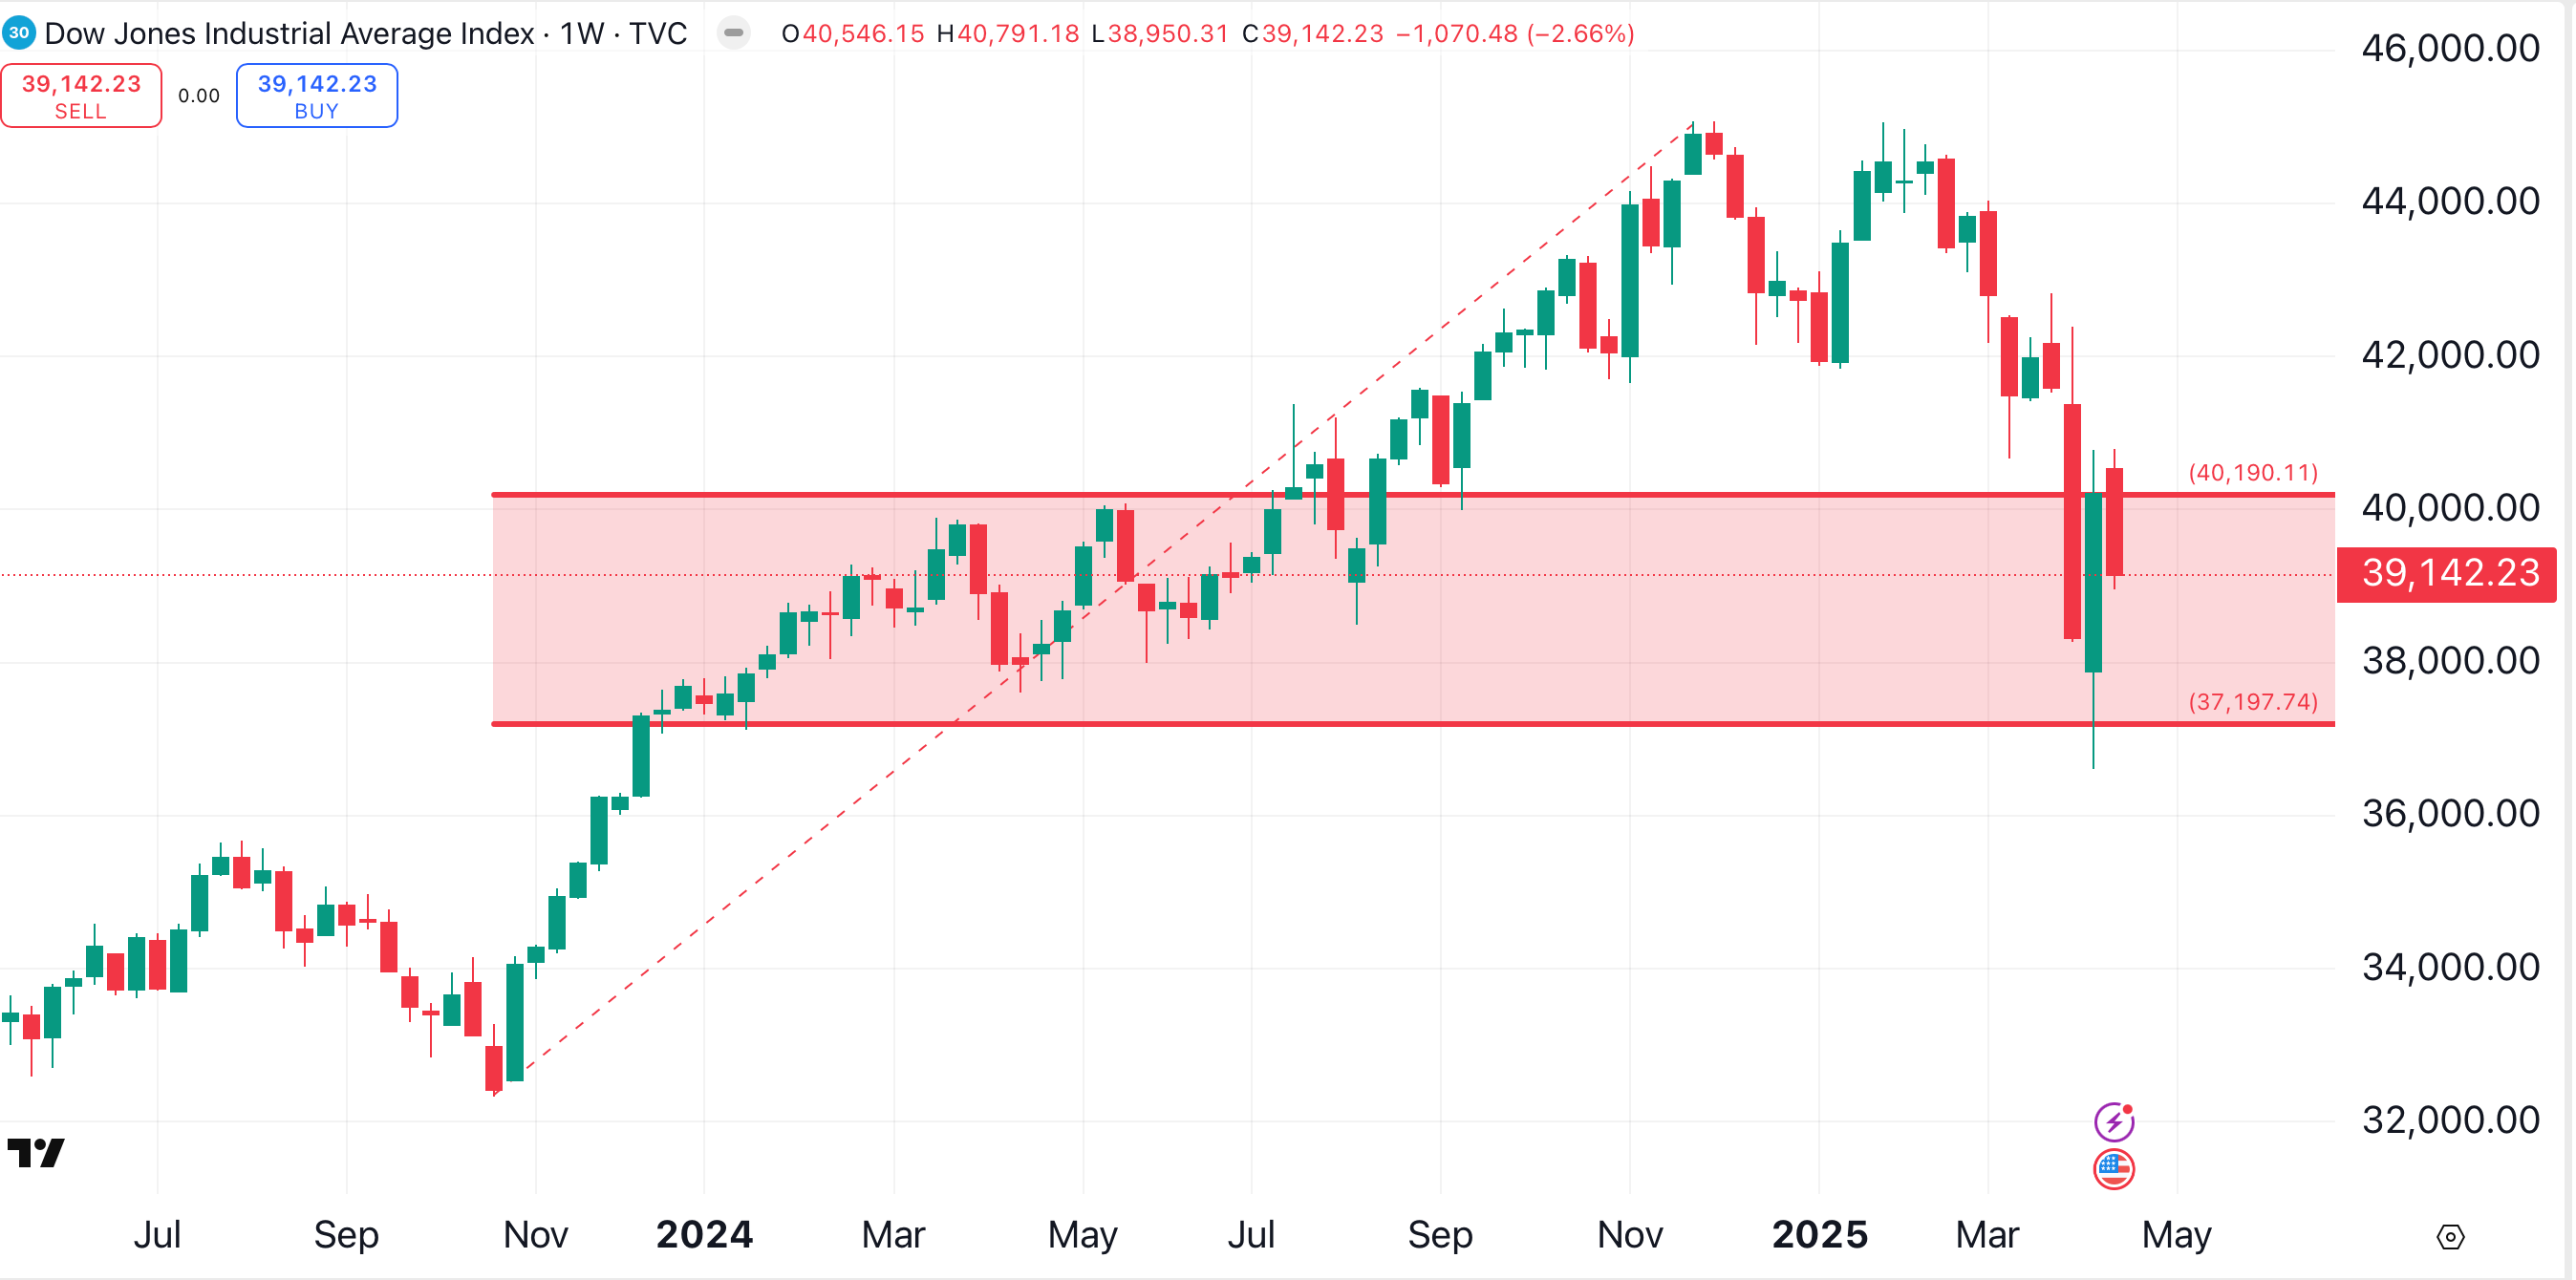
The Dow Jones Industrial Average presents a similar setup. This chart shows a potential downside of about 2500 points from Thursday’s close to the April 7 low. Meanwhile, there are over 5700 points of upside from Thursday’s close to the index’s all-time high.
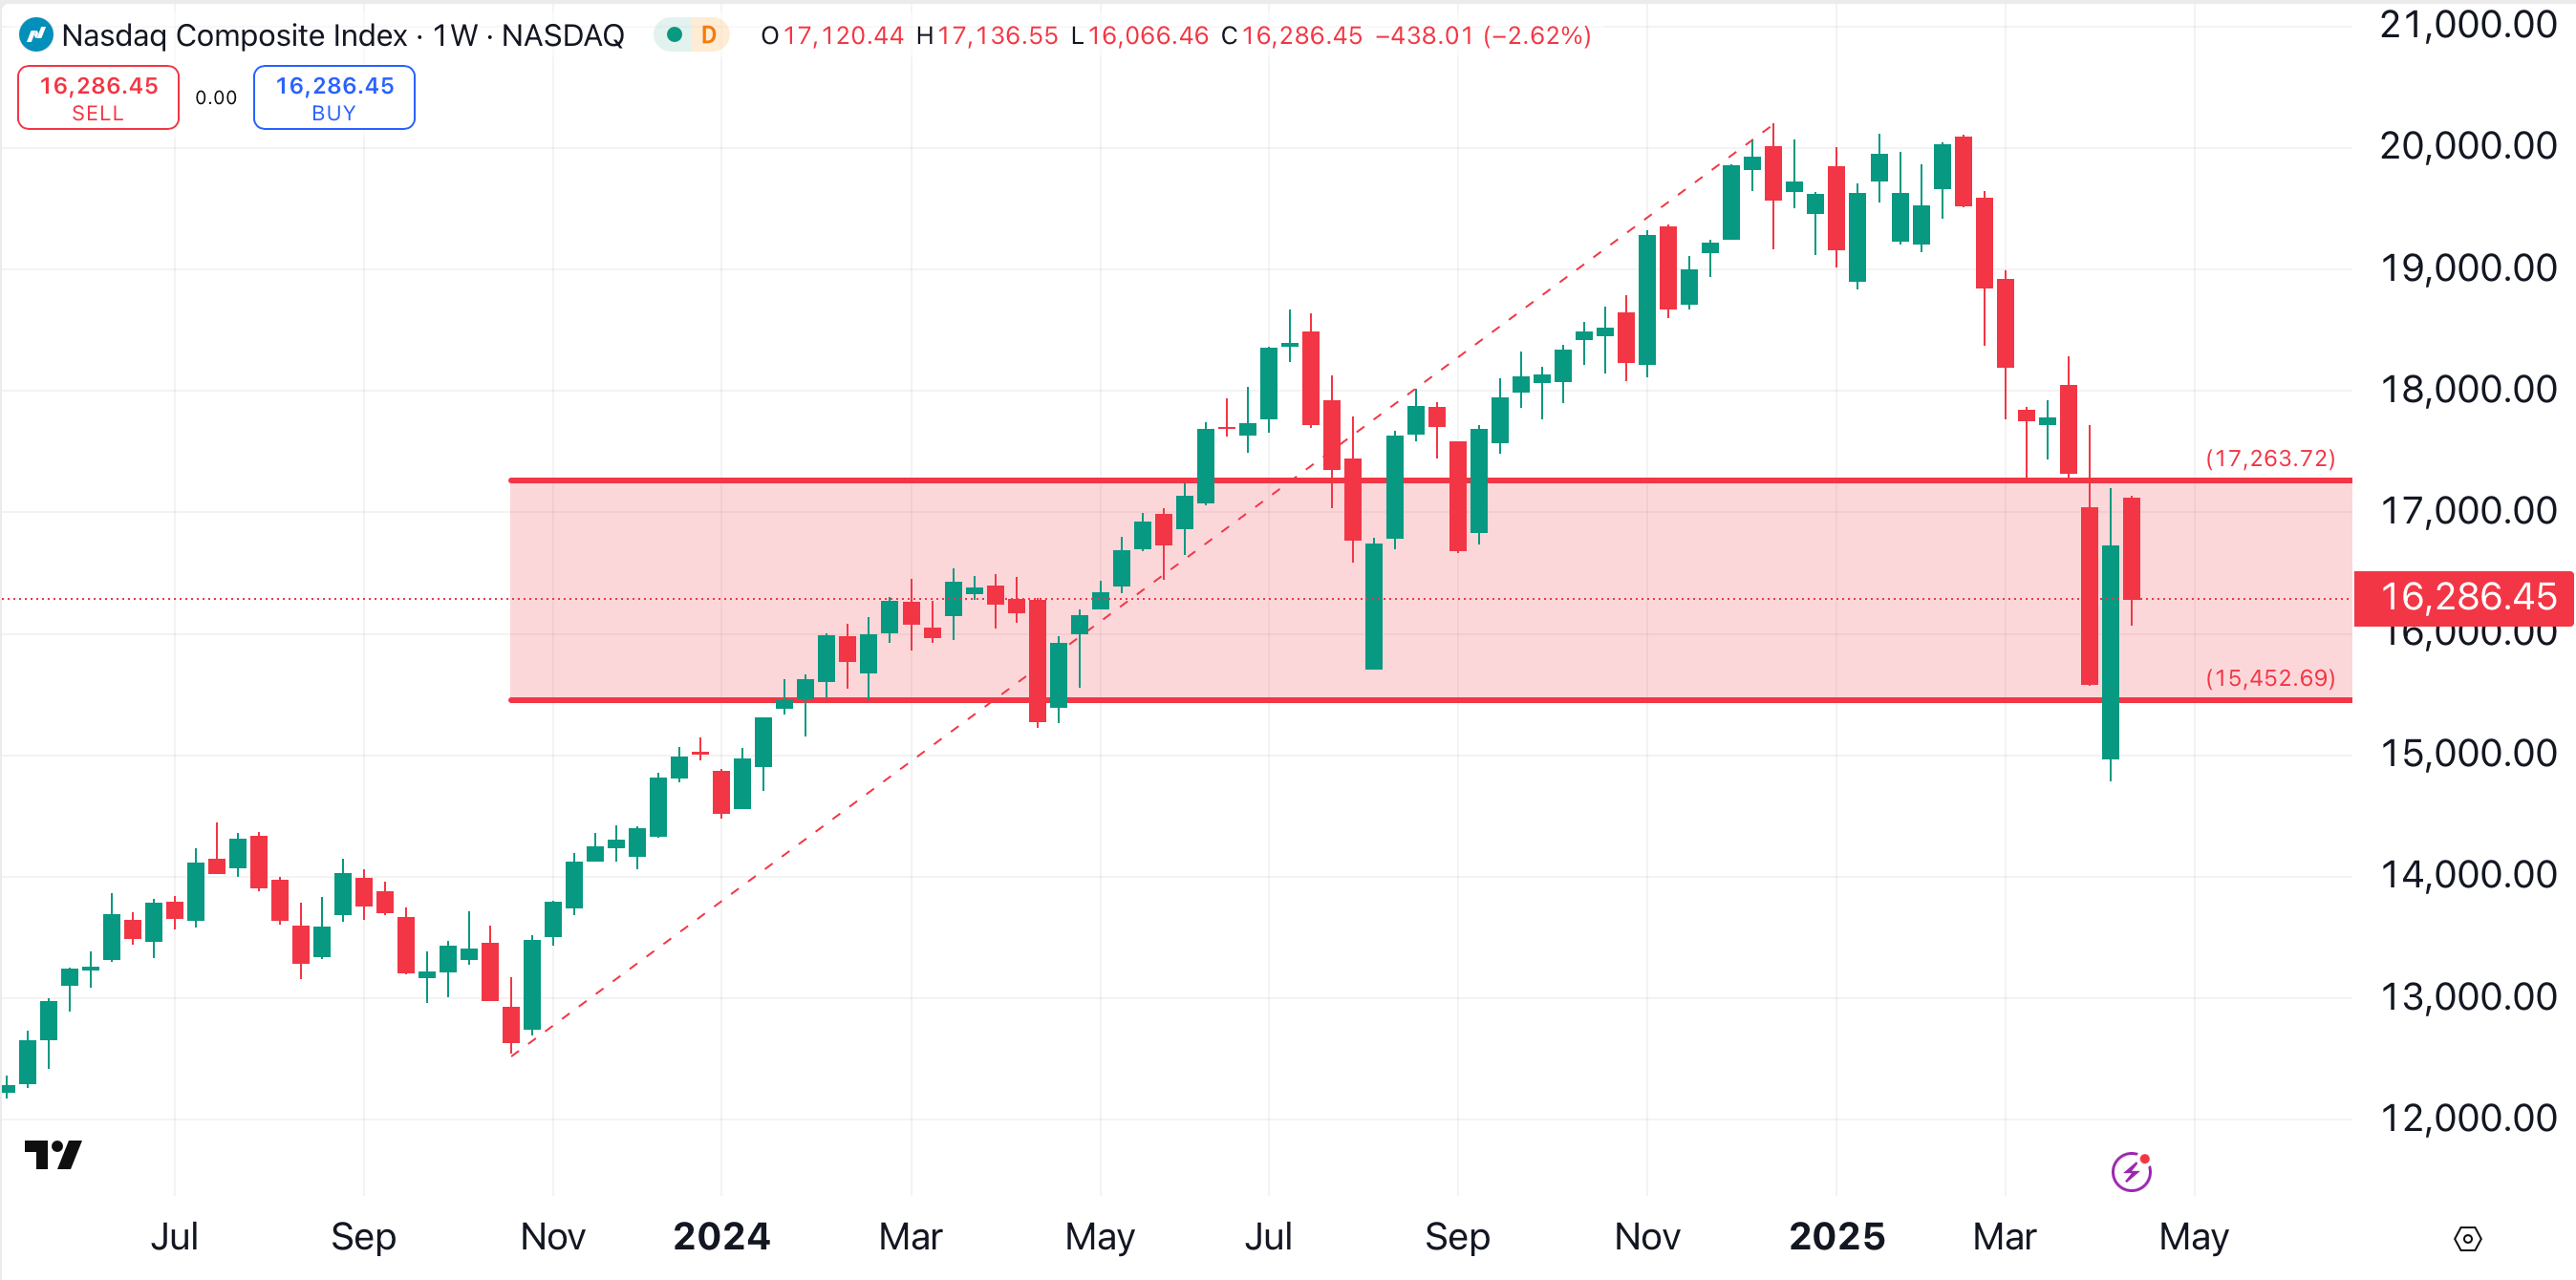
Looking at the weekly chart of the Nasdaq Composite, the price sliced through that 61.8% retracement. Based on this chart, I wouldn’t attempt to replicate the above trade on the Nasdaq.
For some, the potential downside of 2500 Dow points or 450 S&P 500 points may be too large, despite the greater upside in both situations. If that’s the case, we can compensate by using a smaller position size.
Another way to reduce risk would be to simply wait for a better price.
If we are able to buy the Dow Jones or the S&P closer to their lows, and maintain the risk management principle of cutting losses if the price makes a lower low, the potential downside would be even less — and the upside would be greater.
At the time of publication, Ponsi had no positions in any securities mentioned.