A Quiet Market, But Can Intel Shares Begin to Rally?
Stocks are pretty much where they were last week. Small caps haven’t moved in two months! But is Intel preparing for a move up?
You've reached your free article limit
You've read 0 of 1 free Pro articles.

The Market
The last seven trading days have seen the S&P and Nasdaq alternate between red and green. Then I look at the actual level, and I see the S&P is pretty much where it was a week ago. Heck, the Russell 2000 is at 3005. It closed at 3007 on June 25th!
It is highly unusual to see the market so quiet, and that quiet doesn’t end in a whoosh yet, as I discussed the other day, Nasdaq is getting oversold. I do not know how to square the short-term oversoldness with the other indicators that say we need a whoosh. I can tell you I hope I am not sitting here writing a week from now that the S&P is still the same place it was on August 18th! Or that the Russell is still at 3000 as it was two months ago!
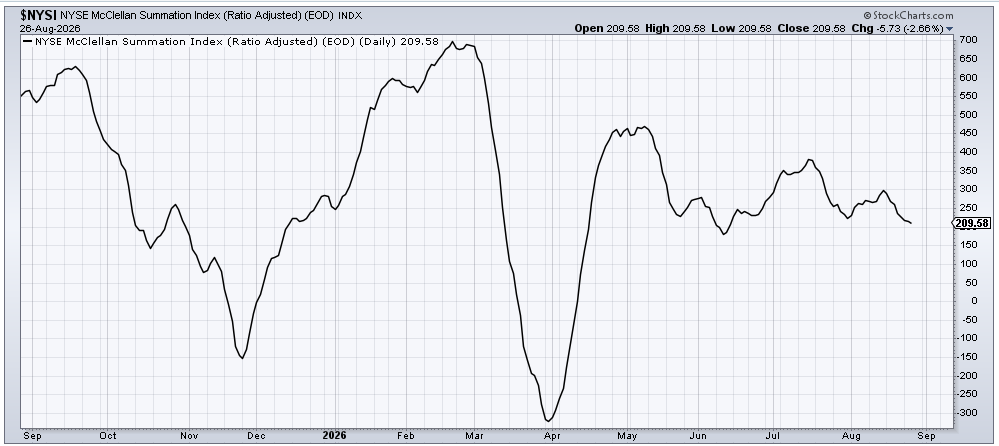
I would note that the McClellan Summation Index for the NYSE has been heading down for a few weeks now. That’s why I thought we’d see a pullback in the others. Yet that has not happened; it’s been much more sporadic.
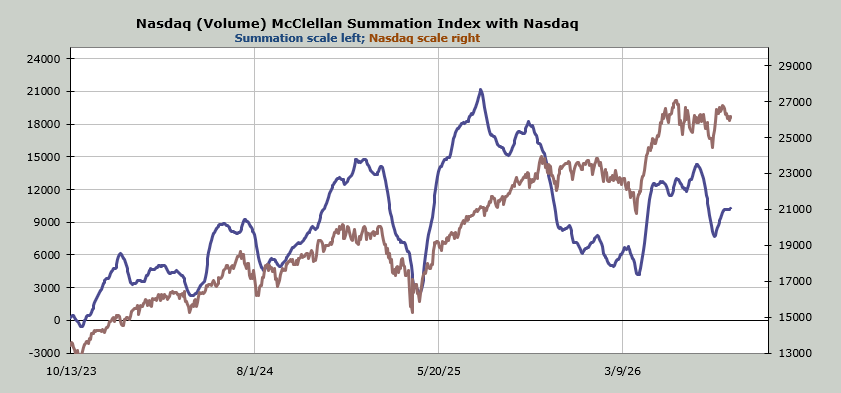
Yet while the NYSE Summation Index has been heading lower, the Nasdaq’s Summation Index has been heading upward. It’s one reason I have been more drawn to the growth stocks/tech stocks than the others right now.
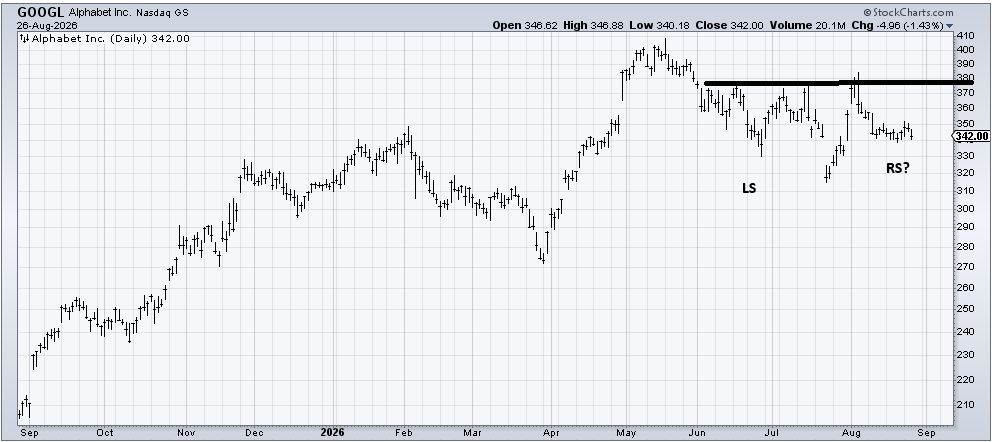
That’s one reason I have had my eye on Alphabet (GOOGL). Yet it hasn’t been able to push over that 350 area. Maybe the oversold condition can get it there.
In any event, the indicators did not change today, and that includes the DSI for the VIX, which remains at 15.
I will end with a comment on the bonds: TLT held 83 on that minor uptick in inflation. The big test will be what Chair Warsh says on Friday. If the bonds rally tomorrow, they will be a little bit short-term overbought by Friday.
New Ideas
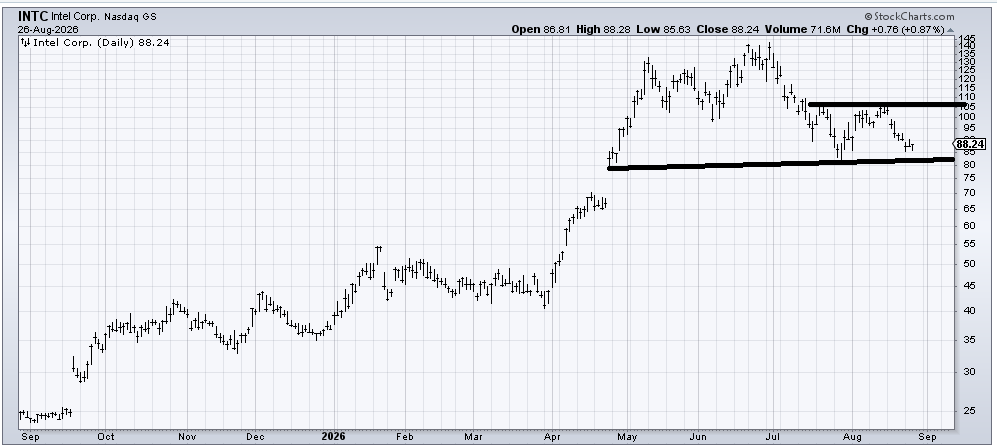
You may recall, back in May, I decided Intel (INTC) looked parabolic to me, and after it came down, I turned neutral on it. I was asked if I am still neutral on it. I would say I think it can rally, and as long as it doesn’t break under 80, it ought to be okay for now. If it does rally and can’t get back over 95, then I would fret.
Today’s Indicator
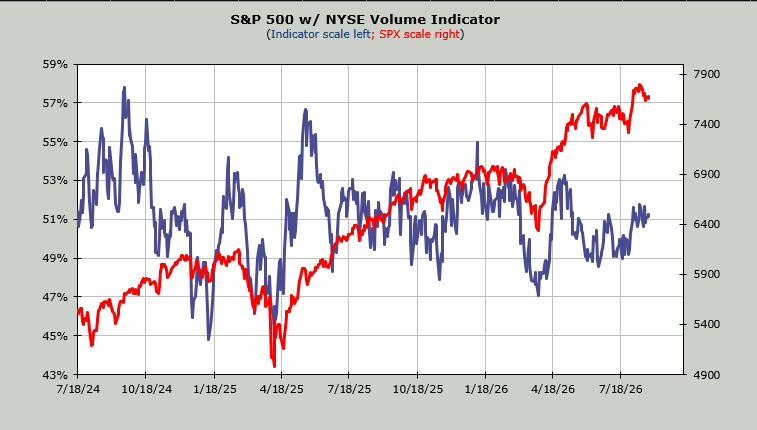
The Volume Indicator mimics the S&P since it has been at 50% for most of the month of August.
Q&A/Reader’s Feedback
Helene welcomes your questions about Top Stocks and her charting strategy and techniques. Please send an email directly to Helene with your questions. However, please remember that TheStreet.com Top Stocks is not intended to provide personalized investment advice. Email Helene here.
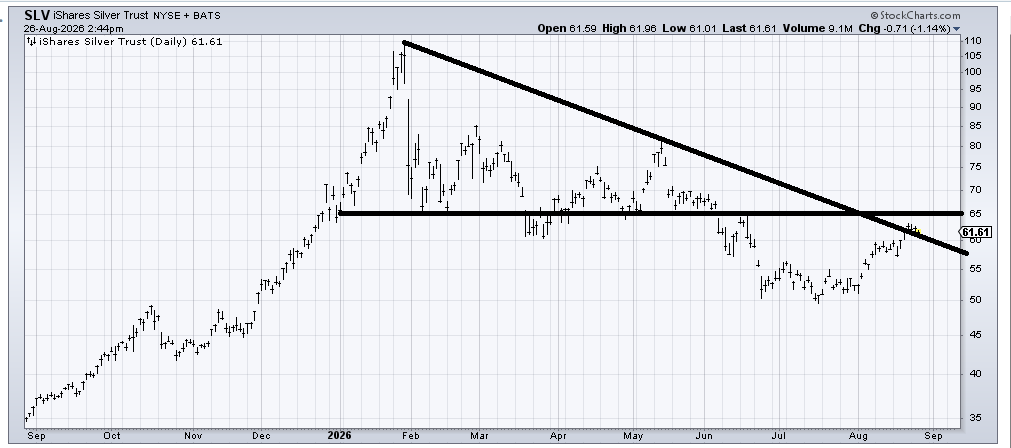
I have been much more bullish on GLD than SLV in this run, and I would say that view is unchanged. SLV has resistance in this 60-65 area. The DSI was over 81 on Tuesday, which tells me the runway is short. I still think that run in SLV in January looks like a bubble burst.
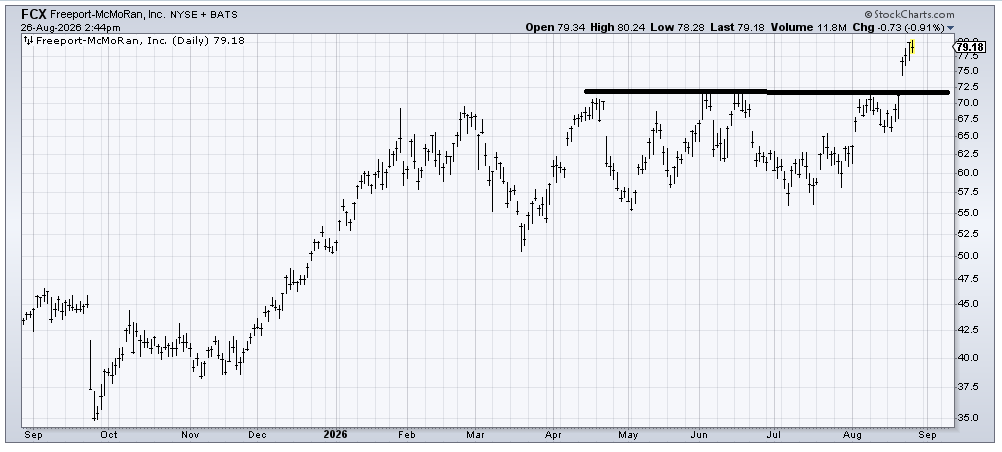
With the caveat that I am a terrible chaser, I have thought Freeport McMoRan (FCX) was okay when we last checked in on it in early August. That chart now measures to the upper 80s, although I do not expect it to get there in a straight line. If it did pull back to the 70-72 area, it ought to be buyable. The DSI on Copper was 72 on Tuesday.
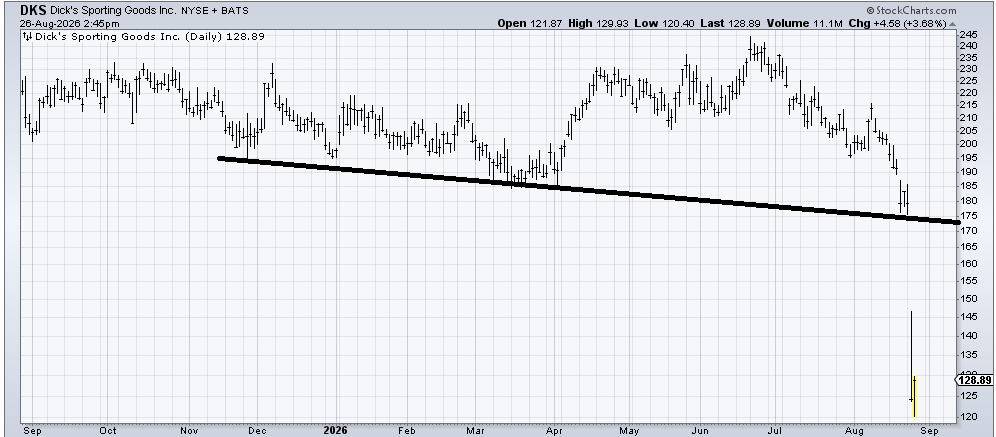
That was quite a break in Dick’s Sporting Goods (DKS) this week. Typically, I would say wait three days for it to settle down, and then you can expect an oversold rally. The stock did get to the measured target area (110-120) on this massive drop. But I am a base picker, and even though I like stocks down and out for the time being, all I see is a bounce here. There ought to be a lot of tax loss selling in the fourth quarter in this name.
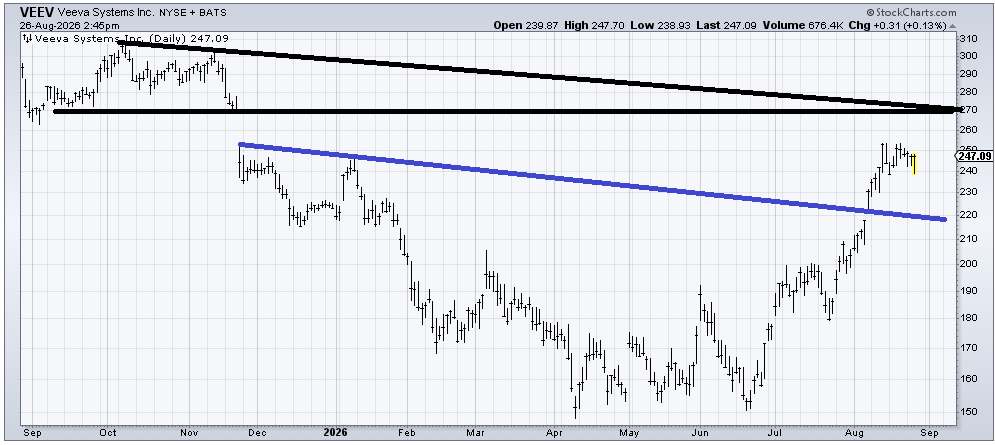
I can’t decide if Veeva (VEEV) is going to fill the gap overhead (near 270) first or come down and retest the breakout (blue line) around 220. So for now I’d like to buy a pullback to that 220 area.
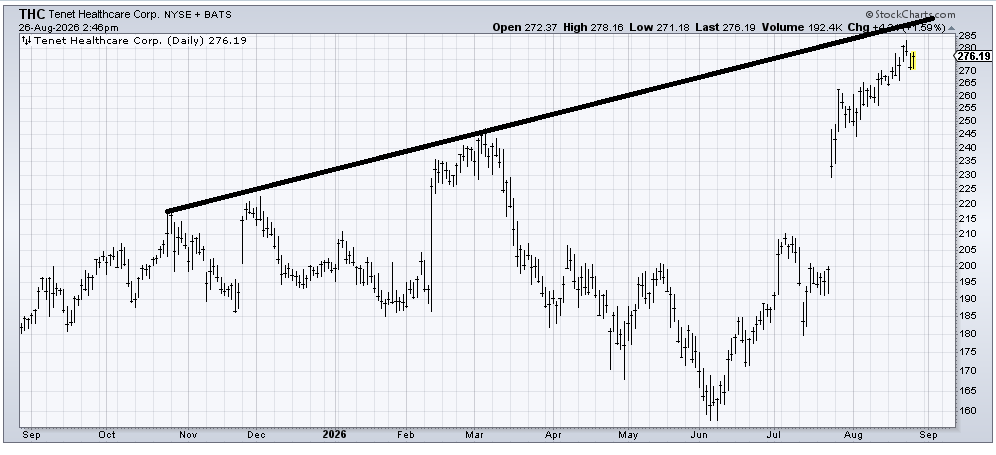
Tenet Healthcare (THC) is over-extended but still a good chart. That trendline comes in around 290-300. I’m unsure where to put a stop, though. 255 seems quite far away.