Market updates and conversation from TheStreet Pro team. Follow the latest and join the conversation below.
Stock Market Today: November 11, 2026
Newest first · All times Eastern · 7 updates
DATE:
By Neil Sethi
Consumers Continue to Consume
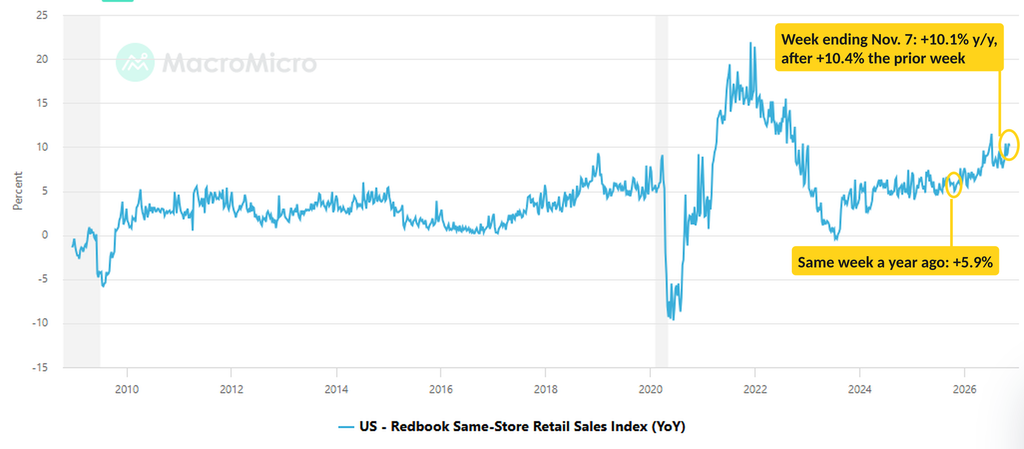
Redbook same-store sales, which track a panel of large general-merchandise retailers such as department stores, discount chains, apparel retailers, drugstores and warehouse clubs, rose 10.1% year over year in the week ending Nov. 7. While that’s down from 10.4% the prior week, that week was tied for the highest since early July, and it remains well above the 5.9% in the same week a year ago, the second straight week above 10%.
The NYSE Saw Its First 80% Downside Day Since December Last Week. What Comes Next?
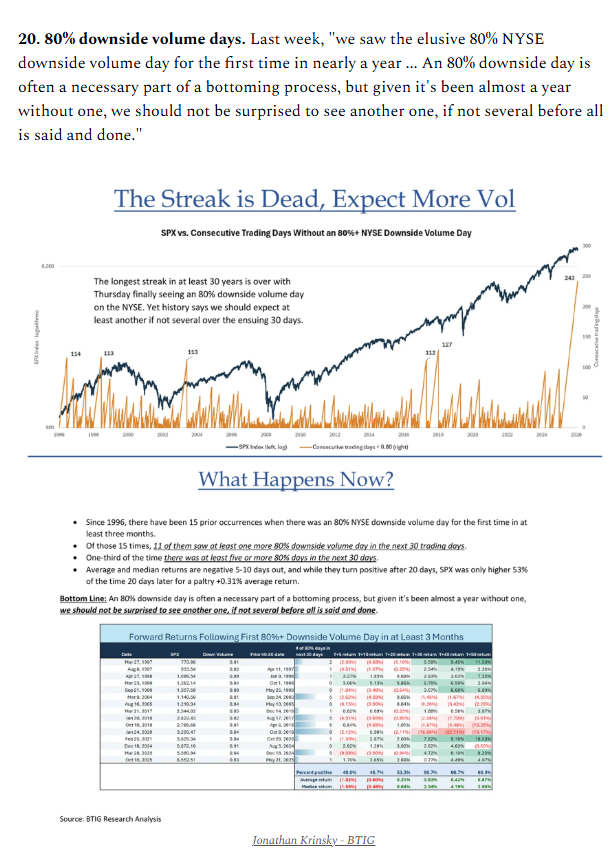
As noted in last Thursday’s evening update (AI Rout Sends the Tech Sector to Its Worst Day Since the Covid Crash), the 4.4% drop in the S&P 500 brought the first 80% downside volume day on the NYSE in nearly a year. That means at least 80% of NYSE volume was in declining stocks. It ended a 243-session streak without one, which BTIG’s Jonathan Krinsky says was the longest in at least 30 years (via Daily Chartbook).
Krinsky notes that an 80% downside day is often part of a bottoming process, but it’s rarely a one-off. Since 1996, there have been 15 previous times when the NYSE had its first 80% downside day in at least three months. In 11 of them, at least one more came within the next 30 sessions, and in five there were five or more. His bottom line is that “we should not be surprised to see another one, if not several.”
Near-term returns haven’t been great. The S&P 500 was lower on average one and two weeks later, down 1.0% and 0.6%, and higher only 40% and 47% of the time. A month later it was up just 0.3% on average, and higher 53% of the time. Two months out, the median gain was 4.2%, but the average was just 0.4%, dragged down by January 2020, just before the COVID crash.
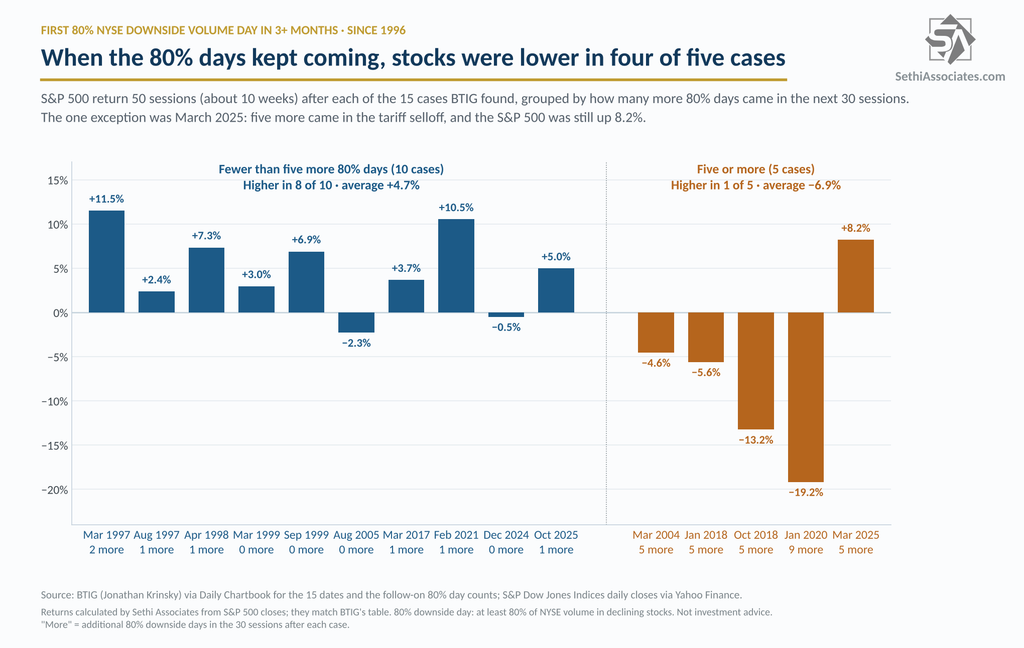
Going through the cases, though, what mattered was whether more 80% days followed. In the five cases with five or more within 30 sessions (March 2004, January and October 2018, January 2020 and March 2025), the S&P 500 was higher 50 sessions later just once, with an average loss of 6.9%. The exception was March 2025: five more came during the tariff selloff, and the S&P 500 was still up 8.2% 50 sessions later. In the other 10 cases, it was higher 30 sessions later nine times (an average gain of 3.5%) and 50 sessions later eight times (4.8%).
One caveat is Thursday’s drop was bigger than the day-of drop in any of the 15 earlier cases; the largest previously was 3.3% in October 2018. The S&P 500 is up 2.3% from Thursday’s close through Tuesday. The thing history says to watch is whether more 80% days show up in the 30-session window, which runs through December 18.
Note: Whether volatility remains high is also the swing factor for the spot-down, vol-down signal I noted earlier (see below), which has pointed to gains a month out.
Goldman Now Calls for Two More Hikes, Pushes First Cut to December 2027
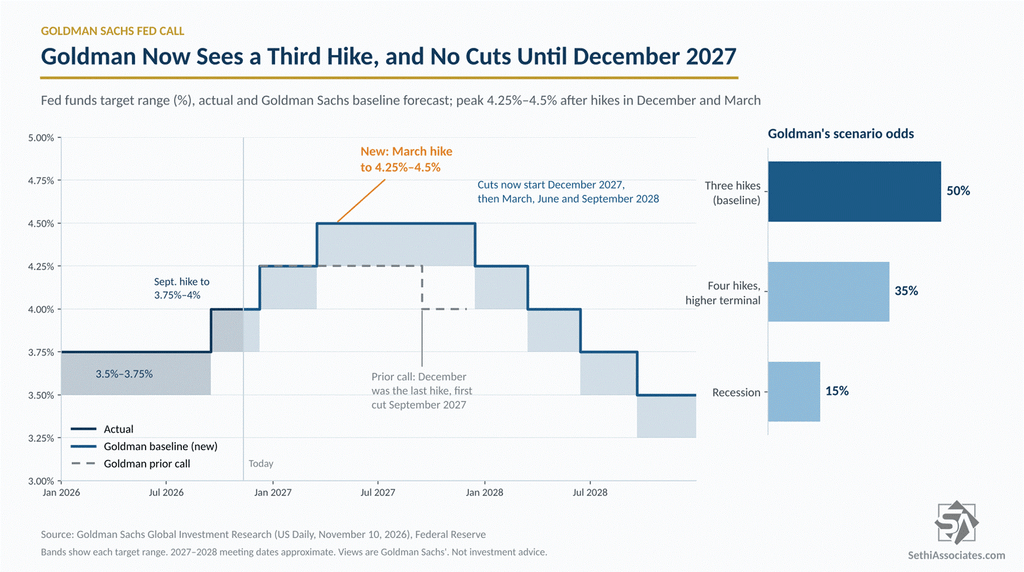
After Tuesday’s hot October CPI report, Goldman Sachs US Economics Team (Mericle) has dropped its call that December would be the Fed’s last rate hike, adding another quarter-point hike in March 2027 and pushing its first rate cut back a quarter to December 2027. That would take the Fed funds rate to a peak of 4.25% to 4.5%, from 3.75% to 4% today. Goldman is far from alone in the call, but it’s widely followed, so I thought it worth a quick post.
What Changed
Goldman still expects a quarter-point hike at the Fed’s December 8–9 meeting. Goldman left its estimate of where rates settle once cuts begin unchanged at 3.25% to 3.5%, but it now sees the path down starting later, with cuts in December 2027 and then March, June and September 2028.
The trigger was a third straight month of hotter-than-expected inflation. Core CPI rose 0.30% in October, and Goldman said the upside came from several categories, not just higher oil prices passing through (more on the report here). It estimates leftover seasonal distortions from last year’s government shutdown added about 0.05 percentage point, and that the data point to a 0.35% rise in October core PCE, the inflation gauge the Fed targets.
Why March, Not January
Goldman said the hike could come as early as January, since the Fed doesn’t have to stick to hiking every other meeting. But it expects softer November and December readings, with core PCE rising a bit less than 0.2% a month, before what it calls the “January effect”: companies raising prices at the start of the year while their costs are still elevated. A firm January report, out before the March meeting, would make the hike “the path of least resistance,” even if the energy shock looks over by then.
Goldman also expects most Fed officials to pencil in a third hike in December’s dot plot. That would require only two more officials raising their forecasts, so the December dots are the first test of the call.
A Quarter Point, Not a Half
Fed Governor Christopher Waller said in a speech Tuesday morning that if core CPI came in around 0.3% or higher, a half-point hike should be considered in December, and that hiking only a quarter point “would put our credibility at risk” (more here). Dallas Fed President Lorie Logan also backed at least two more quarter-point hikes, possibly at a quicker pace than the Fed has moved this fall. Goldman still sees a quarter point, betting most voters would hesitate to jump to 50. After the CPI report, futures put about a 14% chance on a half-point move.
As I mentioned, Goldman is far from alone. Deutsche Bank already expects hikes in December, January and March, and Bank of America is looking for December and March. Citi for now just sees one more quarter point in December but says the risk of another or a half-point increase has risen, per Reuters.
Notably, though, even with the extra hike, Goldman is less hawkish than the market. After Tuesday’s report, futures priced about 63 basis points of hikes through December 2027, about two and a half. Goldman’s baseline has two more hikes and then a cut that December.
The Other Side
Goldman also notes oil futures have fallen sharply since last week’s elections and thinks most of the energy shock’s pass-through to consumer prices is already behind us. It remains confident inflation will be meaningfully lower by the end of 2027 as the effects of tariffs, energy and AI-related price pressures fade.
Goldman puts 50% odds on its baseline, 35% on four hikes and a higher end point, and 15% on a recession.
What to Watch
The December 8–9 meeting will be key. Assuming a 25-basis-point hike, the dot plot will show where the Fed’s collective head is at as to the expected path next year. November CPI comes out December 10, the day after the decision (although the Fed will likely have the result). After that, the January inflation data, out in February, are what Goldman is counting on to deliver the March hike. For investors, the takeaway is that the first rate cut keeps getting pushed out, the same repricing behind Tuesday’s jump in the two-year Treasury yield.
Good Morning and Happy Veterans Day to those who have (or currently do) serve!
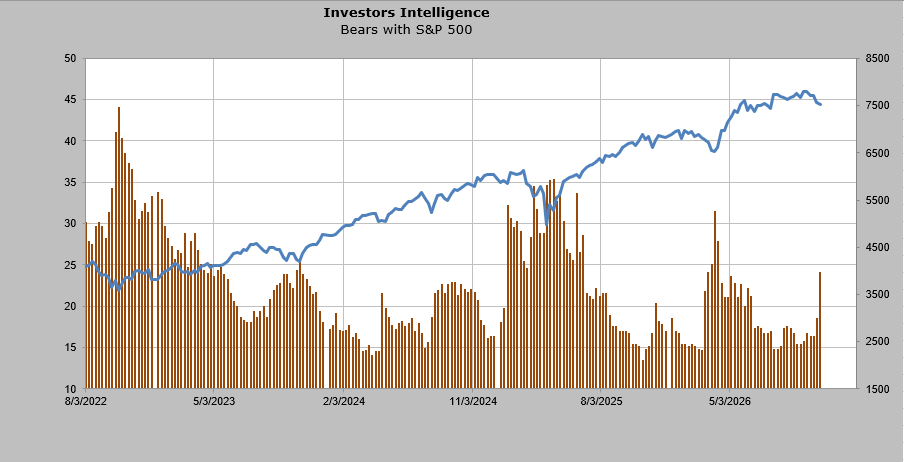
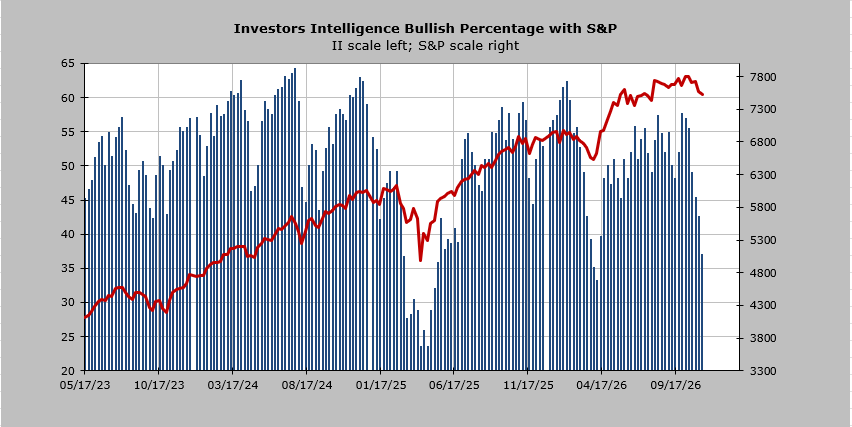
We finally had a serious change in sentiment, data-wise. This week’s Investors Intelligence Bulls fell to 37% and the Bears jumped to 24%, This is the most bears and fewest bulls since April.
Stocks and the VIX Fell Together Tuesday. Here’s What Usually Comes Next.
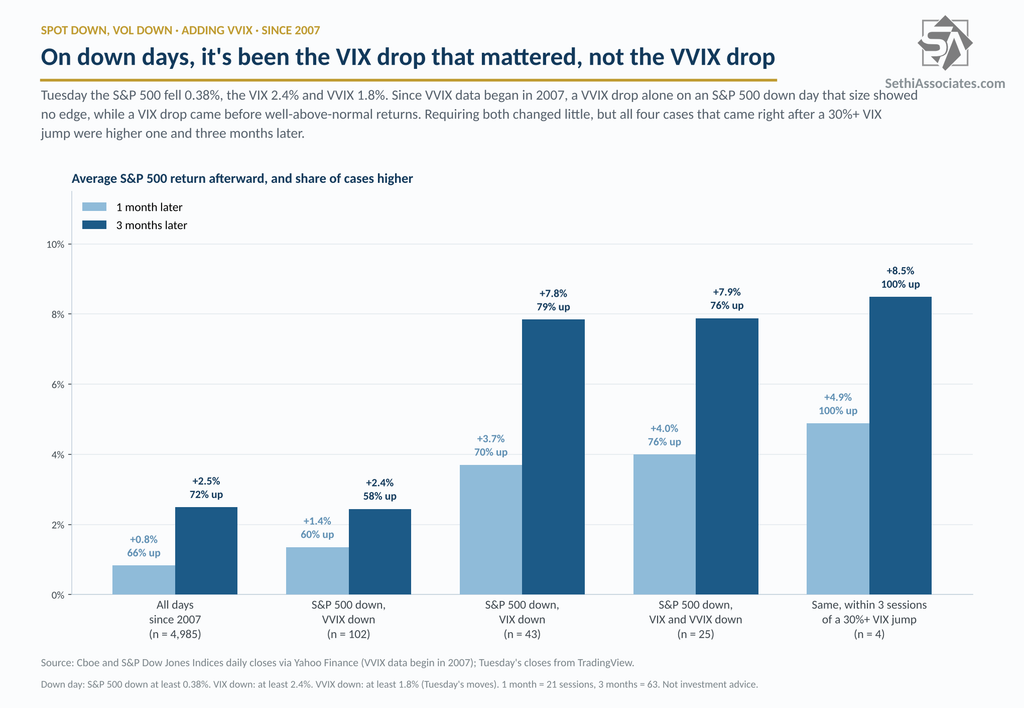
The S&P 500 fell 0.38% Tuesday as a hot CPI report and two hawkish Fed officials sent Treasury yields sharply higher (The Equity Bounce Runs Into a Hawkish Fed). But the Cboe Volatility Index (VIX) fell 2.4% to 19.45, extending Monday’s 22% drop (An Unprecedented Whipsaw in Investor ‘Fear’). VVIX, which tracks expected swings in the VIX itself, fell 1.8% to 96.63.
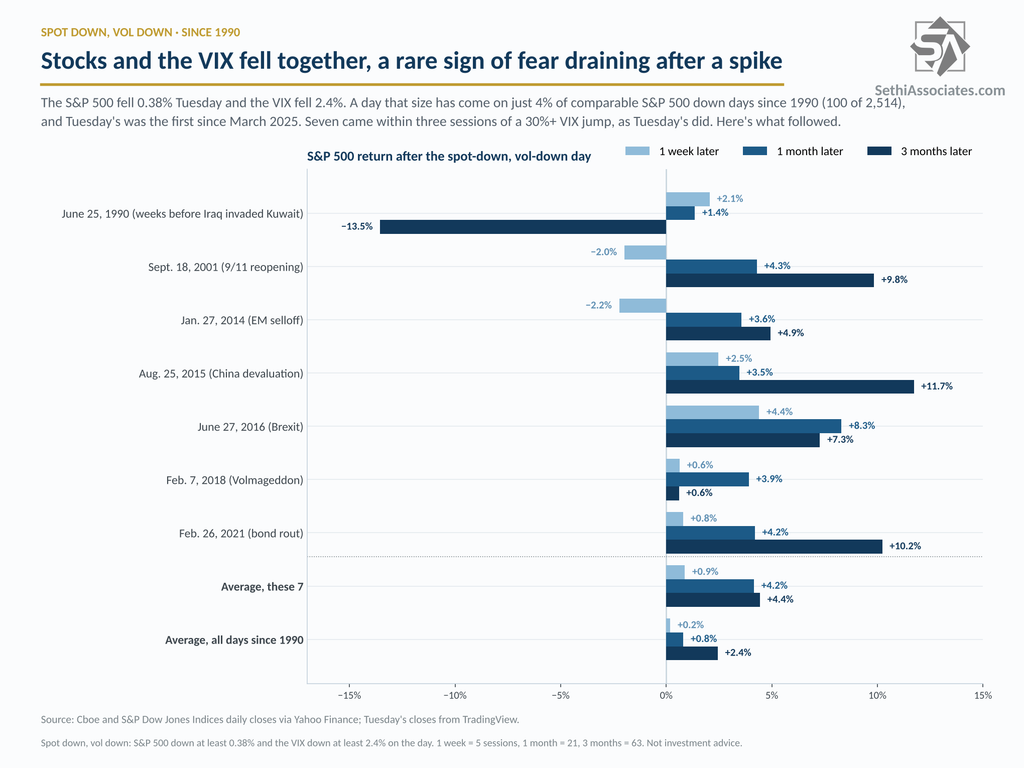
A “spot down, vol down” day isn’t unusual by itself. The VIX has fallen on about 23% of S&P 500 down days since 1990. At Tuesday’s size, though, it’s rare: the S&P 500 down at least 0.38% and the VIX down at least 2.4% has happened on just 100 of 2,514 comparable down days, or 4%. There were none in the past year, and Tuesday’s was the first since March 11, 2025.
It tends to show up when volatility is already high and starting to ease. Sixty-nine of those 100 days came with the VIX already at 19 or higher, and 11 came in the 2022 bear market alone.
Seven came within three sessions of a 30%-plus VIX jump, as Tuesday’s did after Thursday’s 70% spike:
June 25, 1990.
Sept. 18, 2001, the second session after markets reopened following 9/11.
Jan. 27, 2014, during an emerging-market selloff.
Aug. 25, 2015, after China’s devaluation.
June 27, 2016, after the Brexit vote.
Feb. 7, 2018, after “Volmageddon.”
Feb. 26, 2021, during a Treasury selloff.
The S&P 500 was higher a month later all seven times, by 4.2% on average, versus 0.8% for all days since 1990. Three months later it was up six of seven times, by 4.4% on average versus 2.4%. The exception was 1990, when Iraq’s invasion of Kuwait in August sent stocks sharply lower. The first week was more mixed, with gains in five of seven, and the VIX was lower a month later in six of seven.
What about VVIX? Its data only go back to 2007. On its own, a VVIX drop on an S&P 500 down day that size (102 cases) came before roughly normal returns. The S&P 500 was up 1.4% a month later on average and 2.4% three months later, versus 0.8% and 2.5% for all days since 2007, and it rose less often than usual.
The caveat: These are small samples, so take that into consideration.
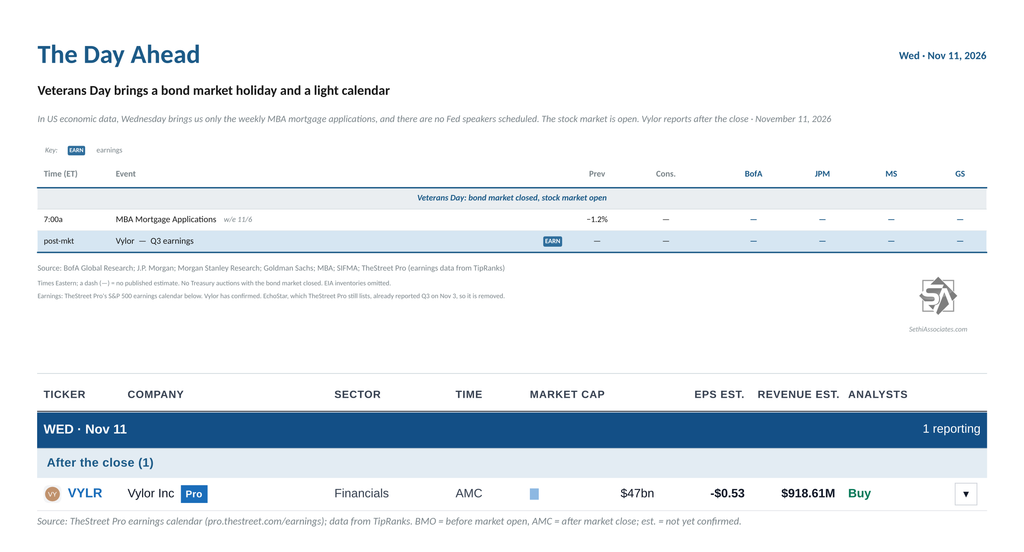
In U.S. economic data, with the bond market and government offices closed in honor of Veterans Day, Wednesday brings us only weekly MBA mortgage applications. U.S. stock markets are open.
There are no Fed speakers or Treasury auctions scheduled.
Just one S&P 500 component reports, and its market cap is under $100B:
Remember to make it a point to thank a veteran today for their service. Thanks @stephen-guilfoyle!
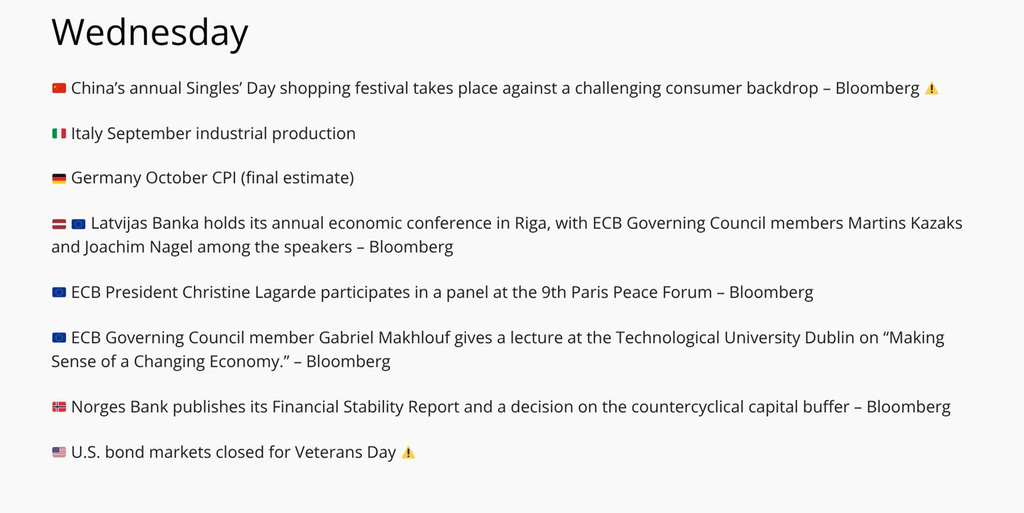
Ex-U.S. highlights include China’s Singles’ Day shopping festival, Germany’s final October CPI, and ECB President Christine Lagarde on a panel at the Paris Peace Forum, with ECB policymakers Joachim Nagel, Martins Kazaks and Gabriel Makhlouf also speaking.
Conversation 0 Comments
One ongoing discussion across all days. Everyone can read; sign in to take part.
Your voice matters. Discussions are moderated for civility. Read our guidelines .
Log in to join the conversation