Weekly Roundup: A Hot Start to August as Portfolio Catches a Wave
We added three new holdings this week, diversifying our lineup, and locked in massive gains across three others.
You've reached your free article limit
You've read 0 of 1 free Pro articles.
It’s been a busy start to August, between start-of-month economic data, another round of quarterly earnings, and potential developments between the U.S. and Iran. It was also a bit of a volatile one, but by the end of the week, falling oil prices and Treasury yields led volatility lower and the market higher. Week over week, the S&P 500 and the Nasdaq Composite rose in the low-to mid-single digits, building on year-to-date gains from the end of July. And as we’ll get to down below, the Pro Portfolio rose at quicker pace this week, expanding its year-to-date lead over the S&P 500.
The market began the week looking for a potential deal between the U.S. and Iran, and as we write this, one has yet to appear. Based on the move in oil prices, it’s fair to say the market remains hopeful for getting things back on track in the near term. Let’s remember, though, that such a deal is expected to be temporary, essentially putting us back where we were earlier this year with the MOU. To us the barometer to watch remains the volume of traffic passing through the Strait of Hormuz and the impact on oil and petrochemical prices, and supply chains. While hopeful for a lasting resolution, we will let the data dictate our actions.
Layered on top was Monday’s ISM Manufacturing PMI report for July, and it came in well ahead of expectations. The headline index jumped to 55.6%, up 2.3 points from June and the best reading since May 2022, comfortably topping consensus estimates near 54%. Production led the improvement, and the detail we found most encouraging was the employment subindex crossing back above the 50 breakeven line for the first time in 33 months. New orders and backlogs firmed too, and growth was broad-based, with 15 of 18 manufacturing industries in expansion. One flag that should not be overlooked was the Prices component. While the July figure was down compared to June, it was still deep into expansion territory. The point to note is that raw material costs have now risen for 22 straight months, so input cost pressure hasn’t gone away even as demand strengthens.
The highly anticipated July Employment Report landed Friday and it missed in a big way. Compared with the roughly 80,000 jobs the market was calling for, nonfarm payrolls fell by 23,000. The report also contained large downward revisions to May and June. The unemployment rate held near 4.1%, but mostly because labor force participation slipped rather than because hiring picked up. And as we called out in our analysis, average hourly earnings rose just 3.2% year over year, the slowest pace since May 2021.
In response to the July Employment Report, the CME FedWatch Tool now shows the odds of the Fed standing pat in September at 56%, up from 45% on Thursday and 33% on July 31. That led the market to finish the week on a strong note, and the Pro Portfolio as well. The reason: a materially weaker labor market gives the Fed less reason to keep raising rates, and Treasury yields fell sharply on the release as traders pushed out the timing of any additional hike.
For now, a strong earnings season and easing rate-hike odds are giving stocks the benefit of the doubt. Should positive developments on the U.S. and Iran deal front emerge in the coming days, it has the potential to put the S&P 500 and the Nasdaq Composite in overbought conditions.
While the current earnings season so far has been impressive, in the coming weeks, just as we hit the late-summer doldrums, retail companies will deliver their latest quarterly results. They will also starting sharing expectations for the second half of the year, and that means touching on expectations for the year-end holiday shopping season. We also have some meaningful economic data coming before Fed Chair Warsh delivers his Jackson Hole keynote address.
We’ll take in those data points, comments and other learnings and update our investment mosaic as we do so. To help us with that, when we kick off next week, we’ll do so by taking a fresh look at consensus EPS expectations for the S&P 500 and our holdings. We’ll also update their RSI figures and a few other metrics. Just because the Portfolio’s lead over the S&P 500 expanded further this week, doesn’t mean it’s time to lose our focus and discipline.
Enjoy your weekend, Saturday’s signals alert, and we’ll see you back here, bright and early on Monday.
Catching Up on the Portfolio This Week
The Portfolio started August with a bang, extending its year-to-date lead over the S&P 500. Despite the late-week pullback in shares of Axon (AXON) and Neostellar (NSLR), the Portfolio’s overall climb week over week was led by a more than 30% gain in Palantir (PLTR) and double-digit moves in Marvell (MRVL) and NVDA (NVDA).
Arguably a better way to look at it is that across the Portfolio’s 28 individual stock and ETF positions, more than a dozen outperformed the S&P 500 this past week, and less than a handful closed out the week lower week over week. Also lending a helping hand was the rebound in the EPS Diplomats basket, which cut in half its July drag on the Portfolio.
Above you’ll notice we mentioned 28 individual stock and ETF holdings in the Portfolio. That is up from 25 at the end of July and reflects our initiating new positions in Builders FirstSource (BLDR), the Robo Global Robotics and Automation Index ETF (ROBO), and the State Street Health Care Select Sector Fund (XLV) between August 3 and August 5.
We used cash on hand as well as the big gains we locked in when we prudently took some chips off the table with Microsoft (MSFT), Palantir (PLTR), and Arista Networks (ANET) following their significant climbs, and in with MSFT and PLTR, their overbought conditions. On August 3, we also shook up the Portfolio’s Bullpen, removing American Water Works (AWK), D.R. Horton (DHI), Home Depot (HD), and the Utilities Select Sector ETF (XLU). In their place we added, Linde plc (LIN), Rockwell Automation (ROK), and Toast (TOST).
Stepping back a bit, over the last several weeks, we’ve diversified the Portfolio’s holdings with the ROBO and XLV ETFs, but also with Builders FirstSource, Boeing (BA) and Paccar (PCAR). We will continue to focus on prospects for superior earnings growth powered by demonstrative tailwinds and favorable valuations, and look to sidestep companies that are contending with headwinds, margin pressures, and stretched valuations.
The combination of the week’s moves left the Portfolio with ~7.6% of its assets in cash. While that gives us additional room to maneuver, we will remain mindful not only the market’s mood and its technical position, but also for our existing holdings.
Now let’s see what others on Wall Street had to say about the Portfolio’s holdings this week:
Monday: RBC reset its Eaton (ETN) price target at $512 vs. the prior $484 one, and did the same with Welltower (WELL), taking that one to $260 from $238. UBS added a few bucks to its price targets for Morgan Stanley (MS) and Bank of America (BAC), taking them to $260 and $70, respectively, from $255 and $68. BNP Paribas upgraded Boeing to Outperform from Underperform, and Citi added an “upside 30-day catalyst watch” on Applied Materials (AMAT). Goldman added AMAT shares to its U.S. Conviction List, where it also added Microsoft shares.
Tuesday: UBS added $5 to its Waste Management (WM) target, placing it at $270. A flurry of Palantir price target increases occurred, putting the majority of them between $200-$245. KeyBanc bumped up its Welltower target to $275 from $240.
Wednesday: Tigress Financial boosted its Microsoft target by $10 to $690. Goldman took its Arista Networks (ANET) target to $225 from $196, but Rosenblatt brought a much larger increase to $280 from $250. In the middle, was TD Cowen with its new $250 target for ANET. Morgan Stanley re-initiated coverage on TJX (TJX) with an Overweight rating and a $181 target.
Thursday: Barclays upped its Axon (AXON) price target to $688 from $523, while Piper Sandler took its target to $723 and Goldman lifts its to $715 from $535. Deutsche Bank bumped up its Costco (COST) target to $1,120 from $1,106. Citi increased its target for Arista Networks to $215 from $173. Tigress Financial boosted its Boeing target to $305 from $295. Barrington Research trimmed its Neostellar target to $16 from $18.
Key Global Economic Readings
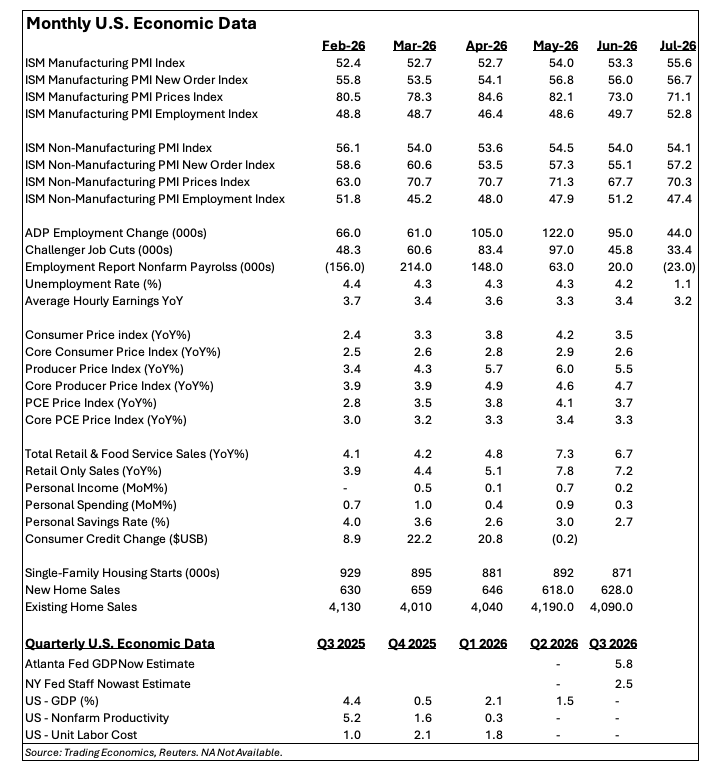
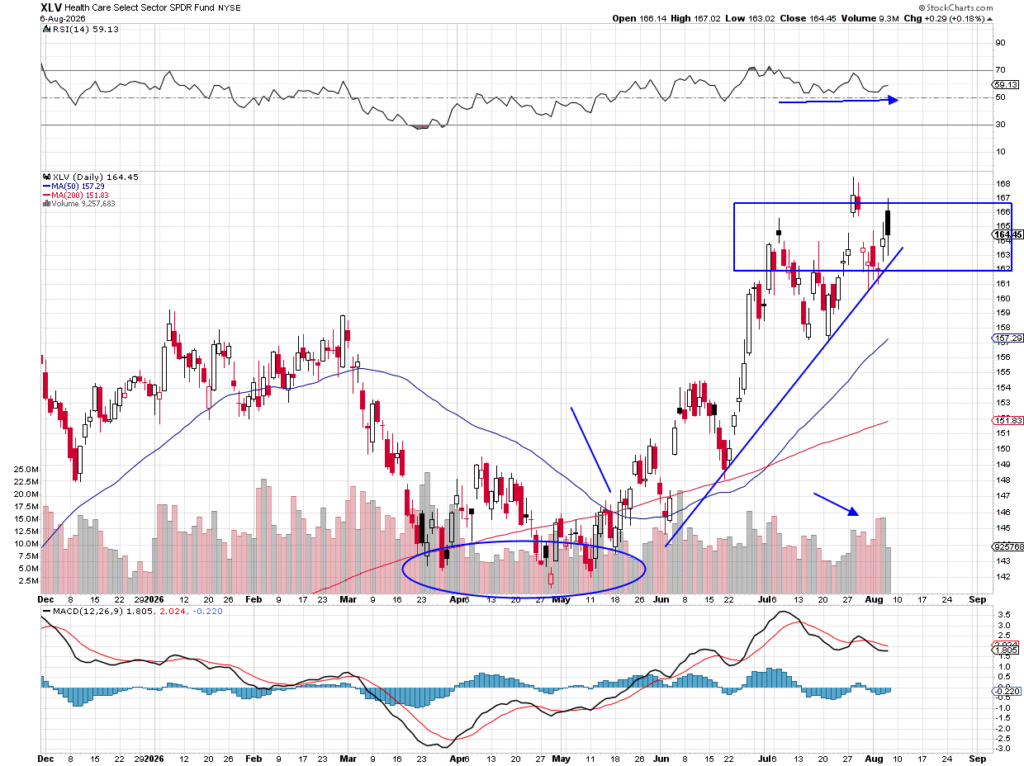
Chart of the Week: The State Street Health Care Select Sector SPDR ETF
As markets continue to move ahead and chase after new highs (already done in the S&P 500 and Industrials), we look around the neighborhood to find the reasons why they have been so resilient. One group that has been impressive is healthcare. We recently added the State Street Health Care Select Sector Fund (XLV) to the Pro Portfolio, so we wanted to look at the ETF to see if there was more upside in the short term. It appears so.
What names are driving the action in the XLV, which is up about 7% in 2026? Top of the list you will find Eli Lilly (LLY), Johnson & Johnson (JNJ), AbbVie (ABBV), Merck (MRK) and Amgen (AMGN), along with insurance name UnitedHealth Group (UNH). No surprise these stocks are up strong in 2026 and have been driving this ETF, representing 49% of the XLV.
XLV was one of the best performers from 2012-2015, a staggering run as it soared more than 100%. Not bad for a group with less beta (risk) than the market! However, this ETF this has lagged the S&P 500 for most of the past four years, so it is nice to see this leadership re-emerge.
The chart below is constructive, showing higher highs and higher lows since moving up and out from a bottom in late April. Once crossing the 200-day and 50-day moving averages, this ETF was on its way, having surged 14% since early May.
Recent action shows the XLV may be consolidating here, a sideways move for a brief time before the next move eventually happens — we believe that is higher. MACD going sideways here, the RSI at the top flattening out. Sideways is good to let the ETF catch its breath.
Other charts we shared with you this week were:
Monday, August 3: S&P 500 – History Says Down June/July Is Warning Sign. Is It?
Monday, August 3: Axon (AXON) – Axon Needs to Continue to Trend
Tuesday, August 4: Applied Materials (AMAT) – Time to Add to Applied Materials?
Wednesday, August 5: Palantir (PLTR) – Palantir Flips the Script
Thursday, August 6: Robo Global Robotics and Automation Index ETF (ROBO) – Perfect Timing on Our Robotics ETF
The Week Ahead
Following Friday’s far weaker-than-expected job creation found in the July Employment Report, the market’s expectation for a September rate hike flipped to the central bank likely to keep the Fed Funds rate unchanged following that next policy meeting. As we pointed out in our analysis of the jobs report, the negative July jobs print is but one figure, and as we’ve seen ample times in the past, the monthly figures are subject to revisions, sometimes big ones. We will also be getting more than a few additional pieces of data about the pace of job creation and inflation pressures before the Fed concludes its next policy meeting on September 16.
Next week brings the July CPI and PPI reports and, before we know it, the Flash August PMI data from S&P Global will be here on August 21. And yes, those figures are before Fed Chair Kevin Warsh delivers his Jackson Hole address later this month.
As we get ready for the July CPI and PPI figures, let’s review a few things. First, despite the rebound in the price of West Texas Intermediate Crude in the first three weeks of July, the abrupt decline toward the end of the month resulted in the average price for July falling to $80.46 per barrel from $84.81 in June. Data from the U.S. Energy Information Administration found the average gallon of regular gas dipped to $3.78 in July from $3.90 in June.
Granted, there are other inflationary pressures at work, including memory and other component costs, but the month-over-month decline in those energy prices suggest we are likely to see favorable sequential comparisons in the those upcoming inflation reports. If that’s what the data bear out, we are likely to see the market’s expectation increase for the Fed standing pat in September. In turn that would likely lift interest-rate sensitive areas of the market.
It goes without saying that we will need to be mindful of developments between the U.S. and Iran over the weekend and next week, and the impact on energy and petrochemical prices. On that front, and with supply chain-related issues, we will let the volume of traffic through the Strait of Hormuz drive our thinking.
Rounding out next week’s economic data is the July Retail Sales report. As we get ready for that report, which should once again confirm Costco (COST) winning consumer wallet share, let’s remember the timing of Amazon’s (AMZN) Prime Days between 2025 and 2026. This year, the shopping event was held in late June, while last year it was in early July, and along with other competing retailer shopping events, there’s a pretty good chance we see the July 2026 report impacted. Tempering our expectations for the July Retail Sales report was the slower pace of job creation in May, June, and July and the fall in July average hourly earnings.
Here’s a closer look at the economic data coming at us next week:
U.S.
Tuesday, August 11
ADP Employment Change Report (Weekly) – 8:15 AM ET
Existing Home Sales (July) – 10:00 AM ET
Total Household Debt (Q2 2026) – 11:00 AM ET
Wednesday, August 12
MBA Mortgage Applications Index (Weekly) – 7:00 AM ET
Consumer Price Index (July) – 8:30 AM ET
EIA Crude Oil Inventories (Weekly) – 10:30 AM ET
Thursday, August 13
Initial & Continuing Jobless Claims (Weekly) – 8:30 AM ET
Producer Price Index (July) – 8:30 AM ET
EIA Natural Gas Inventories (Weekly) – 10:30 AM ET
Friday, August 14
Retail Sales (July) – 8:30 AM ET
Business and Retail Inventories (June) – 10:00 AM ET
Michigan Consumer Sentiment Index (August) – 10:00 AM ET
International
Wednesday, August 12
China: Vehicle Sales (July)
Thursday, August 13
UK: Prelim GDP and Business Investment (Q2 2026)
UK: Industrial and Manufacturing Production (June)
Eurozone: Industrial Production (June)
Friday, August 14
Eurozone: GDP, Employment Change (Q2 2026)
We get a bit of a reprieve next week as the volume of quarterly earnings reports takes a breather before ramping back up with results from retailers Home Depot (HD), Lowe’s (LOW), Target (TGT), Walmart (WMT), and our own TJX Companies (TJX). Amid that slower pace next week, we do have quarterly results from Applied Materials (AMAT) on deck, and as we discussed on Friday, the prospects the company’s results and guidance skew favorable.
We’ll continue to mine for nuggets and other data points from companies that are reporting. Among the ones we’ll be sure to dig into are CoreWeave (CRWV), Lumentum (LITE), Super Micro Computer (SMCI), and Cerebras (CBRS). In those, we’ll be focused on comments on capex prospects, but also capacity constraints and power needs. We’ll also be listening for what Beazer Homes (BZH) says about the housing market, but following it agreeing to be acquired by Dream Finders Home (DFG) on Friday, management’s comments may be limited.
As we collect those insights, we’ll also be on the lookout for Boeing’s (BA) July deliveries and July sales at Taiwan Semiconductor (TSM). Boeing typically releases its monthly commercial orders and deliveries data between the 10th and 14th of the following month, which, if history holds, means sometime next week.
Here’s a closer look at the earnings reports coming at us next week:
Monday, August 10
Open: Barrick Mining (B), Ceva (CEVA), Monday.com (MNDY), Surgery Partners (SGRY)
Close: Beazer Homes (BZH), Hims & Hers (HIMS), Plug Power (PLUG), Rocket Lab (RKLB), Simon Properties (SPG)
Tuesday, August 11
Open: Smithfield Foods (SFD)
Close: B&G Foods (BGS), Cava (CAVA), CoreWeave (CRWV), Lumentum (LITE), Super Micro Computer (SMCI)
Wednesday, August 12
Close: Cerebras Systems (CBRS), Jack in the Box (JACK), StubHub (STUB)
Thursday, August 13
Open: Applied Industrial (AIT), Nomad Foods (NOMD), Tapestry (TPR), Yeti Holdings (YETI),
Close: Applied Materials (AMAT)
Friday, August 14
Open: Suncrete (RMIX).
Portfolio Investor Resource Guide
Economic Data: Here’s a List of Links to the Key Economic Data We Closely Watch
Investing Terminology: 16 Key Terms Club Members Should Know
10-Ks: Want to Know About a Stock? Read the Company’s Reports
10-Qs: Unlock the Numbers and Key Information Behind Your Stock With the 10-Q
Income Statement: Our Cheat Sheet to Understanding This Financial Document
Balance Sheet, Cash Flow Statements, and Dividends: How to Know If a Company Is Off-Kilter? Read Its Balance Sheet
Valuation Metrics: Everyone Wants a Value. Here’s How Investors Can Find
Thematic Investing 101 Webinar
Like the Benefits of ETFs? Let’s Talk About Models
The Portfolio Ratings System
1 – Buy Now (BN): Stocks that look compelling to buy right now.
2 – Stockpile (SP): Positions we would add to on pullbacks or a successful test of technical support levels.
3 – Holding Pattern (HP): Stocks we are holding as we wait for a fresh catalyst to make our next move.
4 – Sell (S): Positions we intend to exit.