Charting the Markets: Poor Weekly Closes Become a Pattern
Several uncertainties ahead are driving volatility in the S&P 500.
You've reached your free article limit
You've read 0 of 1 free Pro articles.
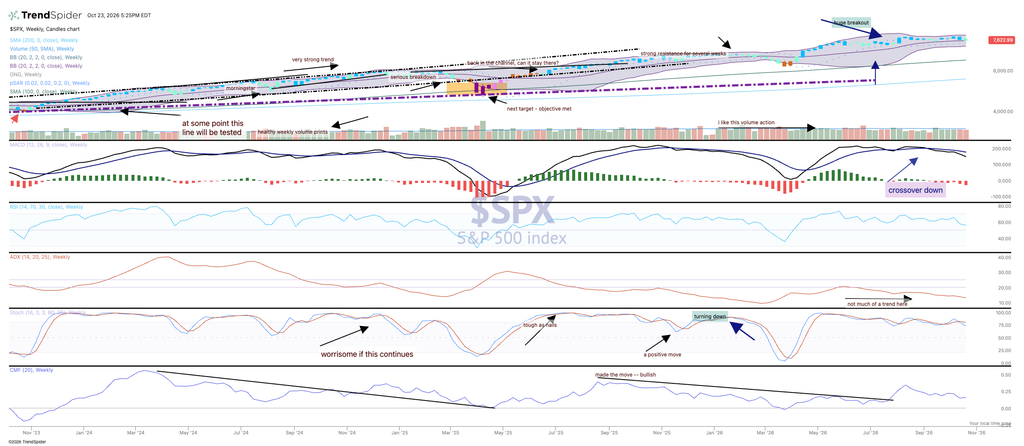
The bullishness remains in tact for the S&P 500 but just barely. Notice in the top right of the chart below, the candles flipped from blue to teal, that means a cautiously bullish stance on the GoNoGo composite of indicators. But as we have mentioned prior, the MACD remains on a sell signal that looks even worse over the past few weeks, symbolizing the difficulty for the index to advance further. Money flows remain positive but have also been dropping off recently, momentum is heading downward but volatility remains elevated (not shown).
The chart shows elevated volume on the recent down weeks, that is bearish.
One of the big reasons for the recent rise in volatility is due to several uncertainties on the near horizon, including a Fed meeting coming this week, a slew of earnings releases and the midterm elections on November 3, which may sway political opinion and policy towards the left.
In addition, the rise in oil has been pushing inflation higher, and that spells trouble for markets. Bond prices are having difficulty rising though we did see a nice push up recently. There is just so much left to be settled here and with markets not far off new highs it seems the best scenario for the bulls is a certain future, but that is not always a given.
More Pro Portfolio
- Adding to 2 Holdings After Earnings, PMI Updates
- Tracking 49 Signals Across 11 Portfolio Investment Themes
- Weekly Roundup: Renewed AI Concerns Weigh on the Market and Portfolio
At the time of publication, Lang had no position in any security mentioned.