Chart of the Day: Is Costco Finding a Low?
The big retailer may be basing here before making its next move.
You've reached your free article limit
You've read 0 of 1 free Pro articles.
Costco (COST) shares failed to break out in late May and are working their way toward making a bottom. It has been difficult to stay with this stock through recent down moves. The channel is active, showing a downtrend of lower highs and lower lows.
The chart shows mostly purple and pink candles, implying a bearish condition. However, we could make a case for the indicators being washed out, meaning they are bottoming just as it appears the price may be doing so as well.
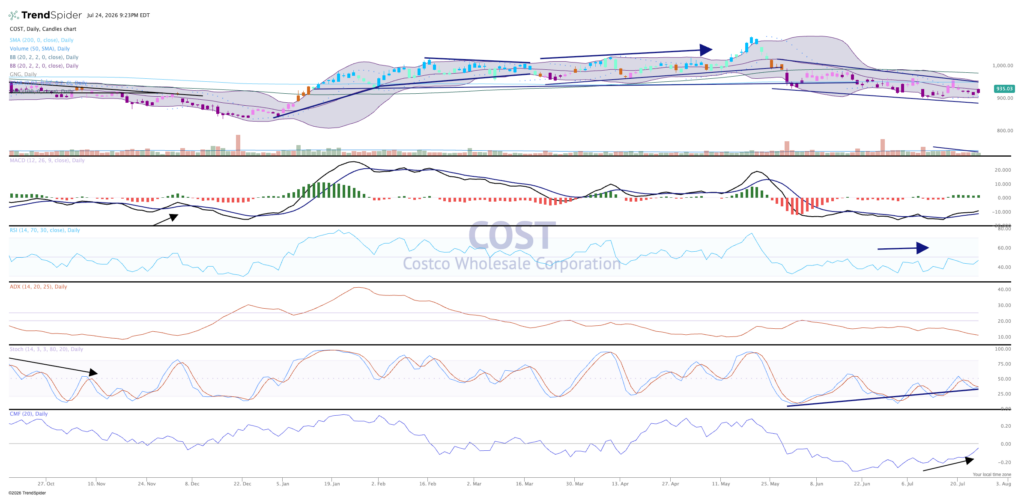
Money flow is negative but turning up, while stochastics (momentum) remains weak. The parabolic SAR (stop and reverse system) in the top pane is back to bullish, and the MACD is also flashing a buy signal here.
While we cannot yet classify the chart as bullish, it is showing some green shoots.
Some good numbers from other retailers might have the effect of “pin action” for Costco, and a move above resistance at $990-$1,000 would very bullish.
We like Costco in TheStreet Pro Portfolio and rate it a One, or “buy at anytime.”
More Pro Portfolio:
- Exiting This Healthcare Name Amid Surge
- 29 Signals We’re Tracking Across 11 Portfolio Strategies
- Weekly Roundup: When Earnings, Rates, and Oil Collide
At the time of publication, TheStreet Pro Portfolio was long COST.
