Chart of the Day: A Close Look at Bank of America as Earnings Approach
The stock is showing strong leadership with Q2 results out next week.
You've reached your free article limit
You've read 0 of 1 free Pro articles.
The banks and financials continue to perform well even if some of the higher beta (risky) names are not. We often see a strong performance relationship between the two (higher beta, banks) and that tends to drive market direction. When the banks and higher beta are weak the rest of the market tends to follow. Lately the financials have shown some outstanding relative strength but the high beta names have lagged. We’ll see if that divergence lasts for longer.
But back to the financials and specifically Bank of America (BAC), which just reached a milestone on July 6, an all-time high on good volume. This tells us big money continues to buy this stock even at lofty levels, but perhaps the stock is actually cheapest in the group. No question the new high is notable for other banks such as Citigroup (C), JPMorgan Chase (JPM), Goldman Sachs (GS) and Wells Fargo (WFC).
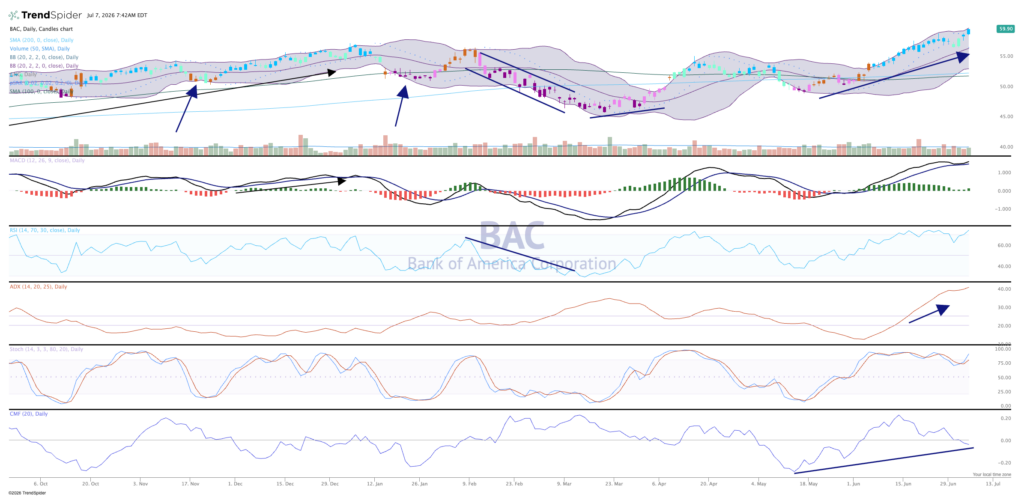
The chart of BAC is extremely bullish. MACD is on a strong buy signal and extended. Relative strength at the top is overbought, but that is just a condition and not a signal, so no need to sell here.
Money flow could be better but we’ll give the stock the benefit of the doubt. The ADX (pane 4) is peaking at 40, telling us the trend is extraordinarily strong here, and we know it is bullish. Stochastics pulled back last week but is on a buy signal.
As mentioned, earnings out next week could be a catalyst to move the stocks.
We like Bank of America in TheStreet Pro Portfolio and rate it a One, or “buy at anytime.”
More Pro Portfolio:
- It’s Time to Lock in Big Gains on This Holding
- 30 Signals Across the Portfolio’s 10 Themes and Strategies
- June Monthly Roundup: The Market Stumbled in June. The Portfolio Didn’t.
At the time of publication, TheStreet Pro Portfolio was long BAC.
