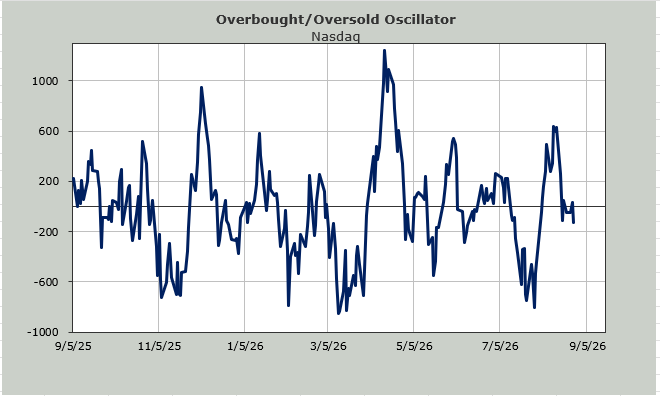
With the Nasdaq Nearing Oversold, Let’s Check the Intermediate-Term Indicators
Readers have asked about the intermediate-term indicators. They’re not saying much yet, but that might change as Nasdaq nears oversold.
You've reached your free article limit
You've read 0 of 1 free Pro articles.

I was asked the other day about the intermediate-term indicators. I have not written much about them since they got overbought back in mid-May. There is a reason.
The Volume Indicator sits at 50%. What are we supposed to do with an indicator that doesn’t get overbought or oversold? It has been at 50% for nearly a month now.
The Hi-Lo Indicator sits at .50. I would harp away that I’m not sure how you can say the market is broadening out when the Hi-Lo Indicator sits at .50, and the new highs haven’t expanded in months. But here too, not much to say about an indicator that sits at .50.
The 30-day moving average of the advance/decline line sits right at the zero line. I am not joking. You can see the overbought condition in mid-May; we got a correction off of it, but ever since that June rally in the Russell that took it to 3000, the indicator has been drooping with no oomph.
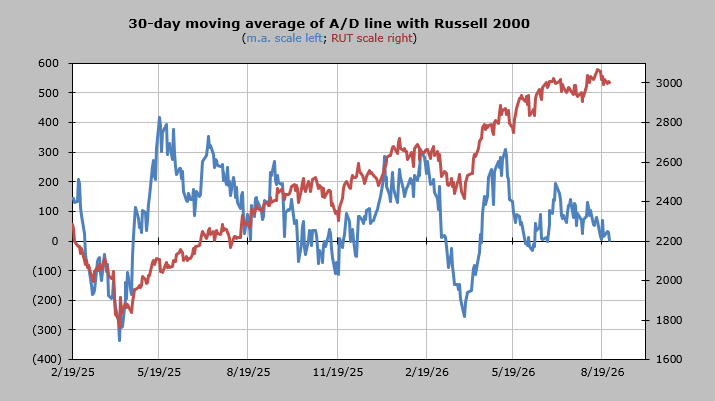
In fact, do you realize the Russell tagged 3000 in late June and is at 3000 now? That’s two months of nothing. Or as someone else pointed out to me, the QQQs are the same place they were in late May. For that matter, so is the SOX.
I would say not much phases stocks these days. Not the move in interest rates. Not the move in energy either. And not the so-called ‘clearing event’ in the semis in July. Nor did the great earnings move the market all that much.
And for the last seven trading days, both the S&P and Nasdaq have alternated up and down days. It’s been terrible if you are a trend trader.
I had expected the others to have a tough month of August, and I have been wrong. Typically, when the McClellan Summation Index goes down, as it has, we see the others go down as well.
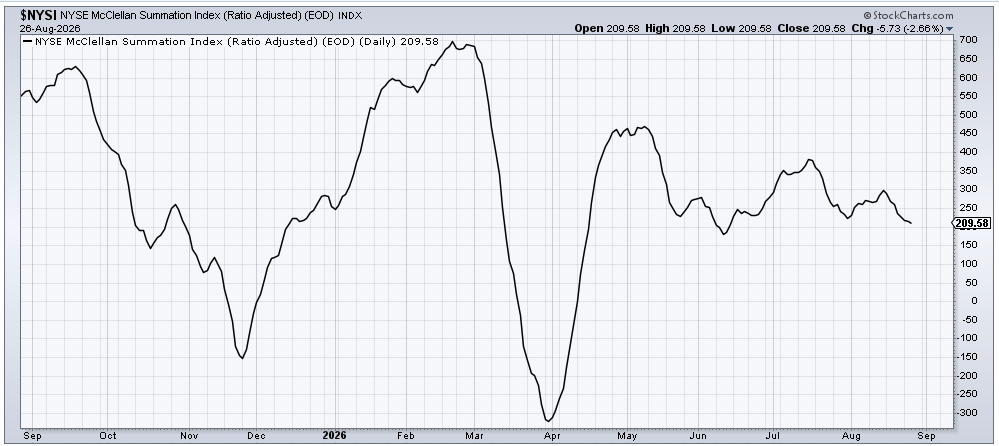
Someone will surely ask if we are basing or are we topping. The answer is that unless/until we see the index charts make lower lows, we are simply sideways. Sentiment got giddy two weeks ago, and so the market backed off and sat there. Even the Daily Sentiment Index on the VIX is still 15!
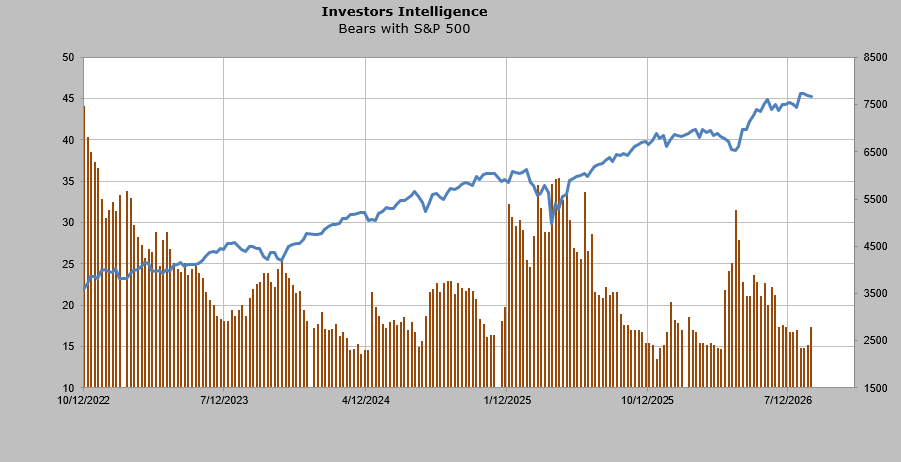
I had thought the Investors Intelligence bulls and bears would get extreme, but as soon as they knocked on the door of giddy (the bull/bear ratio got to 3.88—over 4.0 is too much), the market pulled back, and so did the bull/bear ratio, since it now sits at 3.0.
I saw the bears tick up this week and thought, okay, that could be a positive, and then I saw all they did was get back to where they were in early July. The market is a chop-fest. Perhaps the upcoming short-term oversold condition in Nasdaq will change that.