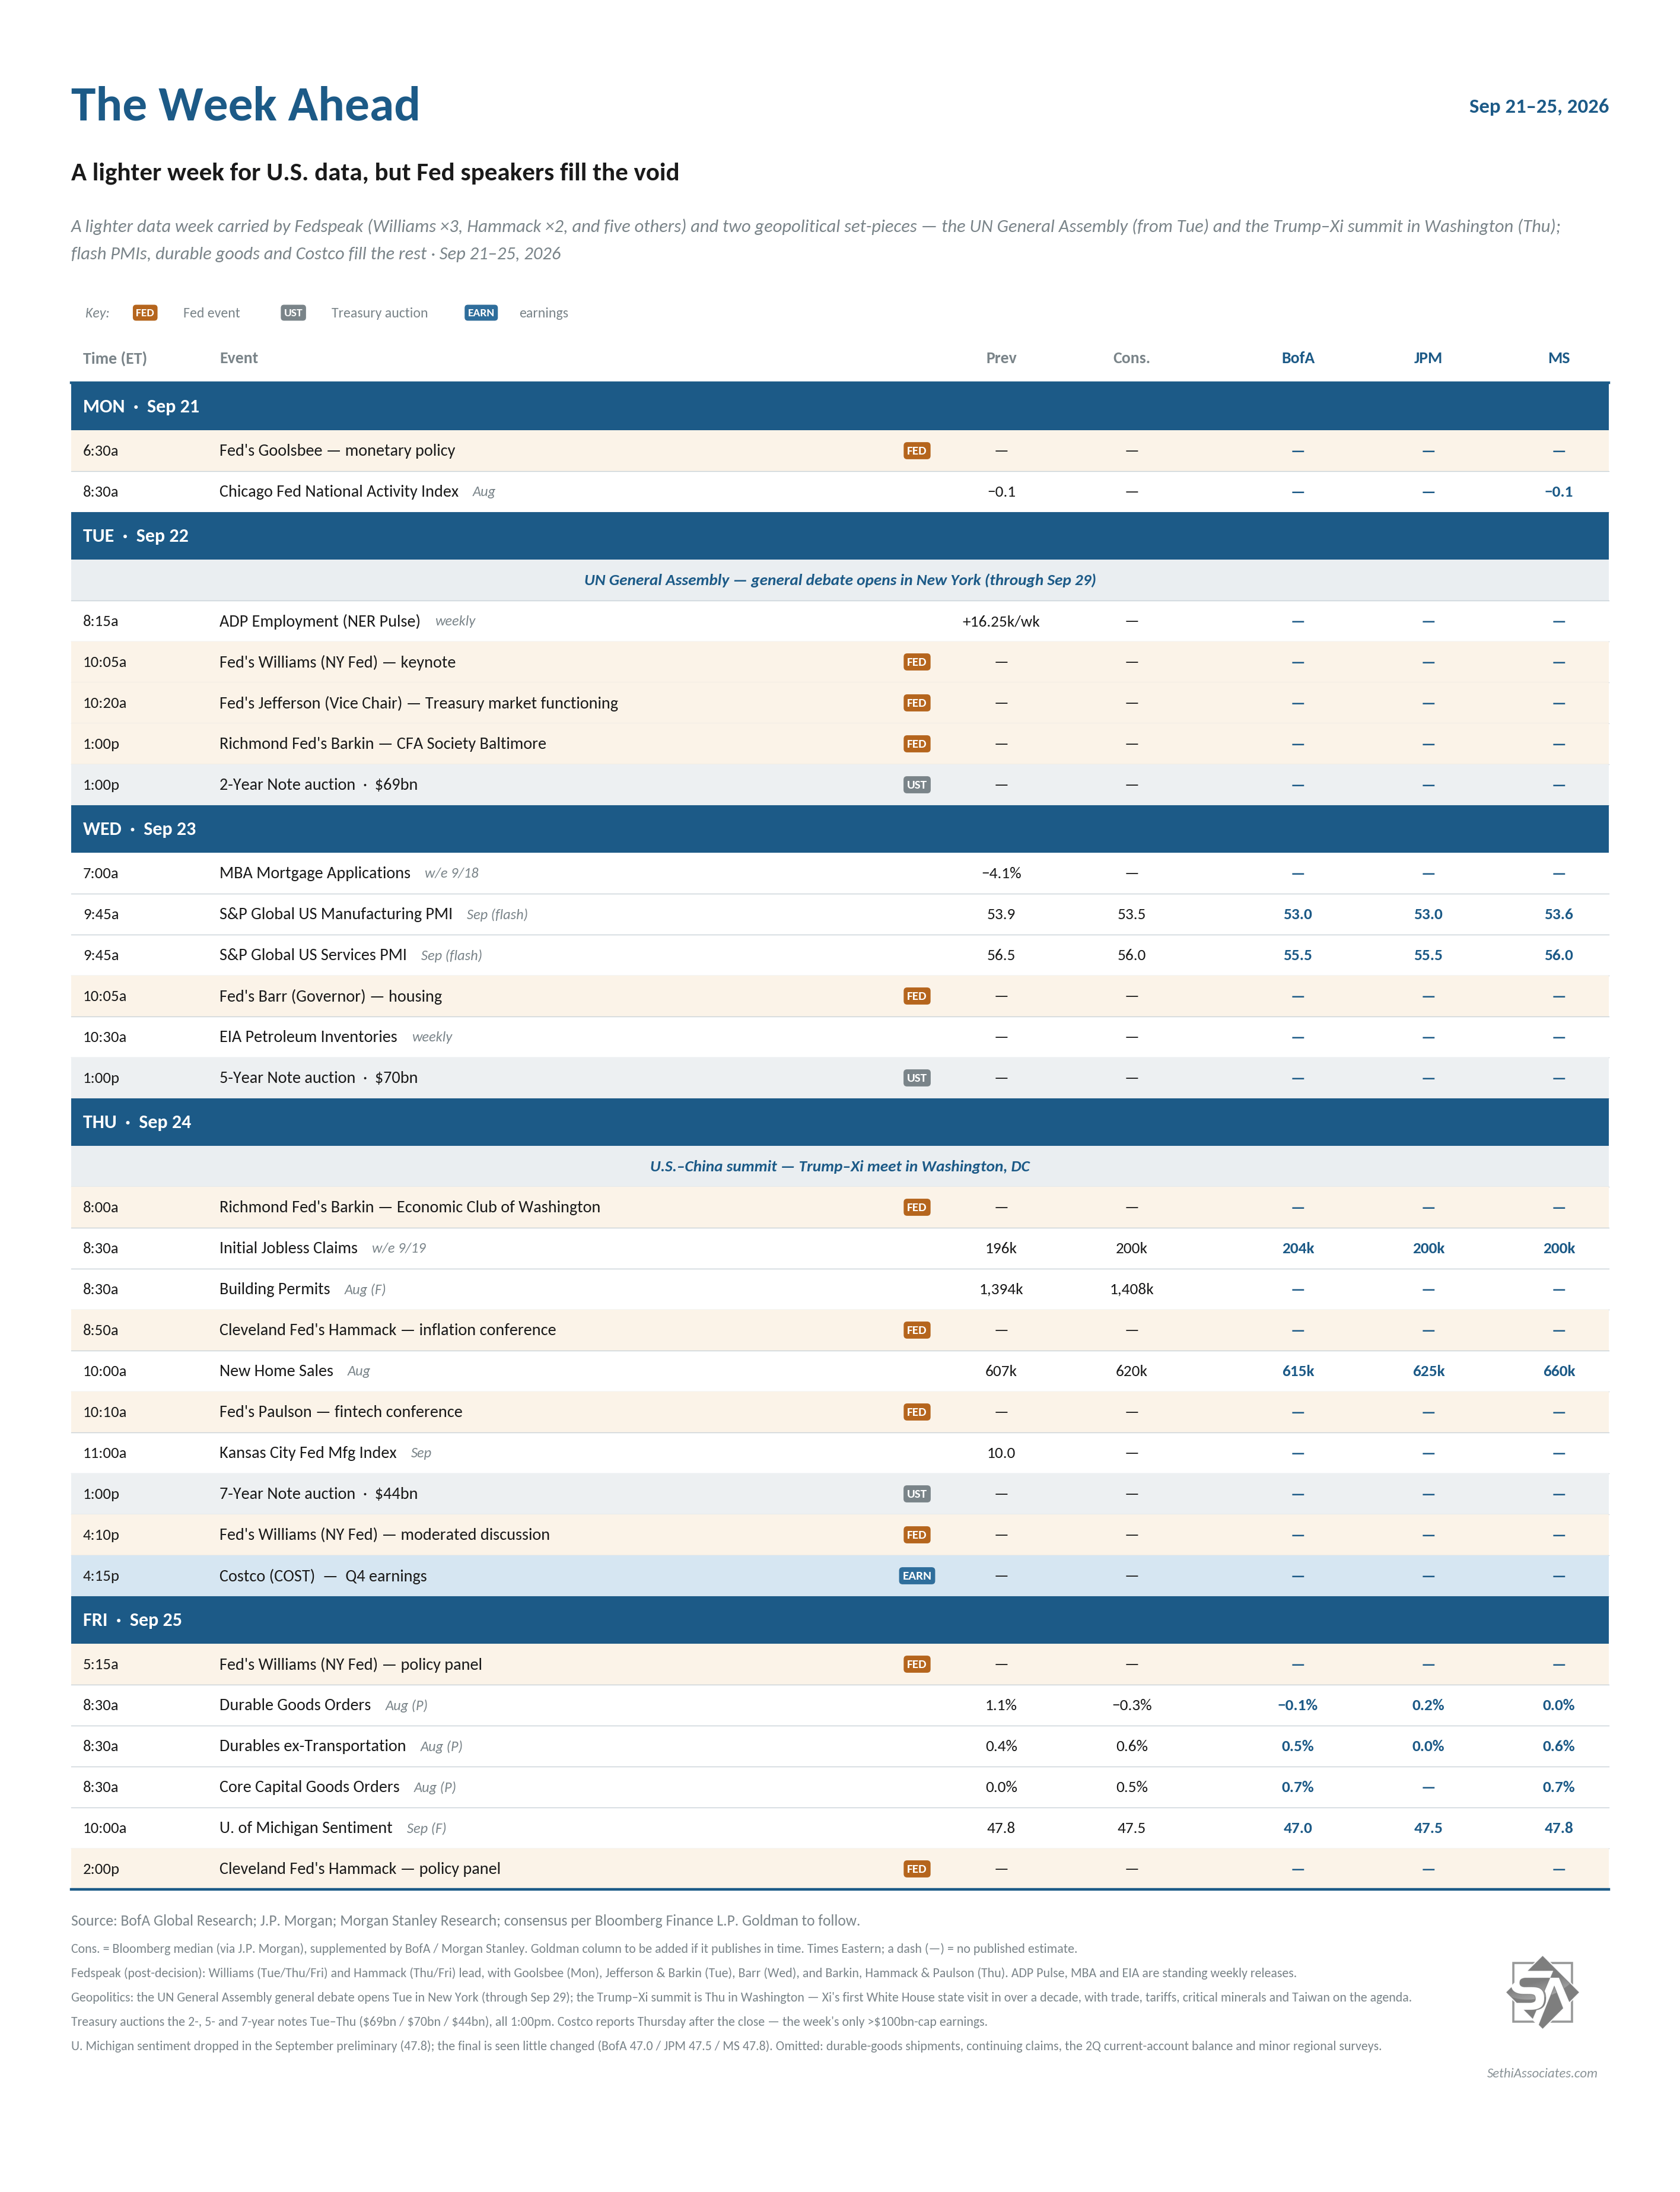
US economic data is fairly light next week with just the September flash PMIs and UMich final consumer sentiment survey, August new home sales and durable goods (lasting >3 years) reports, some more regional Fed PMIs plus the normal weekly reports (ADP, unemployment claims, etc.).
The Fed speaking blackout is over, and here they come. Currently on the calendar we have Vice-Chair Jefferson, Governor Barr, and Fed Presidents Goolsbee, Williams (3x), Barkin (2x), Hammack (2x), and Paulson, and there are always more.
Non-Bill (>1yr in maturity) USTreasury auctionspick up some with 2, 5, and 7-year offerings Tuesday, Wednesday, and Thursday respectively.
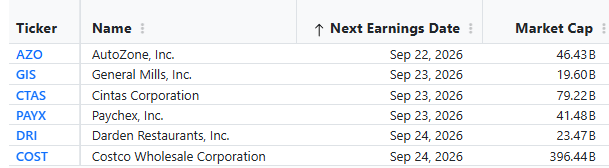
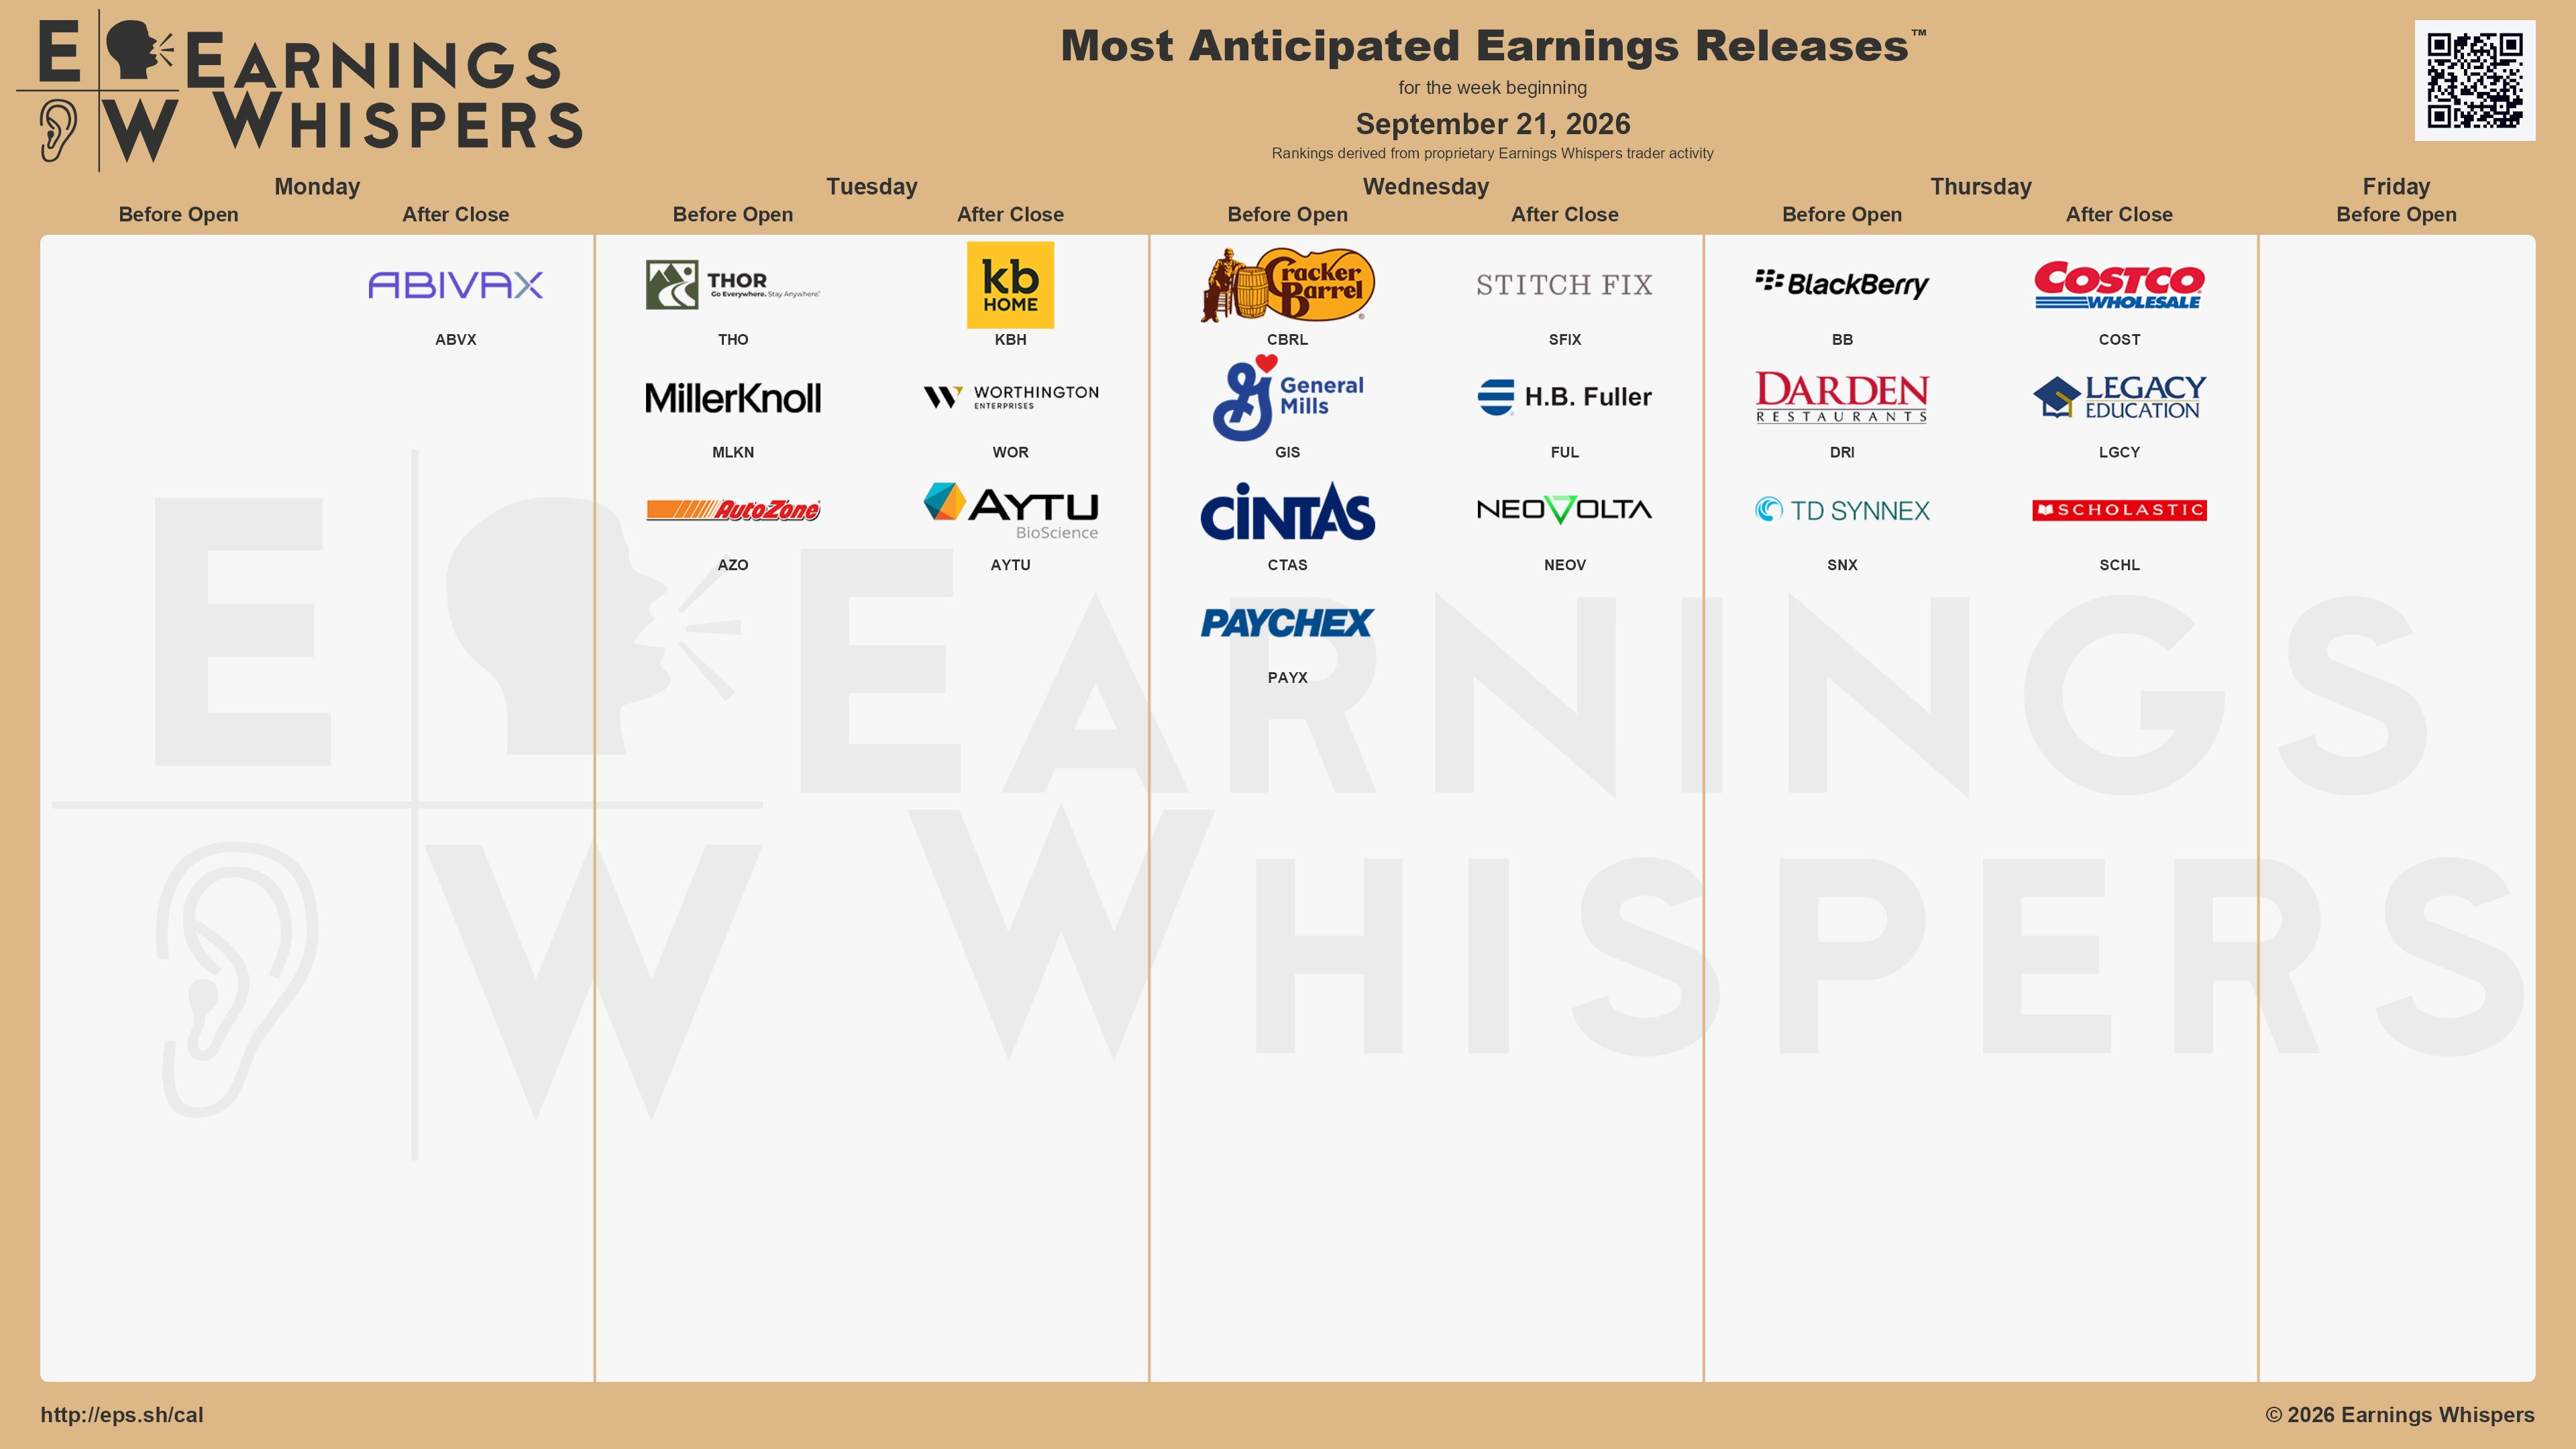
We are now in the weird middle ground between Q2 and Q3 earnings. Next week we’ll get six SPX components reporting headlined by Costco (COST) the only one greater than $100 billion in market cap. The others are AutoZone (AZO), General Mills (GIS), Cintas (CTAS), Paychex (PAYX), and Darden Restaurants (DRI). Meta Platforms (META) will hold its two-day Connect event beginning Wednesday, with updates expected on AI, AI-powered glasses and virtual and mixed reality, and McDonald’s (MCD) holds an investor day Wednesday. Link to TheFly’s Event Calendar.
Focus will also be on the meeting between Presidents Trump and Xi on Thursday, while the UN General Assembly’s general debate begins in New York Tuesday.
WallStreetNumbers
Ex-US highlights from Deutsche Bank:
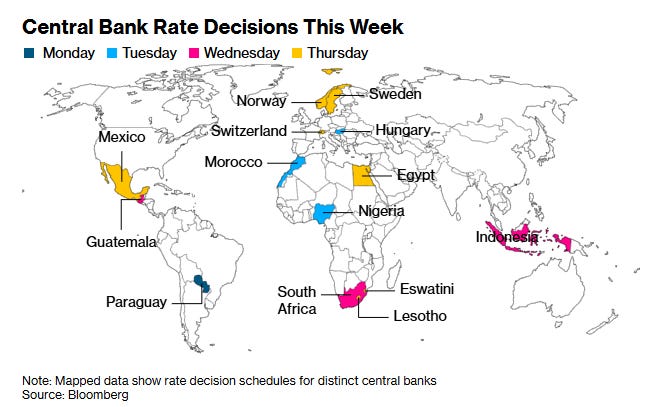
The global September flash PMIs will be the main data highlight next week. Central-bank decisions are due in Norway, Sweden, and Switzerland on Thursday.
In Europe, aside from the September PMIs, sentiment indicators include Germany’s Ifo survey and French business confidence on Thursday. Consumer-confidence measures are due for the Eurozone on Tuesday, France on Thursday, and Germany and the UK on Friday. In Germany, state elections in Berlin and Mecklenburg-Vorpommern take place this Sunday.
In Asia, China’s one-year and five-year loan prime rates are due Monday, while Australia’s labor-force survey is due Thursday.
And a link to Christophe Barraud’s international Week Ahead rundown.
Note: I have moved the Fed section up under the economy.
This post will go through in order (in case you want to skip around): the economy, the Fed and interest rates, earnings, valuations, breadth, positioning, sentiment, seasonality, and then my Wrap-Up.
Economy Continues to Chug Along
Looking first at the economy, my intro has remained the same since the start of the Iran conflict (and longer term, more or less all of the past five years): “we continue to see it weathering the various storms remarkably well due in large part to resilient consumption (boosted by huge increases in wealth over the past few years despite slowing incomes) and AI-spending… with data of late showing a stable (and perhaps accelerating) economy, but one that is also boosting inflation.”
As noted previously, while things tailed off in July into the start of August, the past six weeks have seeneconomic momentum rebound outside of the housing sector (which remains sluggish).
That was confirmed by Fed Chair Warsh this week: “Our decision comes at a time when the American economy appears to be strengthening. New hiring, private-sector earnings, business capital investment—each of these markers has improved in recent months and is pointing in a good direction.”
And last week’s data was broadly consistent with that story with one important discrepancy. Arguably our most economically significant report given consumer spending historically represents around two-thirds of US economic growth was retail sales (with the caveat that it covers just ~35% of consumer spending). That was unambiguously strong no matter how you slice it.
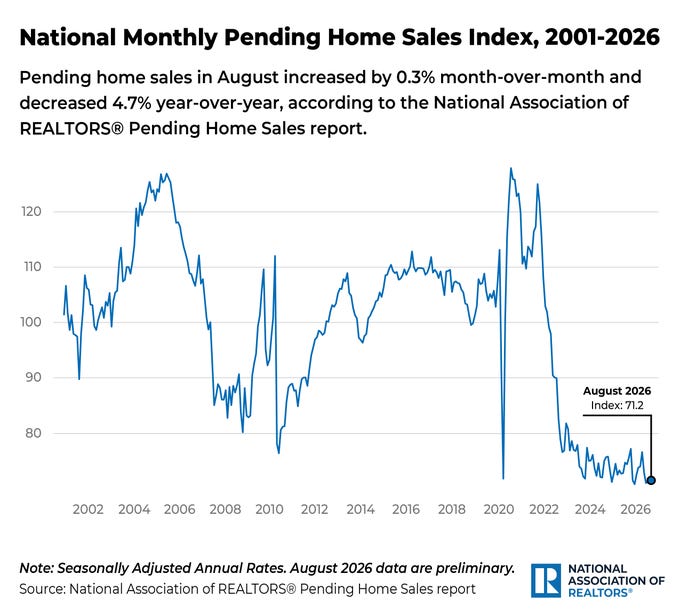
And our high-frequency employment metrics were positive with the ADP weekly job growth figure continuing its rebound as jobless claims remained very (very) subdued historically. While the housing market remained weak with pending home sales (contract signings for existing homes) coming in below forecasts at a pace near record lows (chart), although we did see single-family housing starts hit the strongest pace since March which along with positive revisions to July saw upgrades to Q3 GDP forecasts even as total starts fell sharply on multifamily weakness (single-family construction is unit-for-unit much more economically impactful than multifamily).
The important caveat was in manufacturing, which in August fell for the first time this year (and the most since October), as several areas that had provided boosts, such as space exploration and AI-related production, saw rare declines. Headline industrial production (out most wholistic look at the sector) was saved from a negative print only by a jump in electricity production.
Overall though for now no reason to change my outlook at this point. As I mentioned three weeks ago “with the recent strength it seems that we’re back in green light territory, and one or two rate hikes (or 5% Treasury yields) won’t change that.”
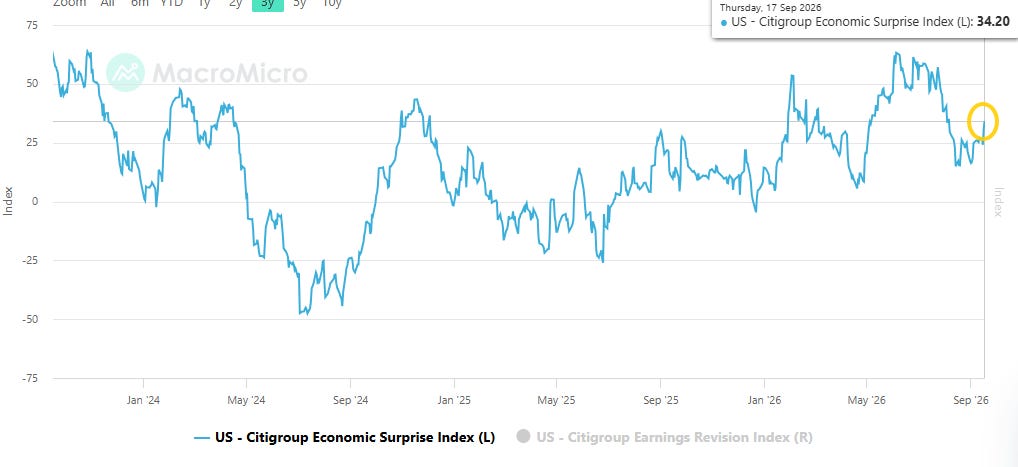
And the Citi economic surprise index as of Thursday rose to 34.2, the best since the end of July (when it was falling from 57.1 on July 24th), from 27.0.
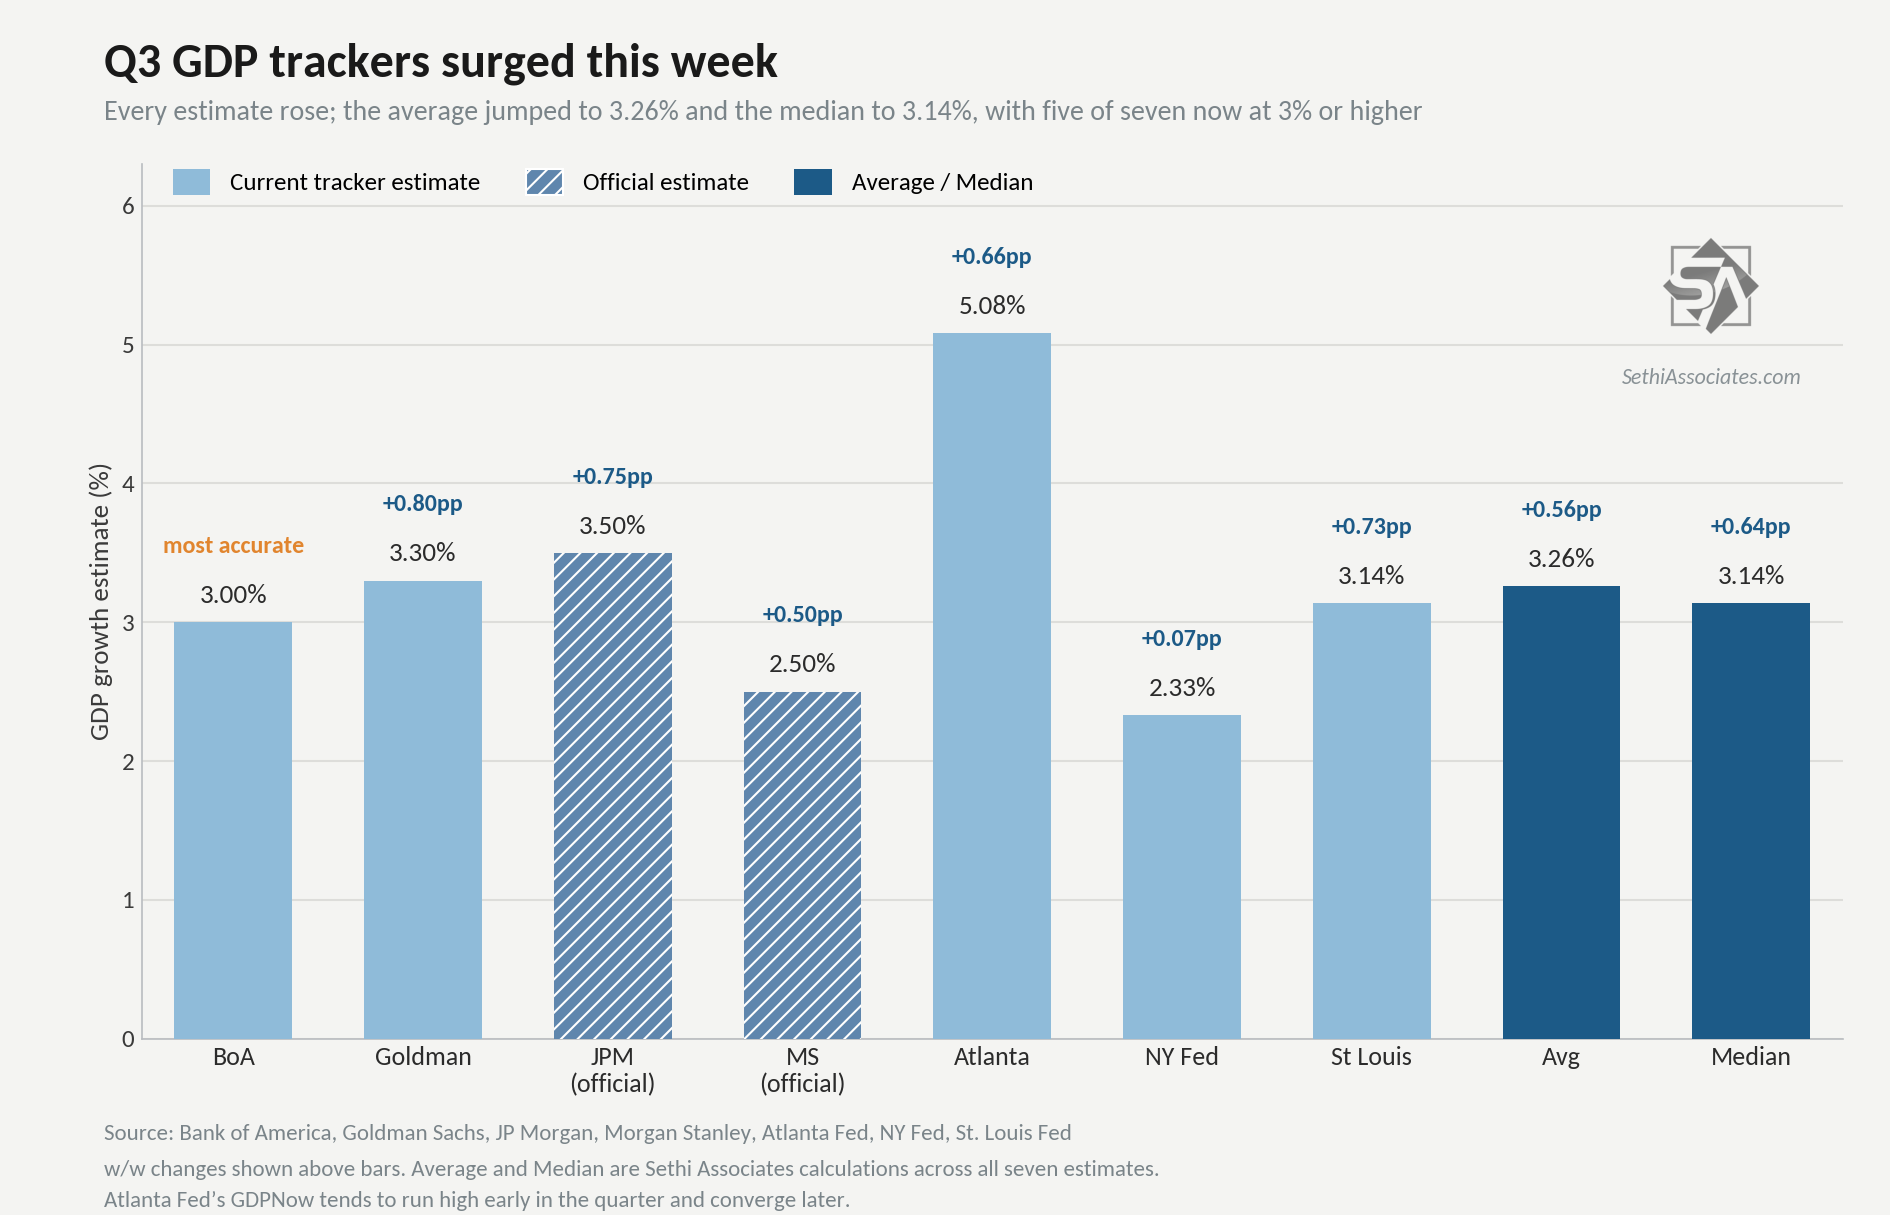
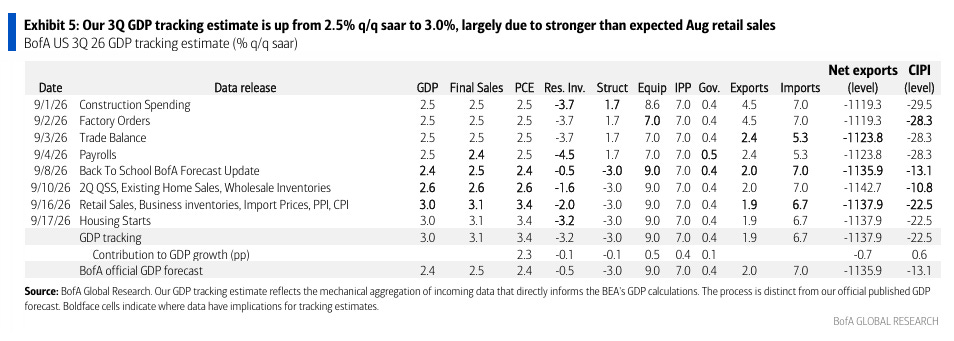
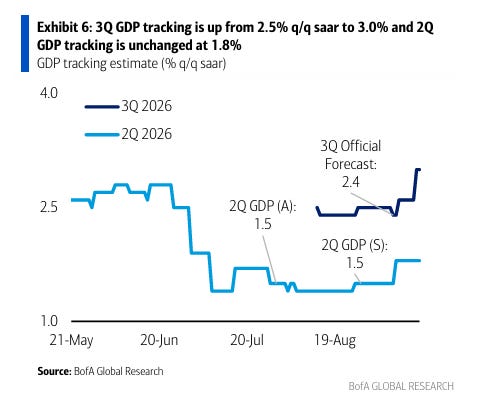
Meanwhile Q3 GDP estimates outside of the Atlanta Fed (who as a reminderhas been very high right up until the end of each of the past two quarters before falling sharply towards the other trackers and now sports a 5-handle) which had all clustered in the 2.0-2.75% range, by and large (the NY Fed the outlier) jumped in large part on that retail sales report now averaging a robust +3.26%.
BofA (who has been the most accurate over the past year) +3.0% (from +2.6% the prior week). Goldman +3.3% (from +2.5%) JPM +3.5% (+2.75%)Morgan Stanley +2.5% (+2.0%) Atlanta Fed +5.08% (from +4.42%) NY Fed +2.33% (+2.26%) St Louis Fed +3.14% (+2.41%) Avg = +3.26% (from +2.71%) Median = +3.14% (from +2.50%)
BofA:
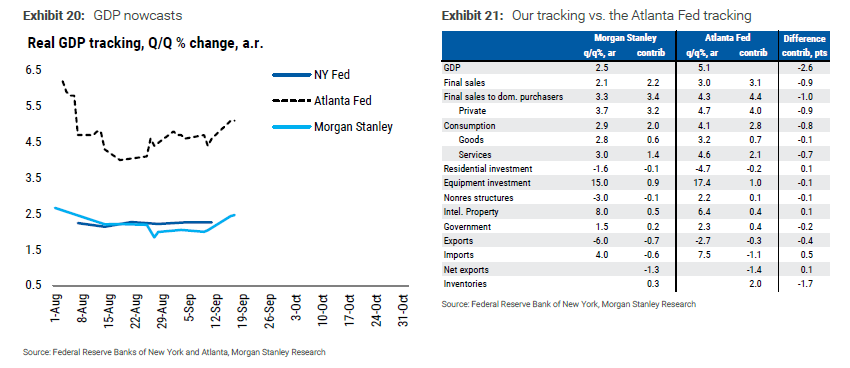
Here was MS on their GDP change and continued discrepancy with the Atlanta Fed:
For a second consecutive quarter, demand appears to be running ahead of output. While we estimate third-quarter GDP growth at a 2.5% quarter-over-quarter annualized rate, we estimate private final domestic purchases (PDFP) will rise at a 3.7% pace, supported by another quarter of strong business investment and 2.9% consumption growth. In the second quarter, GDP rose 1.5%, while PDFP increased 4.2%.
The Atlanta Fed’s GDP estimate rose from 4.7% to 5.1%. Its stronger forecast primarily reflects two components. First, it estimates services consumption growth at 4.6%, 1.5 percentage points above our forecast, contributing an additional 0.7 percentage point to GDP growth. Second, the Atlanta Fed estimates that inventories will add 2.0 percentage points to third-quarter growth, 1.7 percentage points more than our estimate.
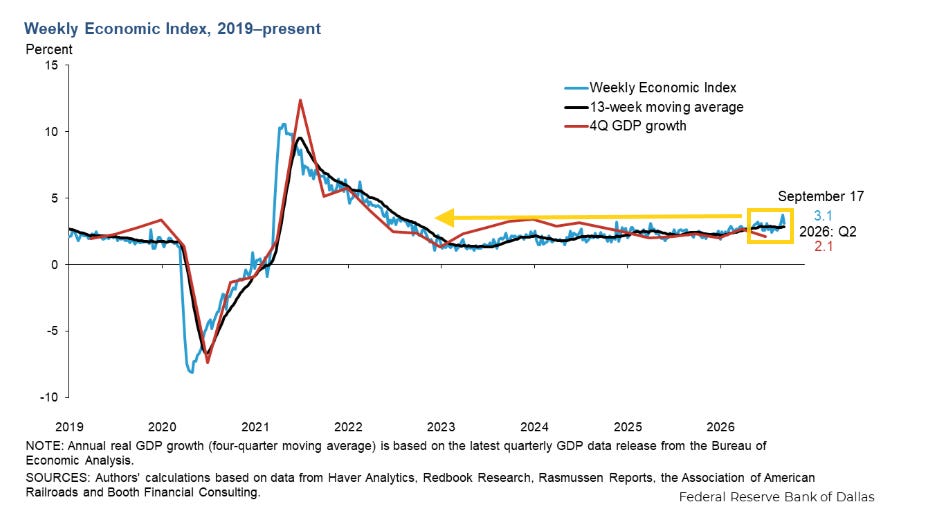
And as you know if you’re a regular reader, one of my favorite GDP trackers is theWeekly Economic Indexfrom the Dallas Fed.*
In the week through September 12th (so doesn’t have last week’s data) eased back to +3.07%, from +3.73% which was the best since August 2022, but remaining over 3% for a third week something it hasn’t done since 2022 as well.
The 13-week average accelerated to 2.83%, just a little under the 2.87% on July 24th which was also the best since 2022, continuing to evidence economic momentum that is above trend.
*The WEI is scaled as a y/y rise for real GDP(so different than most GDP trackers which are Q/Q SAAR) and uses 10 daily and weekly economic series but runs a week behind other GDP trackers.
It has over time had one of the highest correlations with actual GDP of any tracker(see chart)although for Q2 it came in highpredicting +2.80% y/y GDP growth vs the actual first estimate of +2.10%, while for Q1 it predicted +2.48% vs 2.66%. More importantly, it has consistently indicated no recession and relatively healthy growth since the pandemic (which is what we’ve experienced).
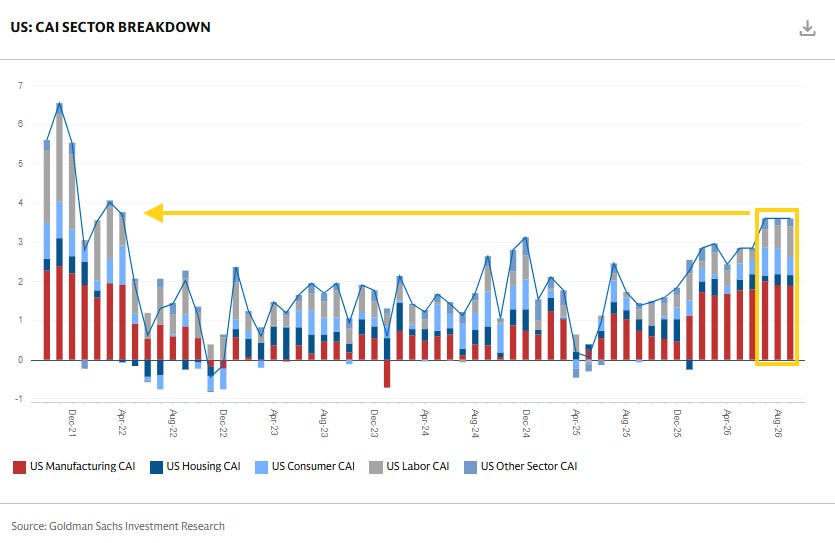
While Goldman unveiled their September US Current Activity Indicator* at +3.6% which remains (along with an also upgraded August and July) the joint-best since April 2022. That continues the strongest 9-month period since then as well, as the manufacturing component is getting more help from other sectors, although still represents 1.9% of that 3.6% reading.
*The CAI is their “real-time measure of inflation-adjusted economic momentum using 37 inputs.”
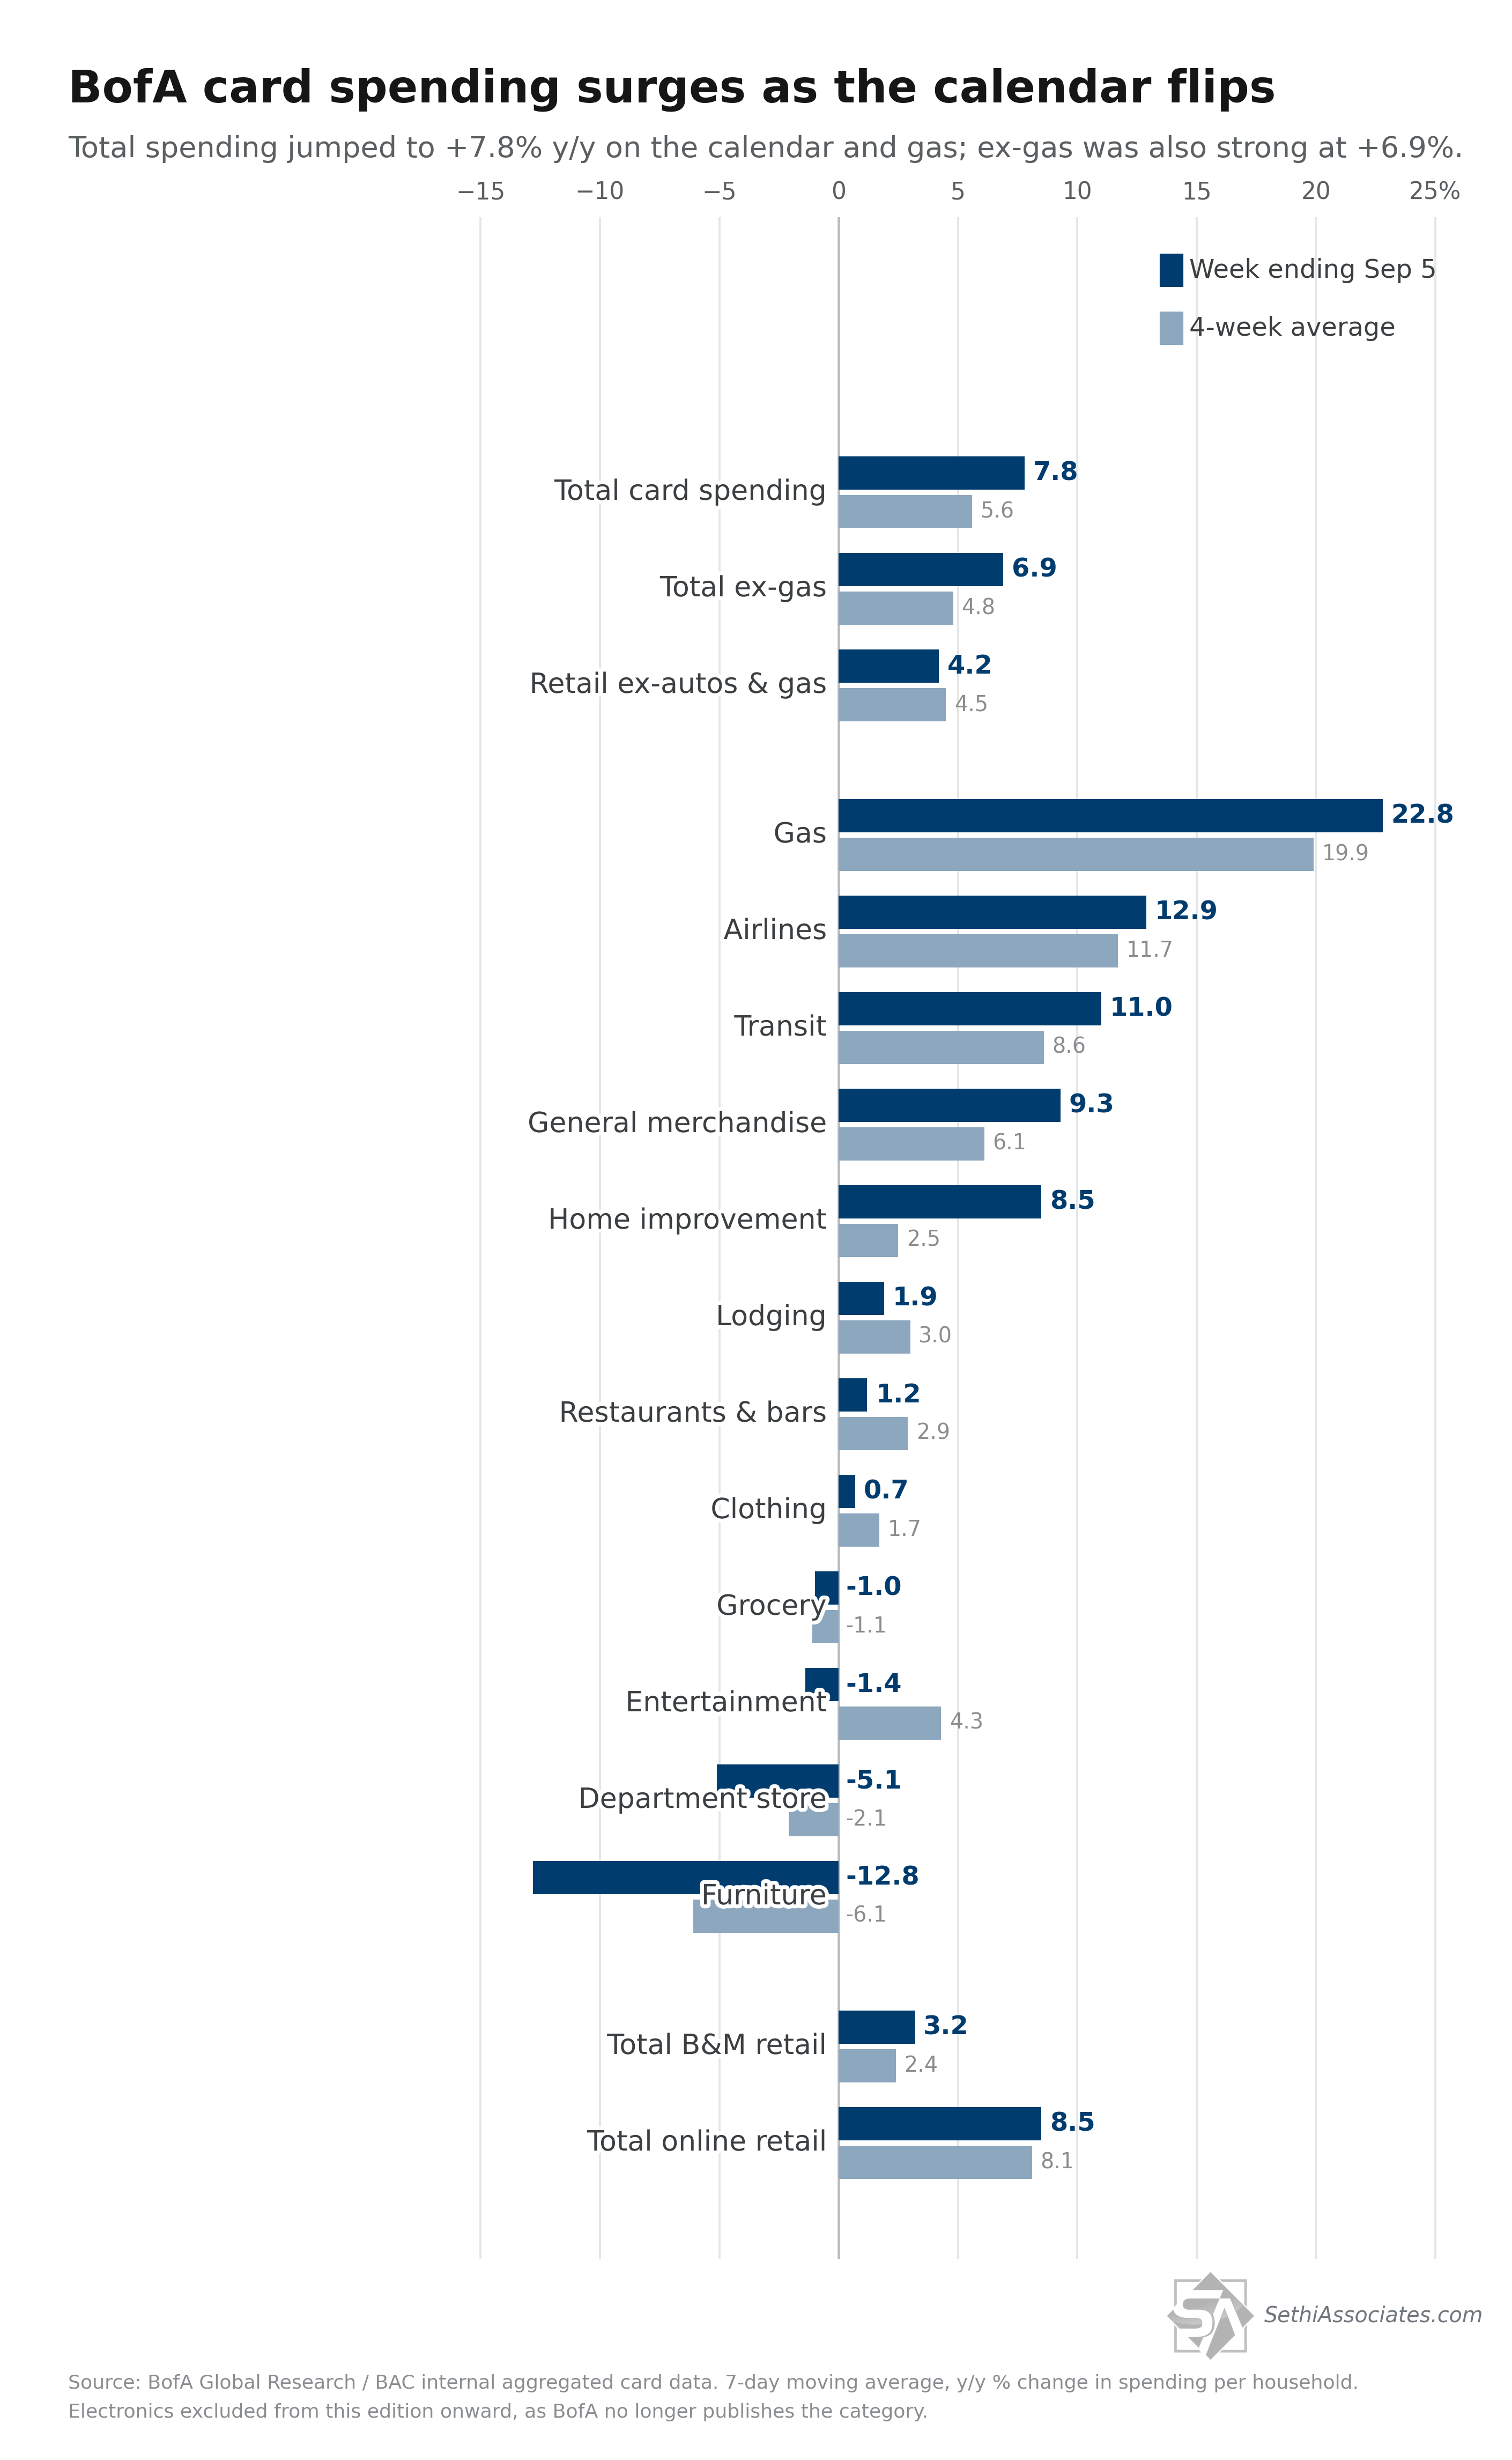
And according to BofA card spending (credit+debit) consumer spending remains robust as we head into September up +5.8% versus the year-ago period (y/y) in the week ending September 12th. The dominant story was a dramatic positive reversal in Labor-Day-sale-categories — the mirror of last week — as Labor Day fell on September 7 this year (versus September 1 in 2025). That boosted Labor Day sale sensitive categories in the reference week while the year-ago comparison week had none, sending department stores to +57.3% (from −5.1%) and furniture to +26.5% (from −12.8%).
Ex-autos and gasoline +7.8% (+5.0% four-week moving average)
Gasoline stayed elevated at +21.2% y/y (from +22.8%), with pump prices still well above a year earlier.
Importantly, though, beneath the Labor-Day-driven category swings, BofA’s read on the aggregate was simply that “spending remains steady in early Sep.” The firm also continued to push back on the “K-shaped” consumer narrative saying it “increasingly looks like a stale narrative” with higher- and lower-income ex-gas spending growth running roughly in line again this week.
Turning to the rest of the category breakdown, clothing (+14.2%, up sharply) saw a jump, while lodging (+10.1%), airlines (+9.3%) and restaurants & bars (+8.7%) were all firmly positive. Online retail rose to +9.9%.
Home improvement was the lone decliner y/y, falling to −5.7% — perhaps itself a timing artifact working the other way.
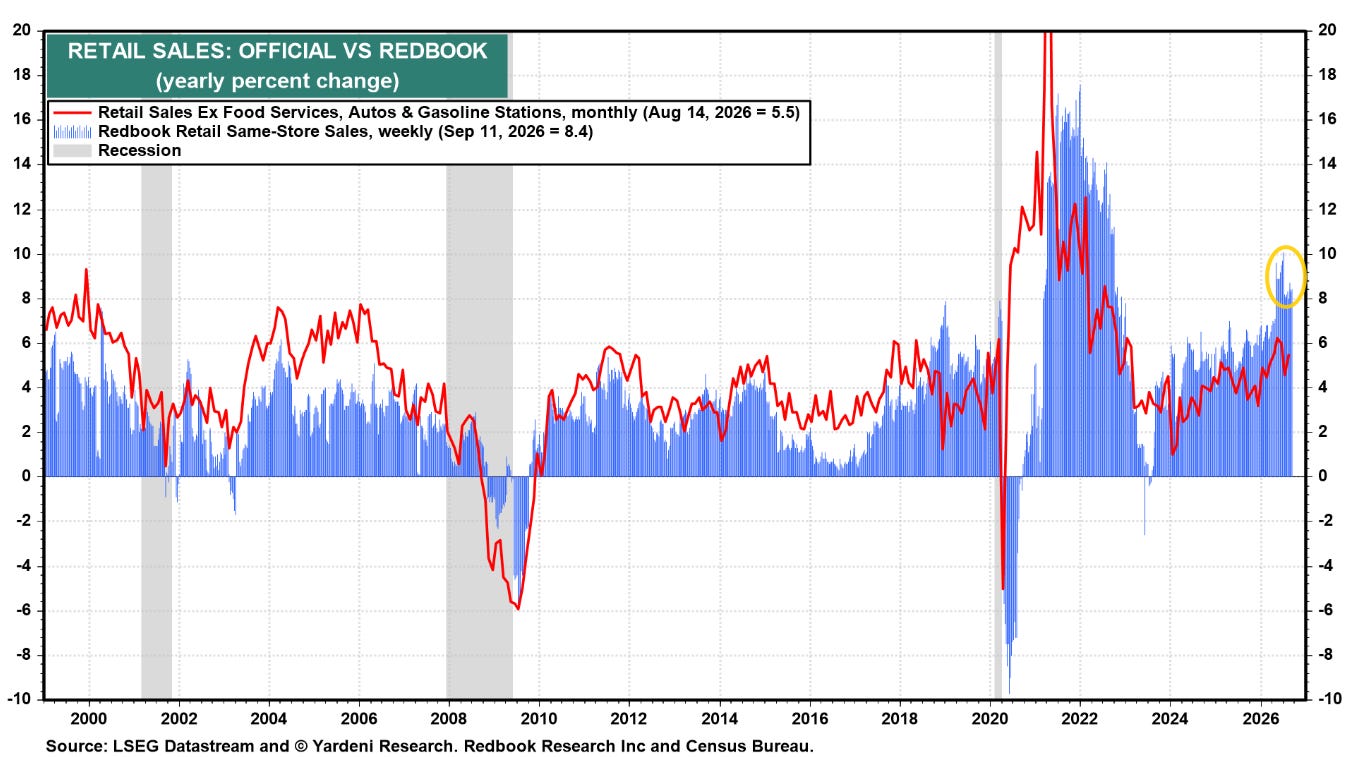
Redbook sales*similarlyaccelerated to 8.5% y/y growth the week of September 11th, well above the 2025 average of 5.8% y/y.
*Redbook sales are same-store sales across a panel of large general-merchandise retailers, such as department stores, discount chains, apparel retailers, drugstores, and warehouse clubs.
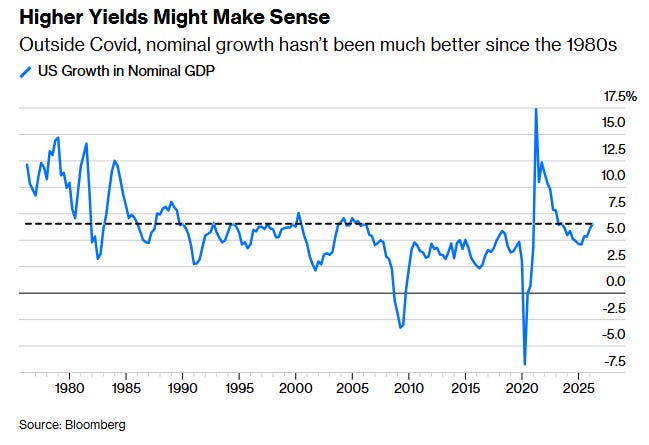
From John Authers:
And I promised this week a deeper dive into AI’s economic impact but with all the other material I’m going to hold off on that for a lighter week.
The Strong Economy Pushes the Fed to Hike
Turning to interest rates and the Fed, I had mentioned last week that:
with the core CPI print coming in above that 0.25%, along with the unfavorable read-through discussed in theCPI breakdown, markets have now priced a September hike at a near certainty of 90%. As I mentioned in the Friday evening update, “Don’t see how the Fed doesn’t hike next week absent some sort of media tip that they are planning on not going.” … So absent a shock hold, as mentioned at the top, attention will quickly turn to the updated Summary of Economic Projections (SEP), which will have a new dot plot that will tell us a lot about the Fed’s thinking about the path of policy going forward based on where the dots are aligned for 2026 (and to some extent 2027 and 2028 but those will be less useful given the Fed’s horrendous forecasting record).
Do the hawks convince the doves that more than one hike is needed this year as the base case? Does Warsh care enough about the SEP (which he didn’t even submit a dot for in July) to jawbone members into a no further hikes median dot (given I’d imagine he doesn’t really want to hike again given what will likely be very uncomfortable public pressure from the administration)? A lot of questions around where that median dot lands. And we’ll also get updates to expectations on inflation, unemployment, and GDP.
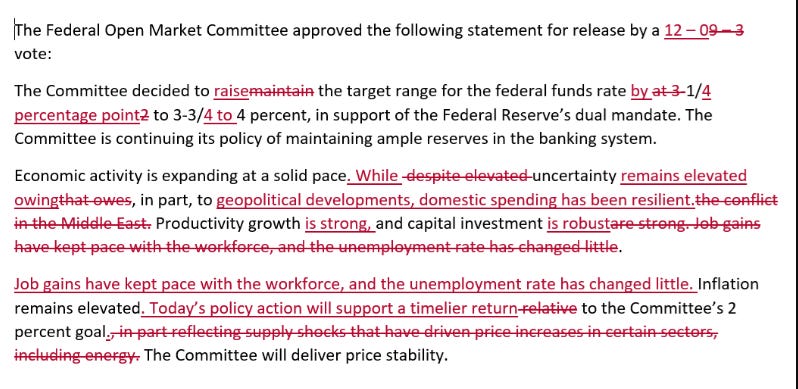
And so it was no surprise that they did hike, but what was a surprise as noted in the Wednesday update was the answers to the rest of the questions:
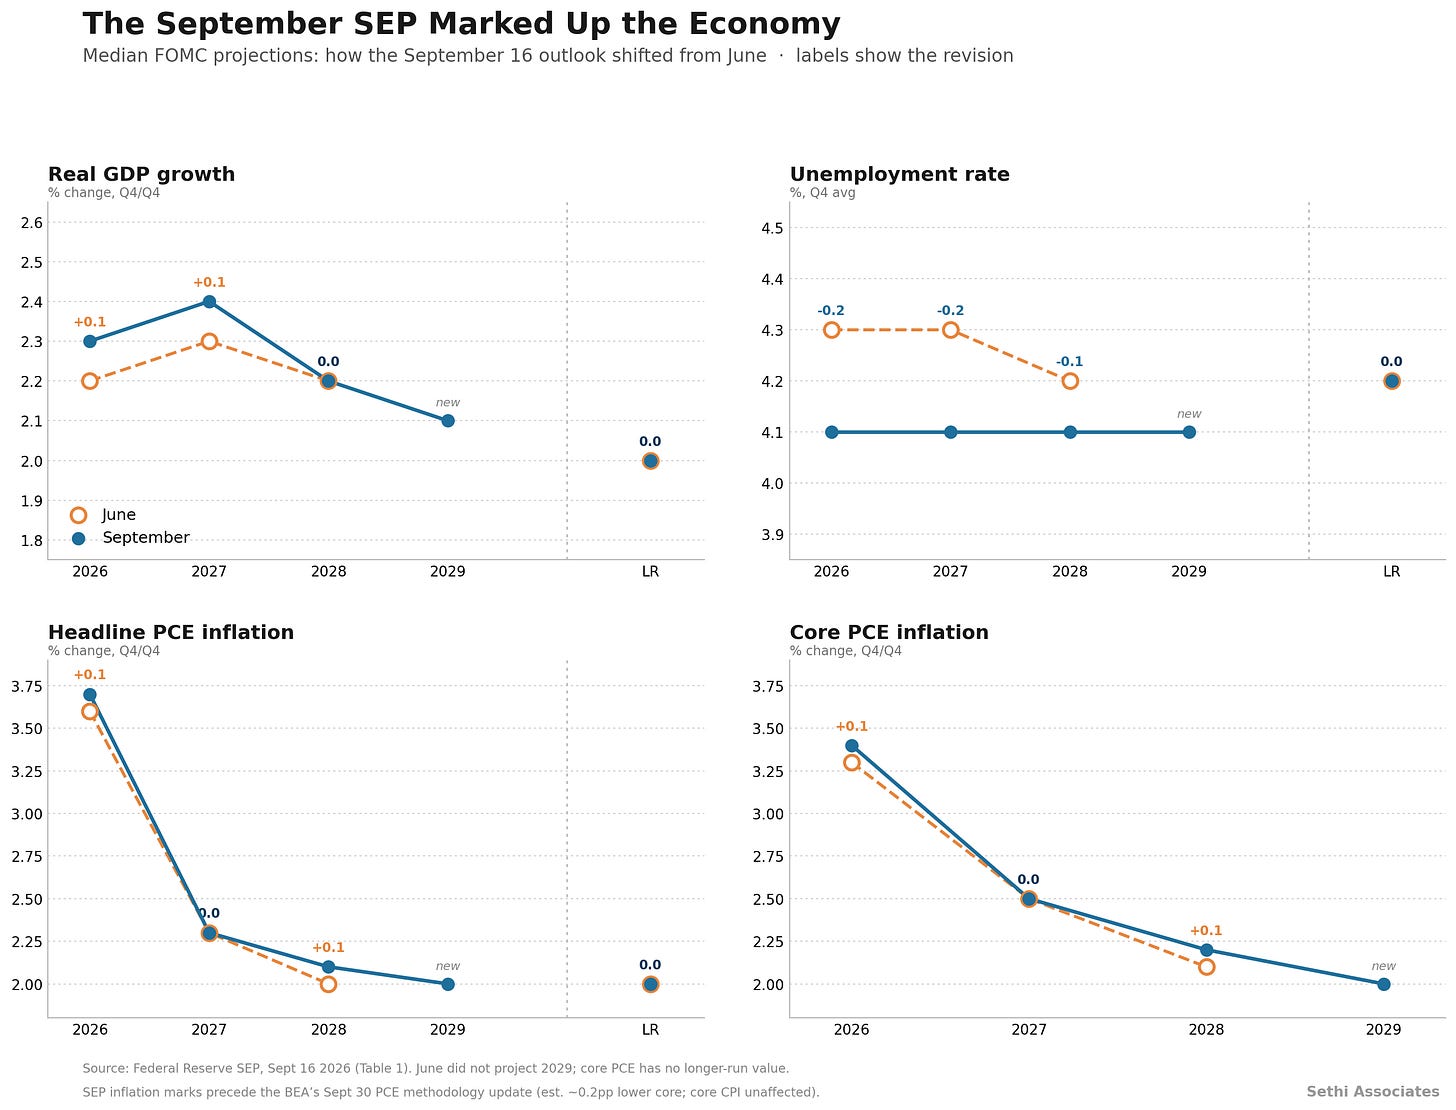
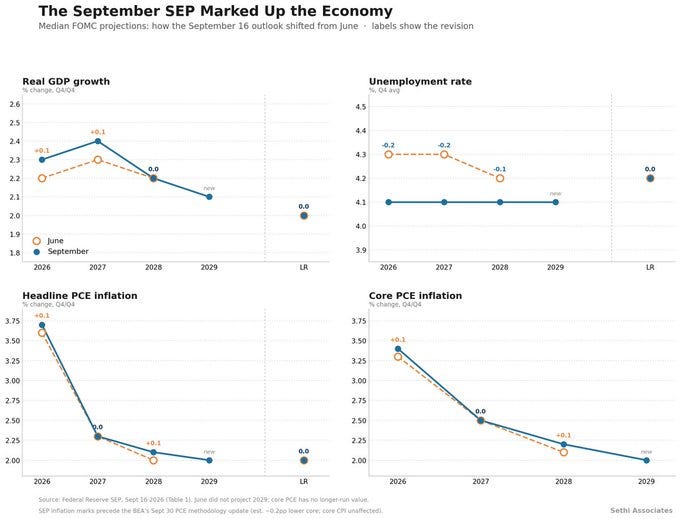
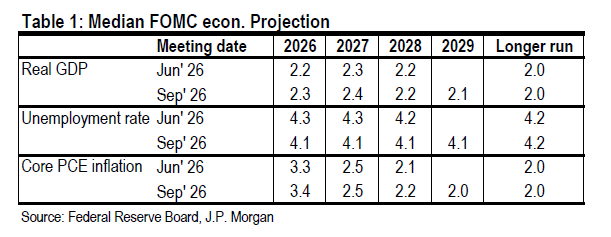
Estimates for the economy were upgraded as were those for inflation.
On the former (economy) the newly truncated statement stuffed in no less than five references to a solid economy: “resilient spending,” “strong productivity,” “robust capital investment,” “job gains have kept pace,” and “unemployment has changed little.”
The Summary of Economic Projections (SEP) similarly saw estimates for GDP rise and unemployment fall. On inflation, estimates for core PCE rose. Chair Warsh as noted at the top summed it up: “Inflation is too high and has been for too long,” Warsh said in his opening remarks. “Our decision comes at a time when the American economy appears to be strengthening.”
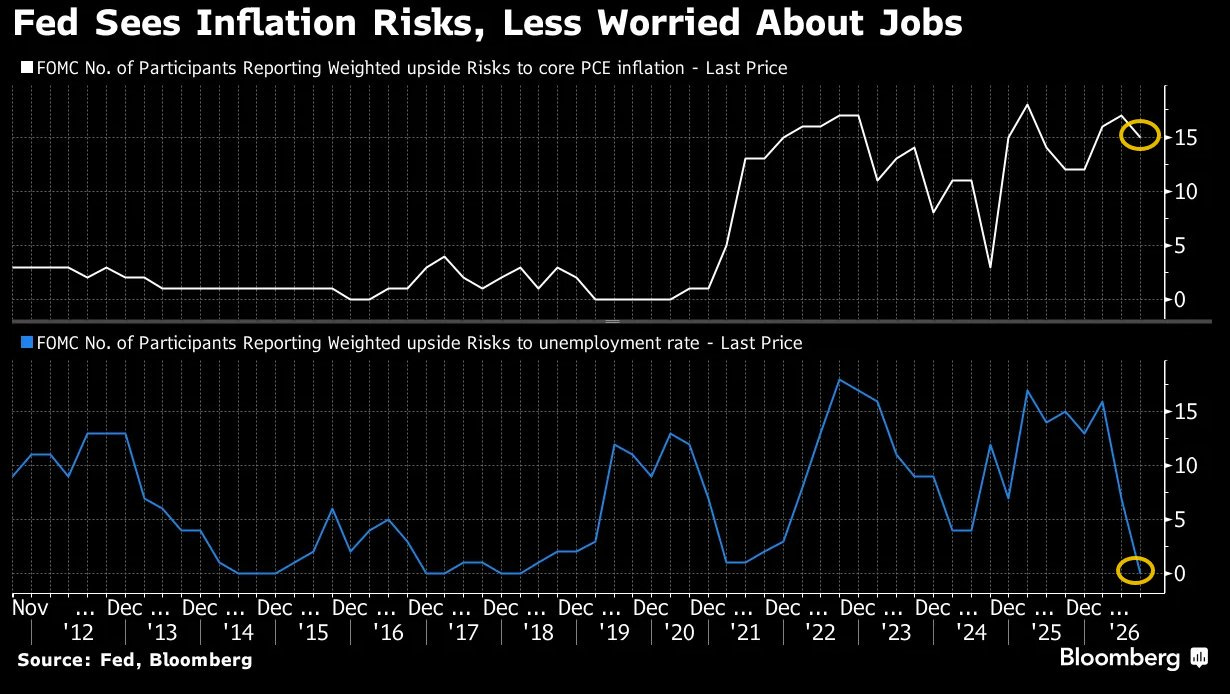
BBG noted that not a single Fed member sees upside risk to the unemployment rate while 15 of 18 see upside risk to core PCE inflation.
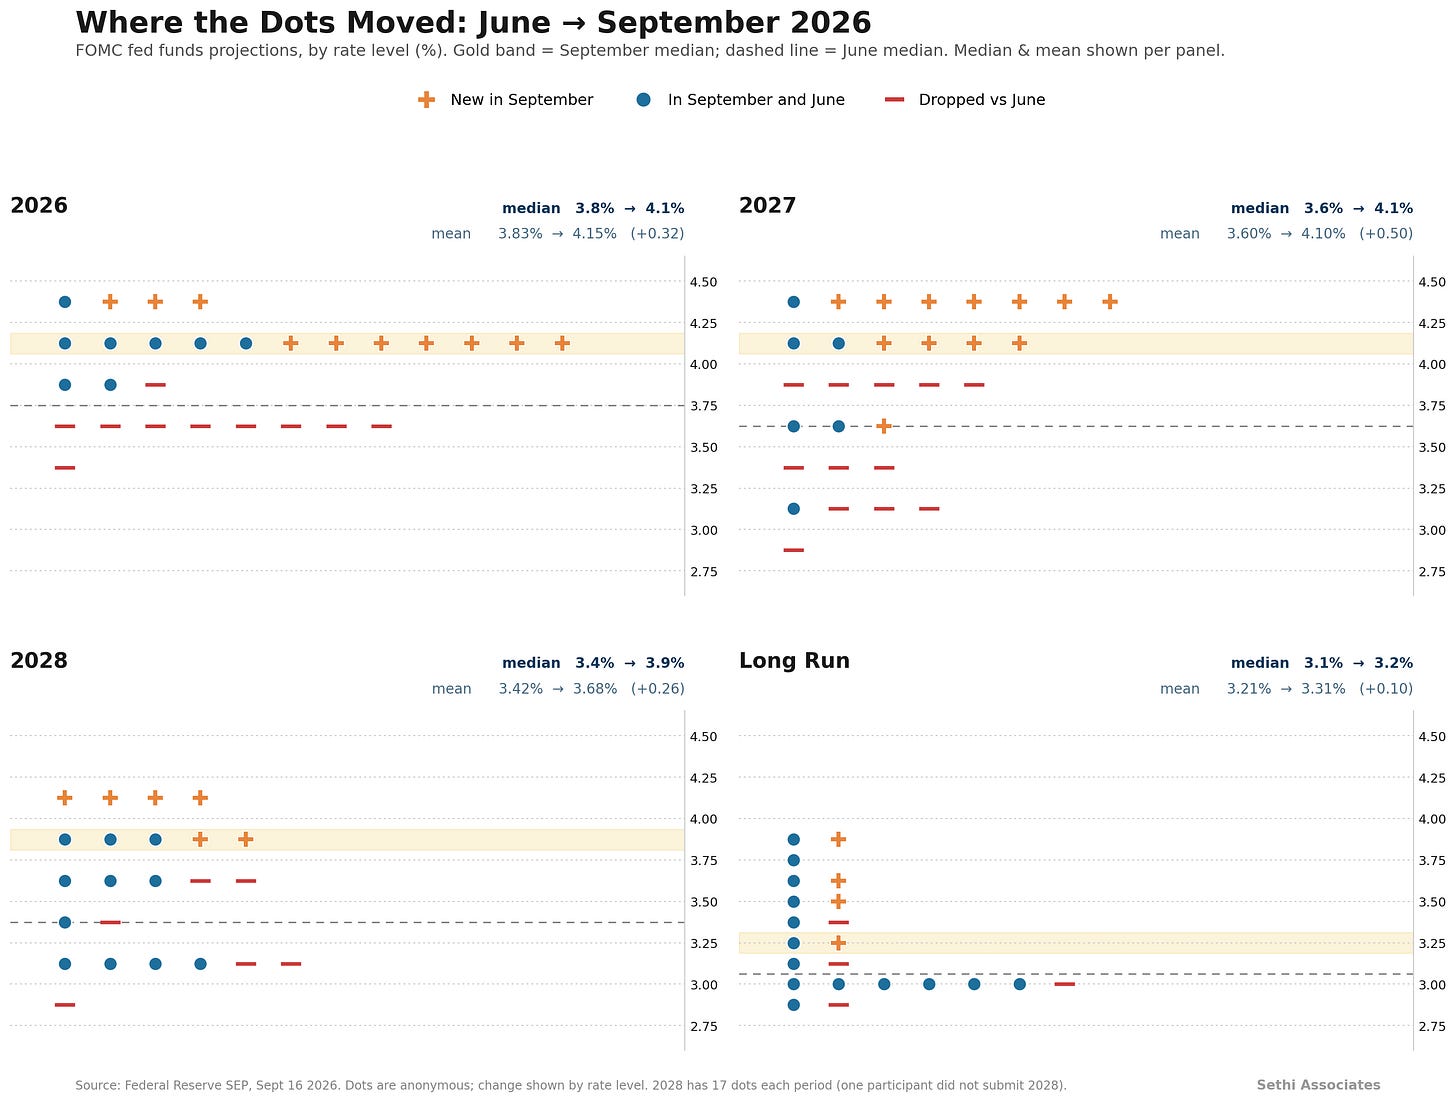
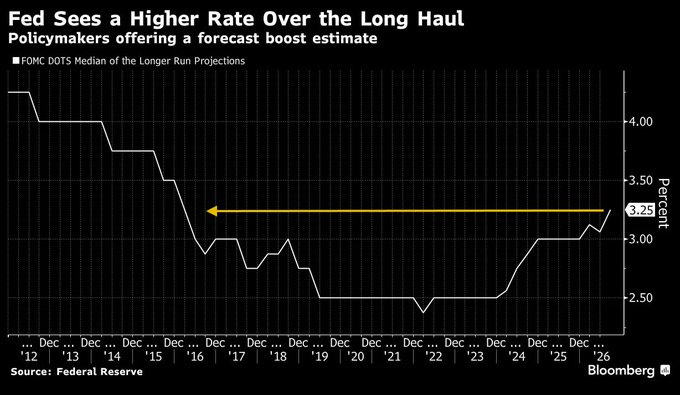
Following on from that assessment, 16 of the 18 dots see another rate hike this year (with four seeing two more), and the median dot was raised by two hikes through 2027 and 2028, meaning the vast majority of the committee is looking for one to two more hikes held through 2027. In addition, the long run median dot rose to its highest since 2016.
Taking the averages of the dots gives a similar result although it is a hike lower for 2028 but eleven basis points higher for the long-run.
And a visual on the long run dot median. Now the highest since 2016.
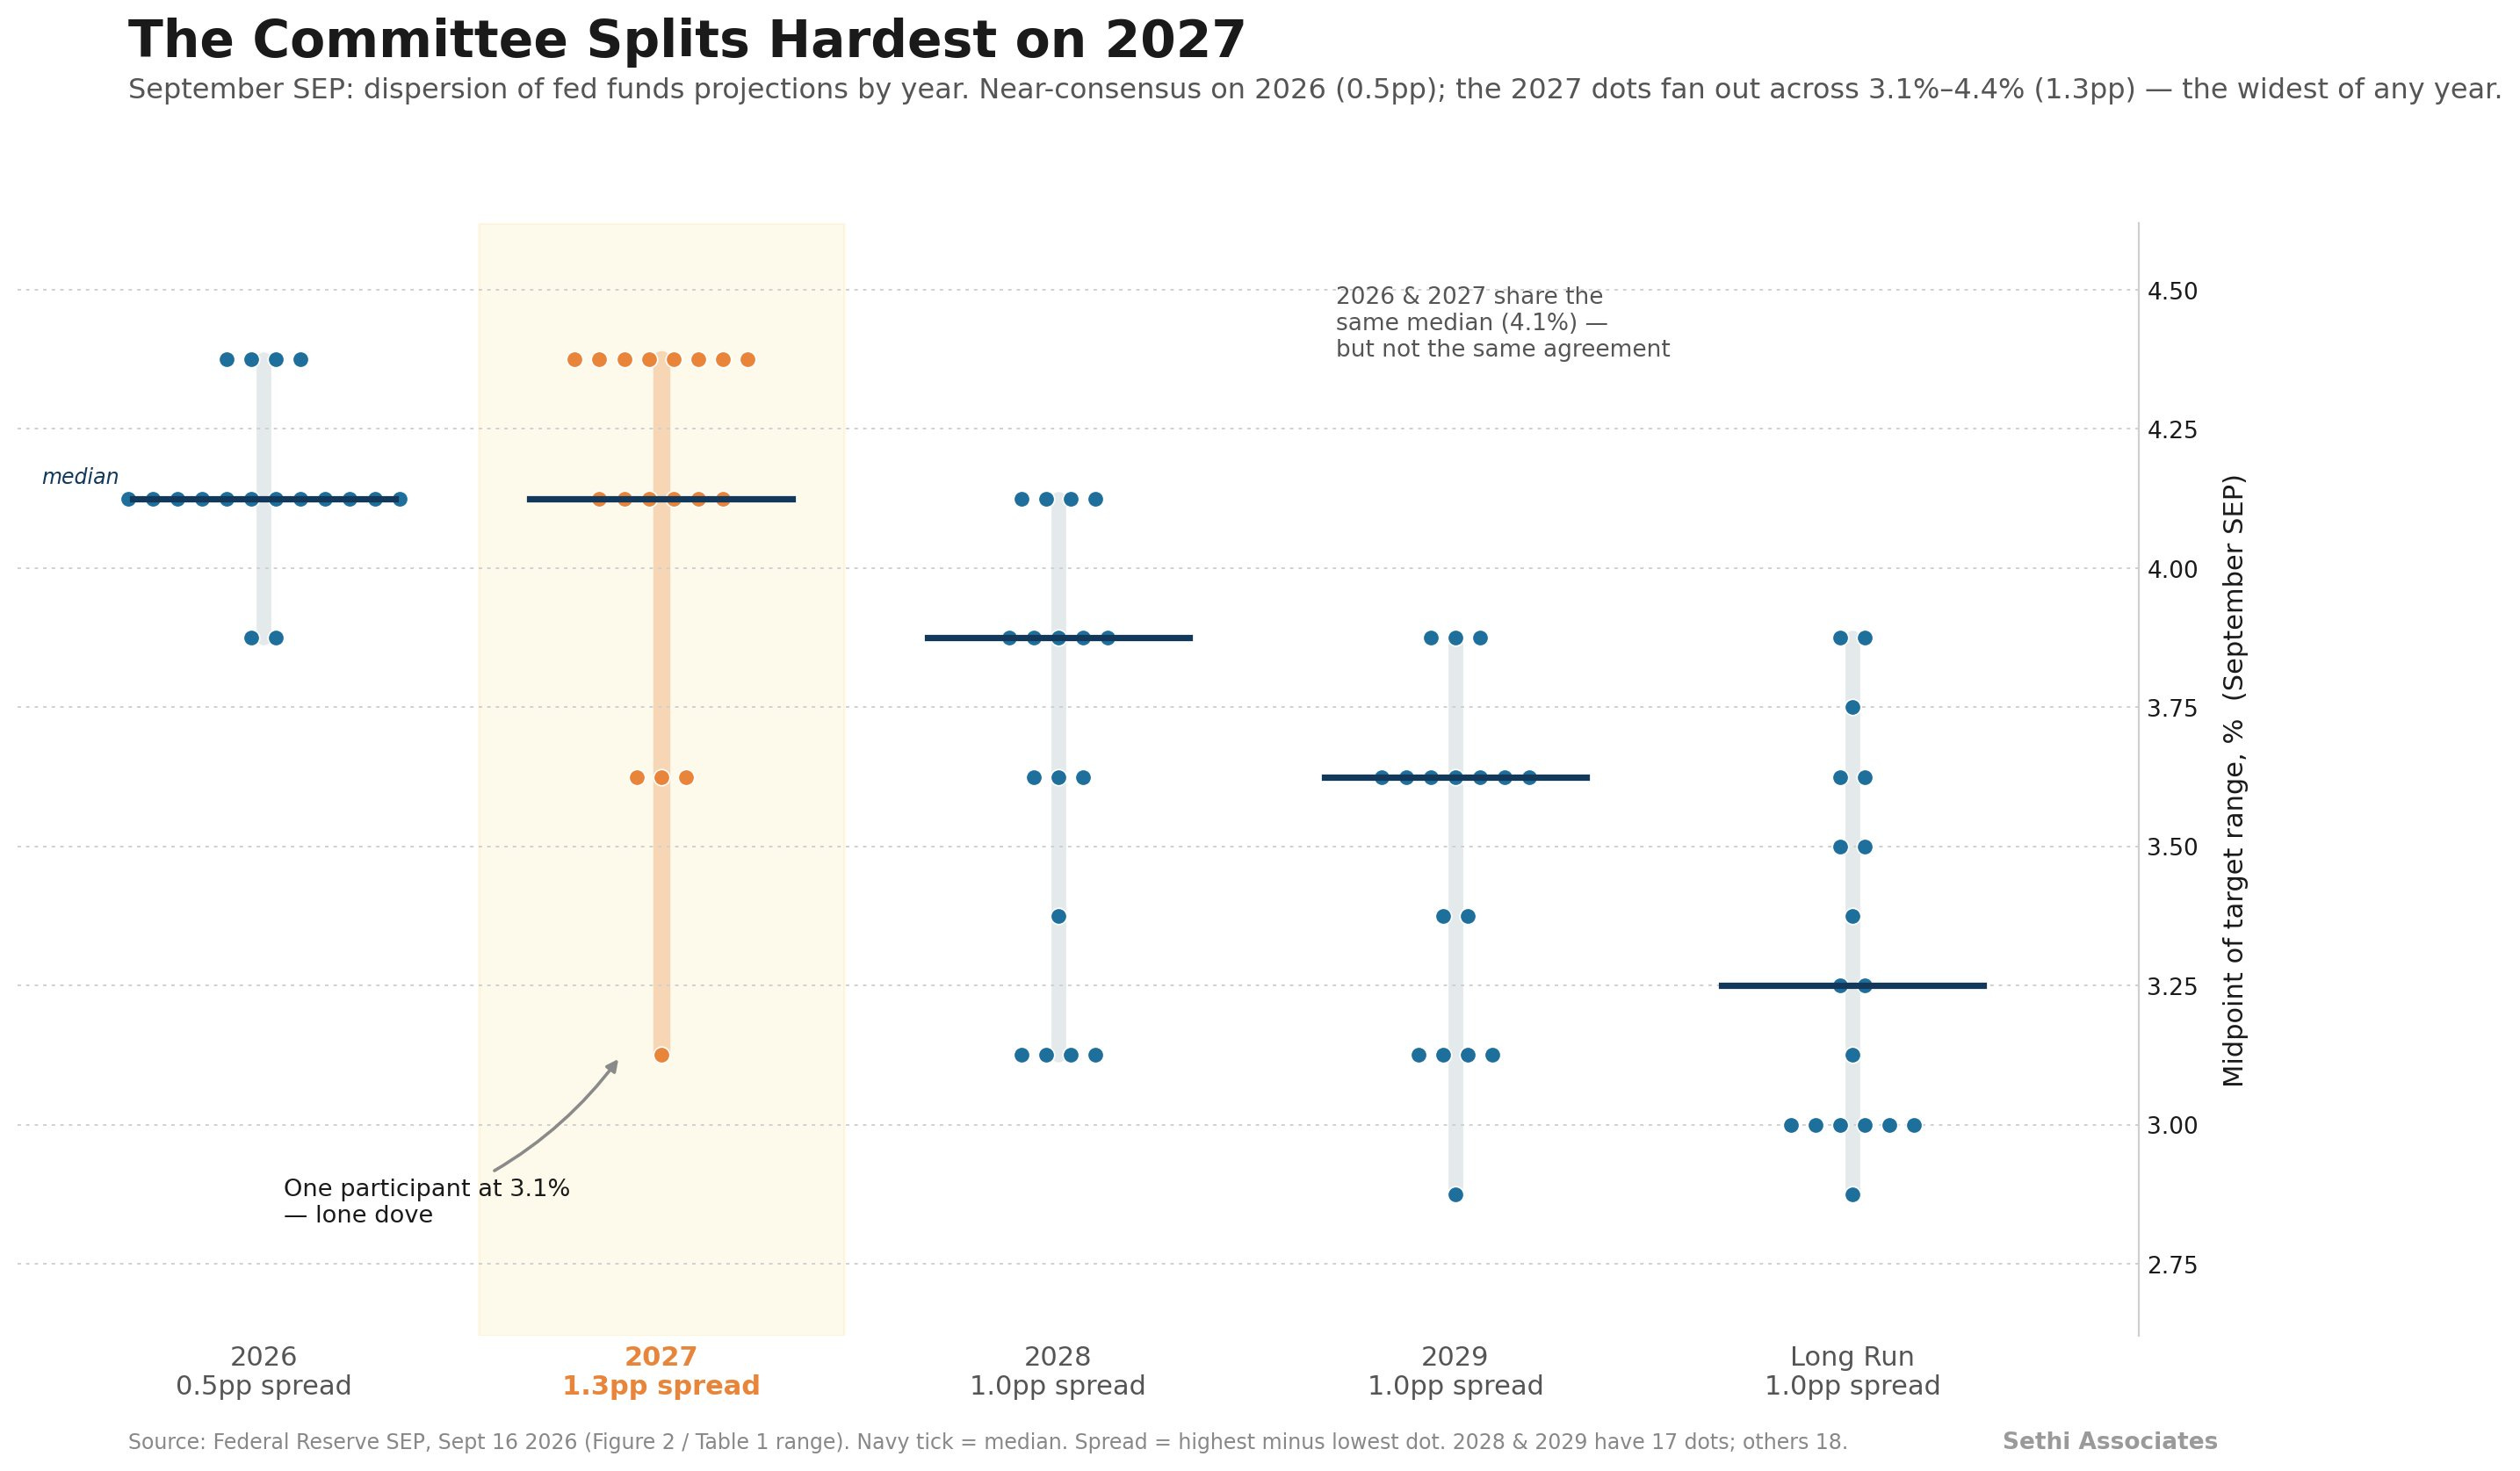
Notably though the focus on the median (or average) dot misses dispersion in views. In that regard, while 2026 and 2027 share the same median the dispersion is markedly different.
The year-end 2026 dots are bunched into a 0.5-point band from 3.9% to 4.4%, with two-thirds of the committee (12 of 18) sitting right at 4.1%.
The 2027 dots, by contrast, are across 1.3 points — 3.1% to 4.4%, the widest spread of any horizon. That is owing though to a single dot which has policy back down at 3.1% (almost certainly Bowman who seems to be taking the mantle up from Gov Miran). There are though three more at 3.6%, while the remaining fourteen are still at 4.1% or higher.
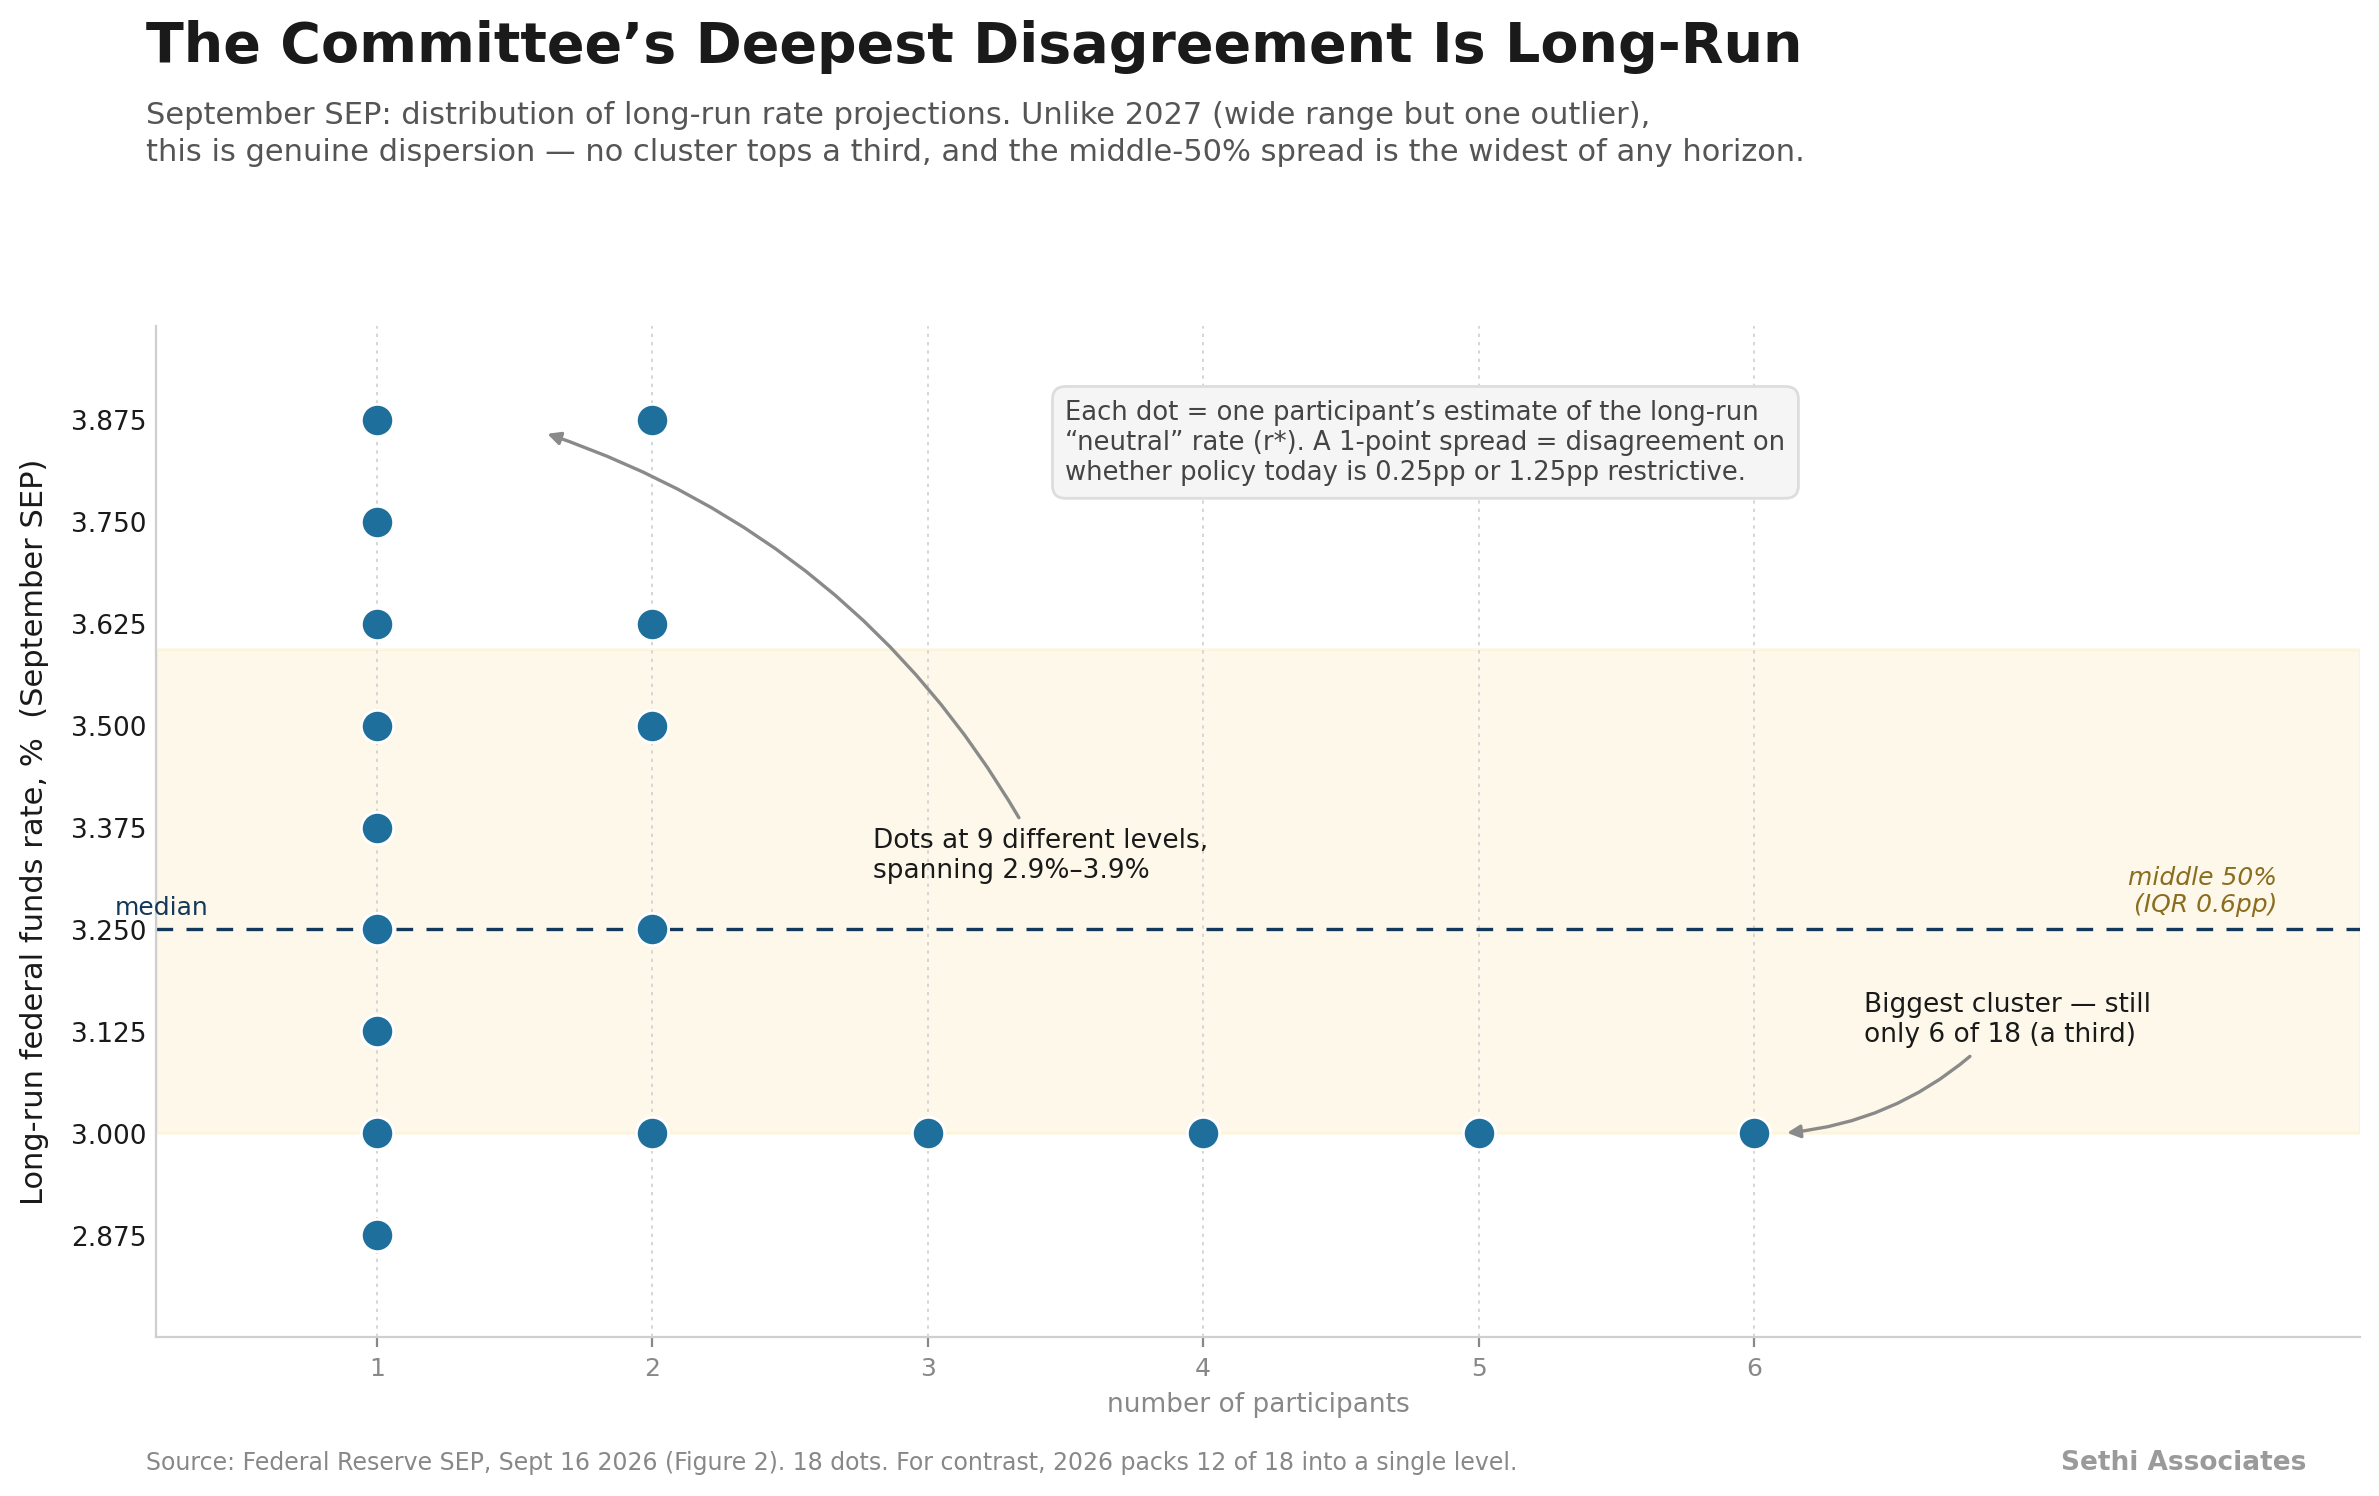
But where the dispersion is most acute is in the “long run” dot often referred to as the “neutral rate” or rate that is supposed to be neither stimulative nor restrictive for the economy. As noted the median (and the average for that matter) has drifted up to the highest since 2016, but that average/median masks a wide range of opinions with dots at nine different levels spanning a full percent from 2.9% to 3.9%. The largest cluster is at 3.0% (6 of 18). That does though imply there is at least one hike worth of restrictiveness in current policy to as much as four.
BofA unsurprisingly doubled down on their call for two more hikes…
Details of the Summary of Economic Projections (SEP) were more hawkish than we expected. While the median dot showed two hikes this year, the fed funds rate over the rest of the horizon was higher than we projected.
Additionally, the medians for the economic variables show little impact of the higher rate path. 1) Growth was revised higher in 2026/27 and remained above the longer run estimate in 2028/29. 2) The unemployment rate was revised down to 4.1% throughout the forecast. 3) Inflation was revised up in 2026 and 2028 and unchanged in 2027.
The totality of these changes suggests a few things. First, many on the committee do not see a peak fed funds rate of 4.125% or 4.375% as enough to return inflation to target until 2029.That presents upside risks to our Fed forecast of two more rate hikes (Oct & Dec).
Second, it suggests the limitations of rate hikes in the current environment. As Warsh noted in his presser, rates may not slow inflation from AI capex or help lower oil prices.
Third, the Fed still seems unwilling to sacrifice activity to drive inflation down more quickly.
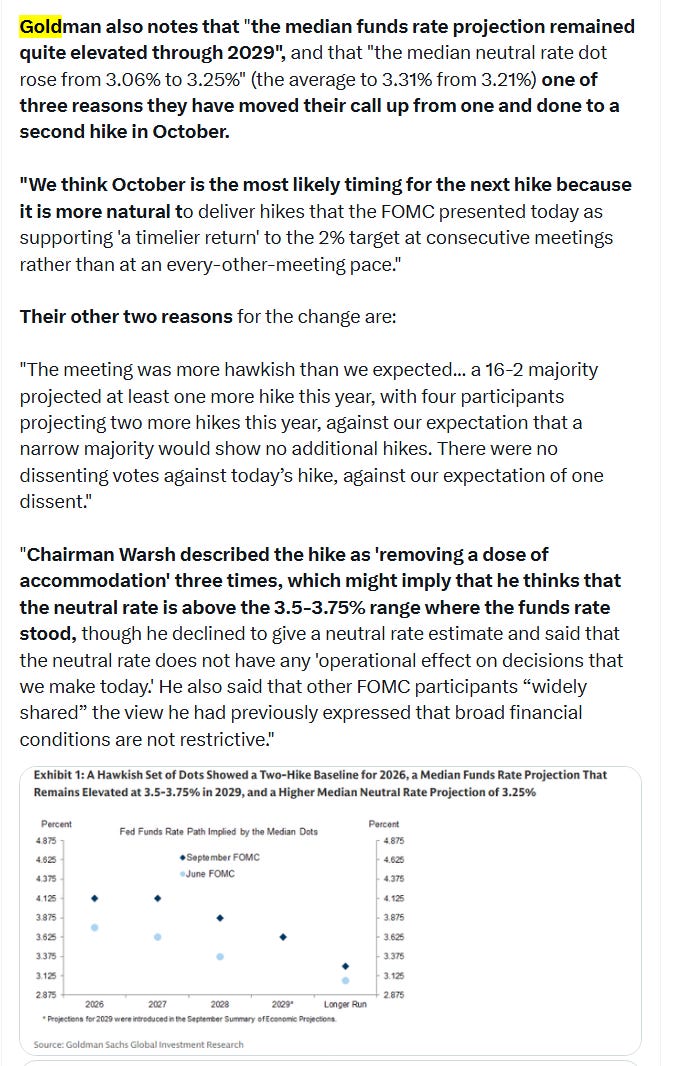
… while Goldman interestingly added a second hike but put it in October, just a handful of days ahead of the mid-term elections as I went over in the Thursday update.
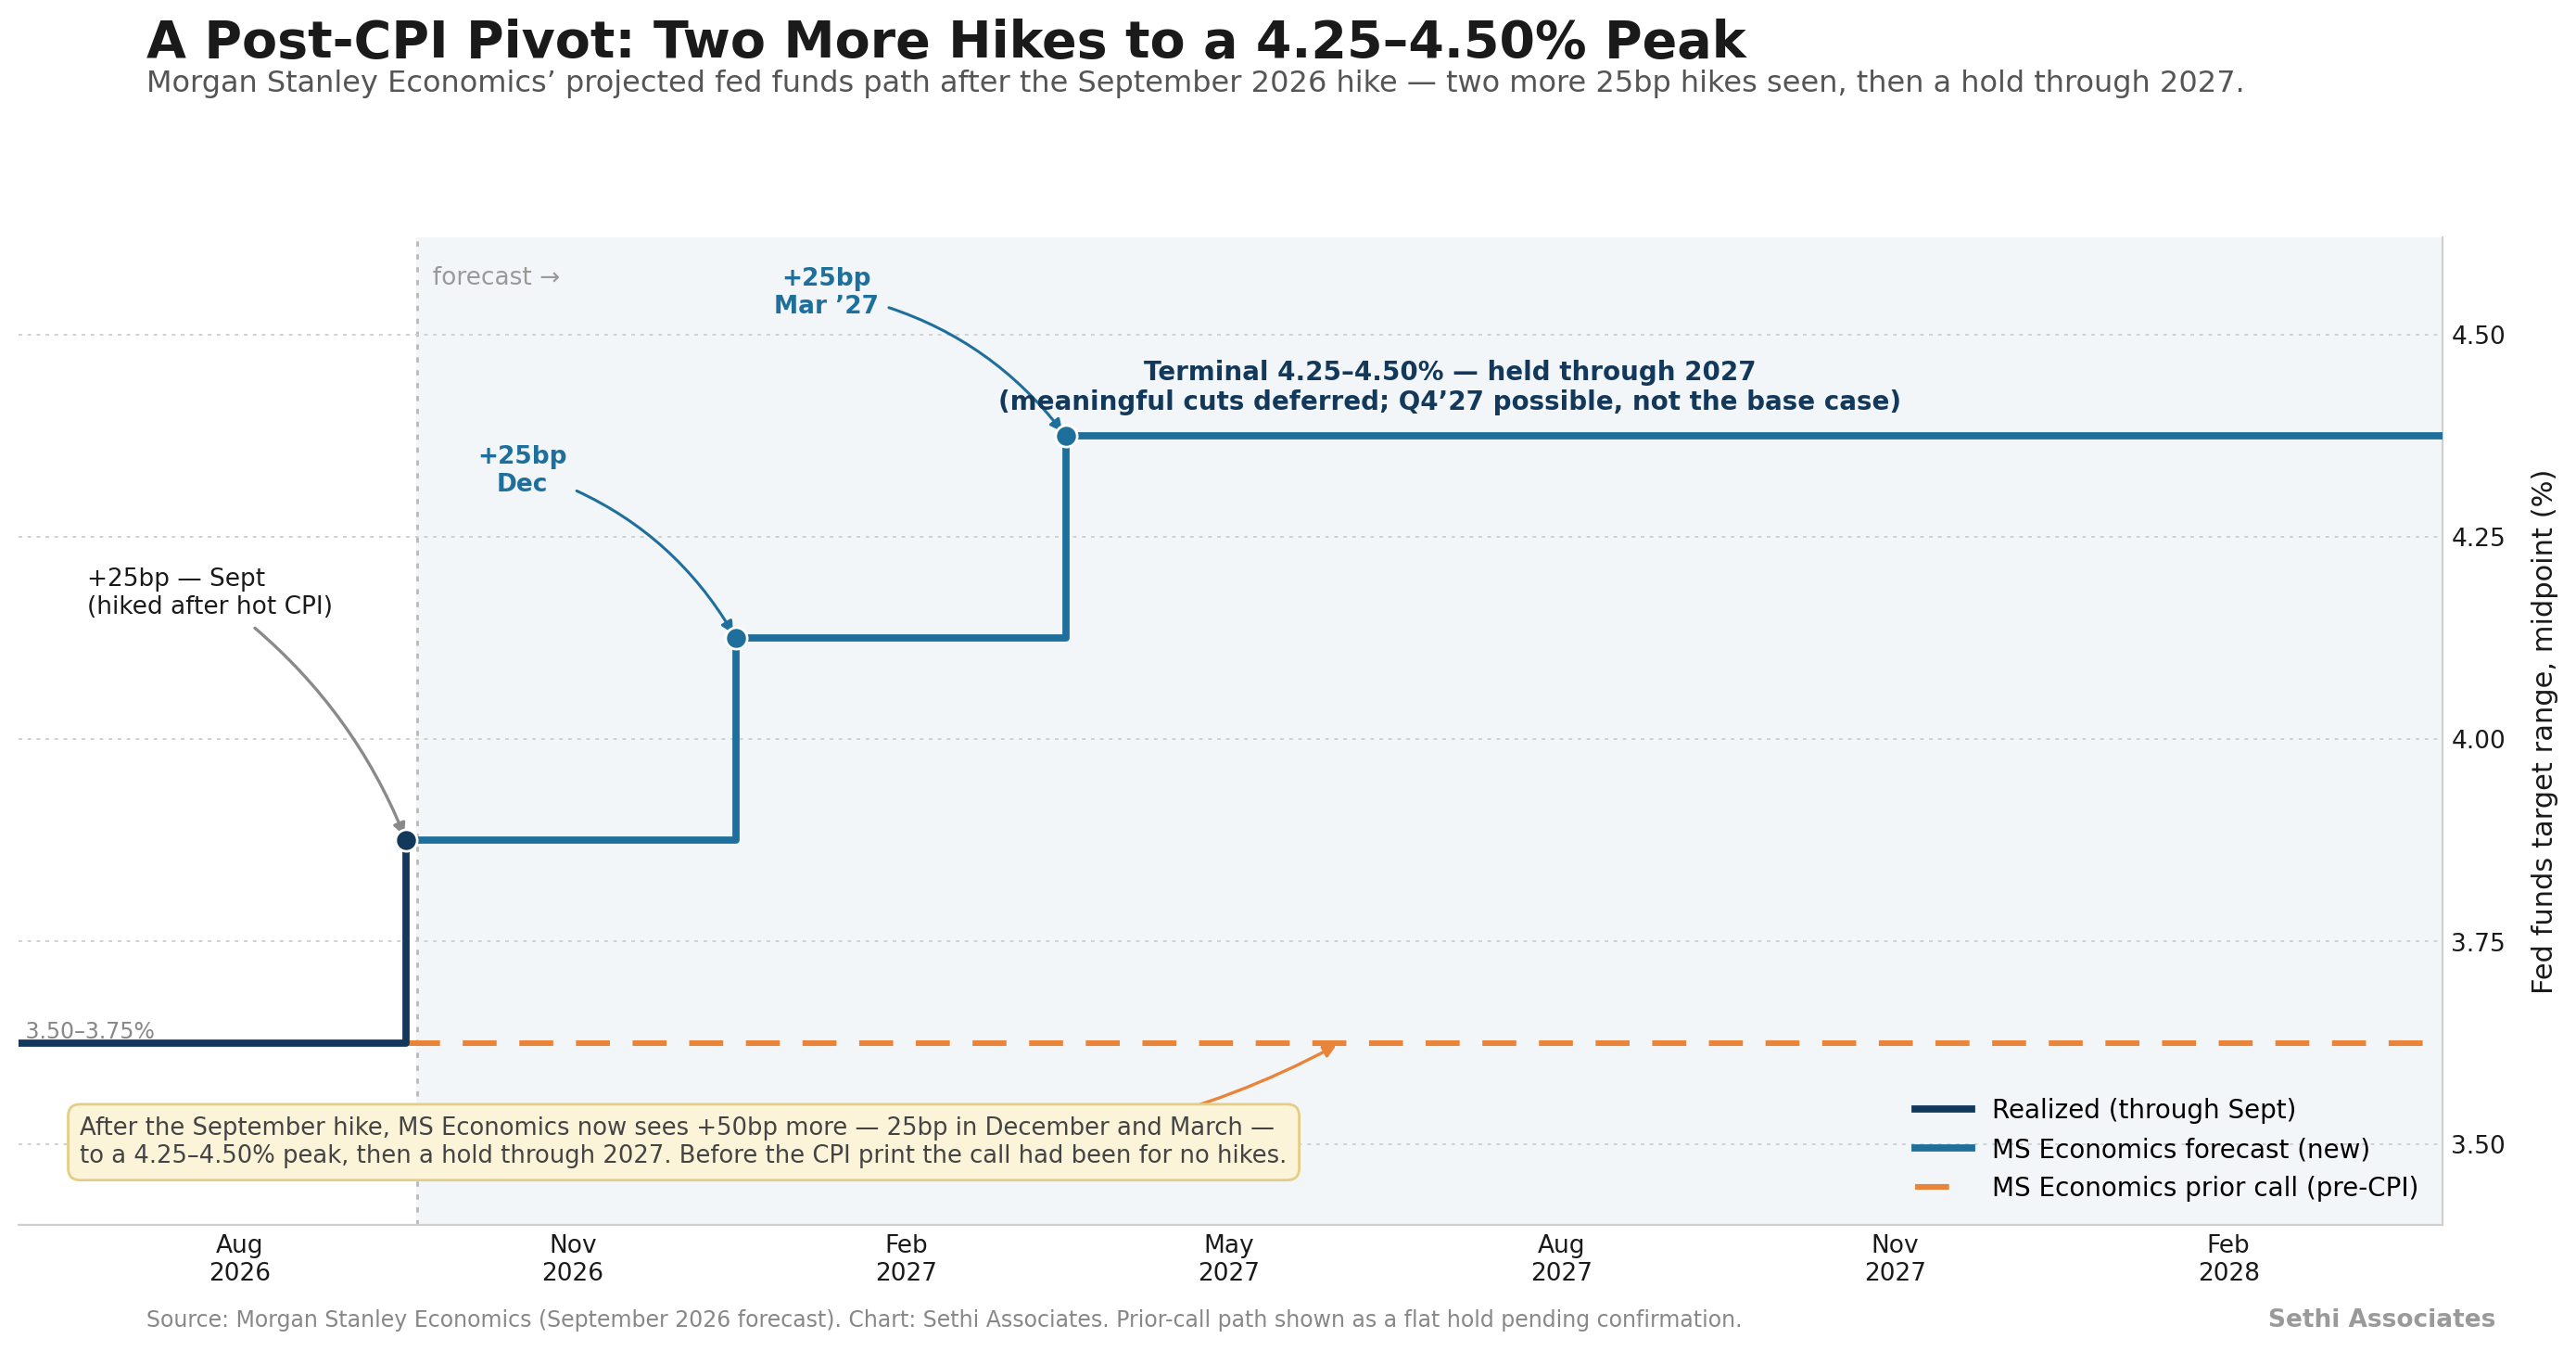
MS (Gapen), who didn’t expect a rate hike at all pre-CPI then switched to a September hike after now like BofA sees two more hikes:
We now expect an additional 50bp of tightening, with 25bp hikes in December and March that would bring the terminal rate to 4.25%–4.50%. We expect policy to remain at that level throughout 2027, with meaningful rate cuts deferred until inflation makes sufficient progress toward target. While our inflation outlook could potentially justify cuts as early as the fourth quarter of 2027, we do not believe the outlook clears that bar for now.
First, Chair Warsh characterized the latest move as part of the process of removing accommodation, suggesting that monetary policy—and, by extension, financial conditions—has not yet reached clearly restrictive territory. If so, there is more work to do.
Second, he repeatedly highlighted geopolitical developments, particularly their effects on energy and commodity prices, as an important influence on inflation. Our view of the chair’s reaction function remains incomplete, but oil prices clearly appear to be part of the story, and expectations for monetary policy are likely to remain connected to movements in energy prices.
Third, FOMC participants revised up their estimate of the neutral rate to 3.25% from 3.06%, implying a higher threshold for policy restraint. Taken together, these developments support our view that further interest-rate tightening is likely.
[W]e see it as a more modest adjustment in the direction policy was already heading—a continuation rather than a break. The task forces remain at work, and Chair Warsh may view balance-sheet reforms as a mechanism to reduce inflation. If so, any interest-rate tightening cycle should be modest. How Chair Warsh believes monetary policy can reduce inflation, and which combination of tools can achieve the desired financial conditions, remains to be seen. We will continue to focus on how the chair sees the Fed achieving price stability.
WhileJPM (Feroli) like Goldman looks for one more hike but says “it is a close call between one additional hike and multiple hikes”:
We expect the hiking cycle to conclude with one more hike in December, although a stronger-than-expected labor market or continued sticky inflation could lead to additional tightening. Even under our existing macroeconomic forecast, it is a close call between one additional hike and multiple hikes. Labor-market data continue to look solid, so most of the uncertainty rests on how quickly inflation can return to target.
Chair Warsh provided limited detail, but characterized the action as a step that “removed a dose of accommodation.” The cohesion displayed by a previously divided committee was also significant. While the unanimous decision may partly reflect a strategic effort to reinforce institutional independence and the new chair’s leadership, this month’s SEP points to a convergence in views around risks to growth and the labor market. Of the 18 Committee participants who submitted projections, 16 see at least one additional hike this year. Moreover, most of that group sees that policy rate, or a higher one, as appropriate at year-end 2027.
The median longer-run dot was also revised up from 3.06% to 3.25%, its highest level since 2016. The longer-run dot is often interpreted as an estimate of the nominal neutral federal funds rate—the rate that neither stimulates nor restrains economic growth. However, that interpretation is difficult to reconcile fully with Warsh’s comments that he and his colleagues were “hard-pressed” to describe policy as restrictive. It is also challenged by his characterization of the policy move as removing a “dose of accommodation.”
Although inflation concerns remain persistent, the Committee’s risk weighting has shifted toward strong growth and tighter labor markets for the first time since 2021. The Committee did not materially change its core-inflation forecast at this meeting. Indeed, it maintains an immaculate disinflation path despite projecting sustained above-potential growth and full employment. However, members now broadly agree that higher policy rates will be needed to deliver that outcome.
The 2027 median dot plot moved 50bp higher, with eight members now expecting 75bp of cumulative tightening.
While the point estimates should not be taken too literally, the overall narrative is that the Committee sees a growing risk of renewed overheating and is adopting a more hawkish posture in response.
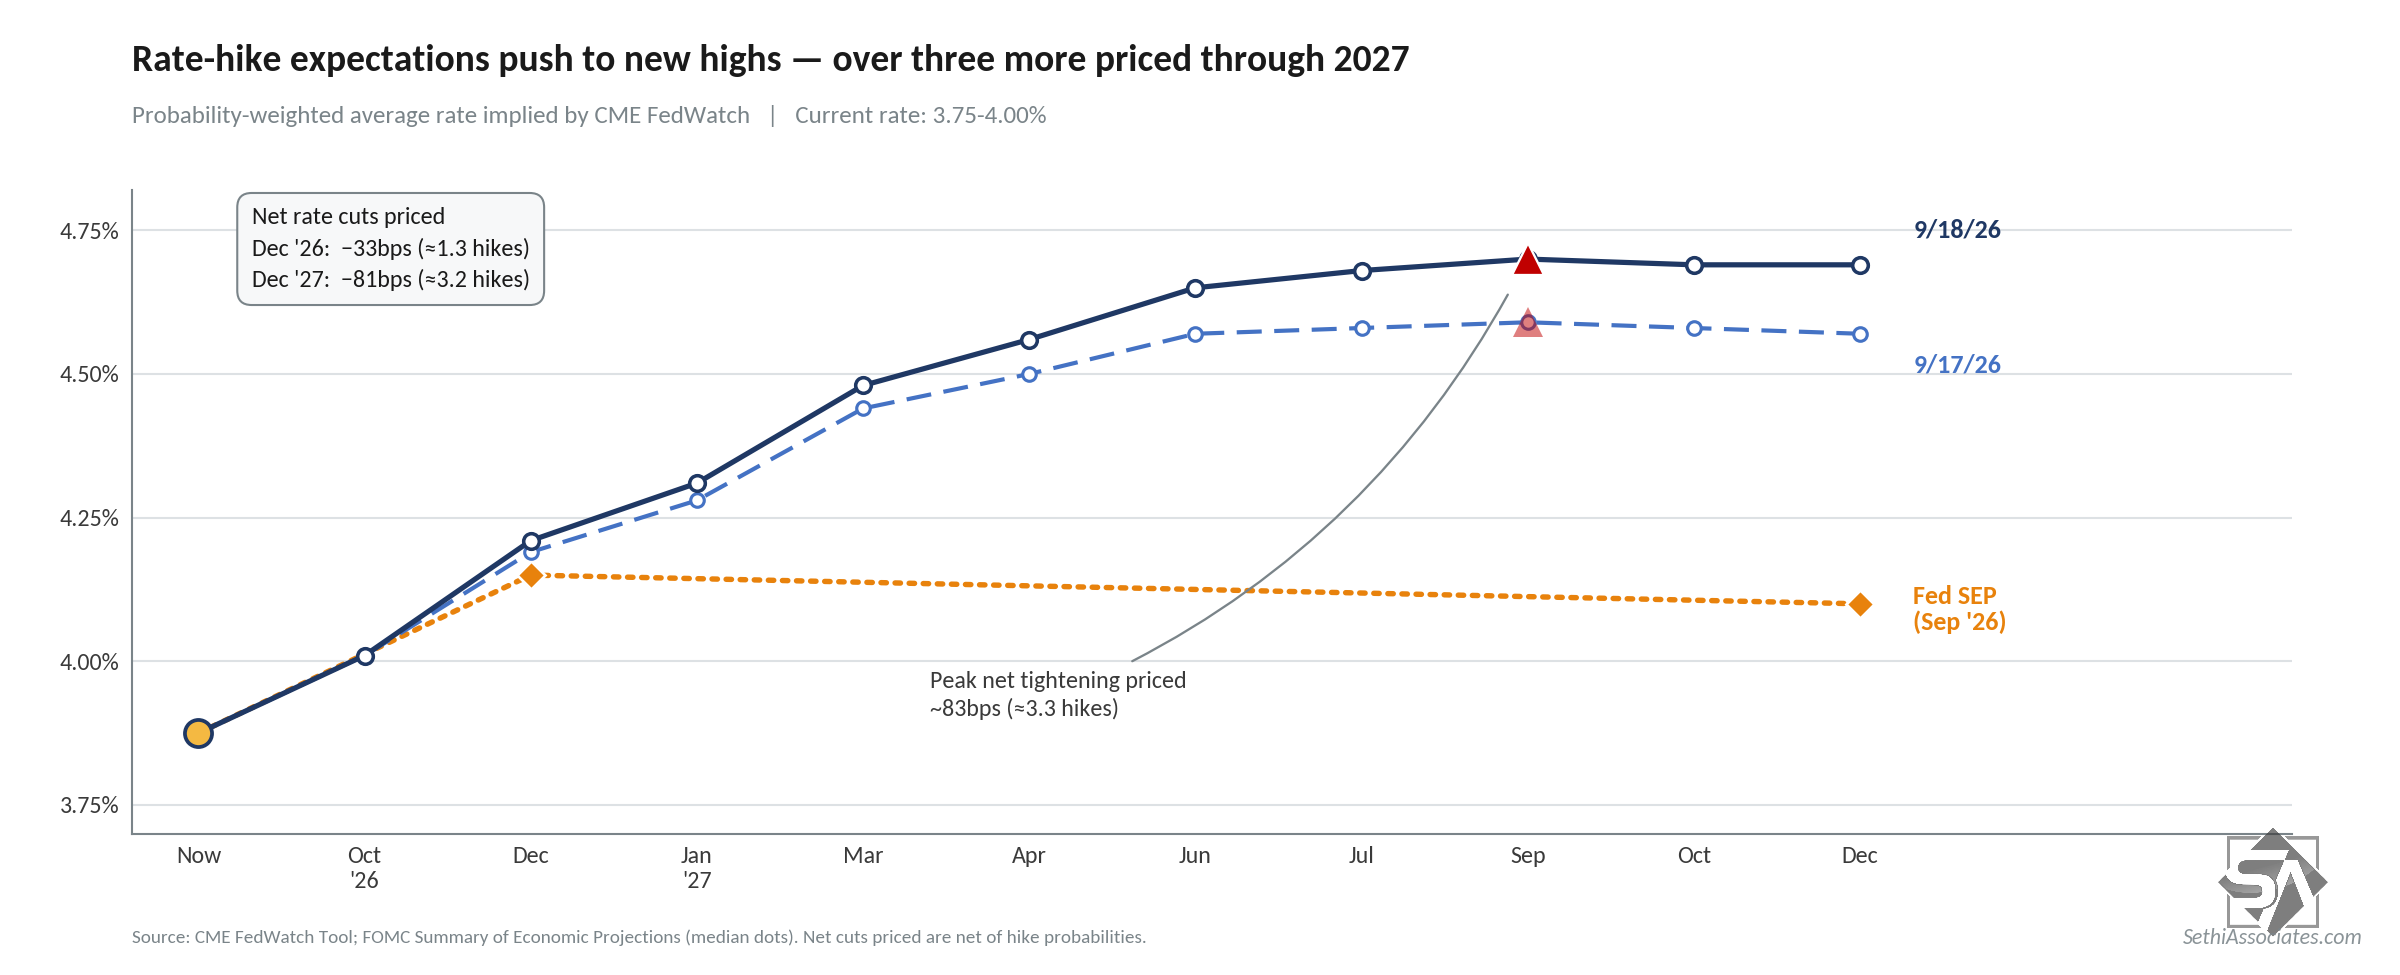
And the market via CME’s Fedwatch tool, as noted on Friday, sees a 90% chance of one more hike (with October at 55%) and a 43% chance of two more hikes this year, but unlike any of the above (including the dot plot) sees at least one more hike in 2027 (81 basis points of tightening priced through next year from present levels).
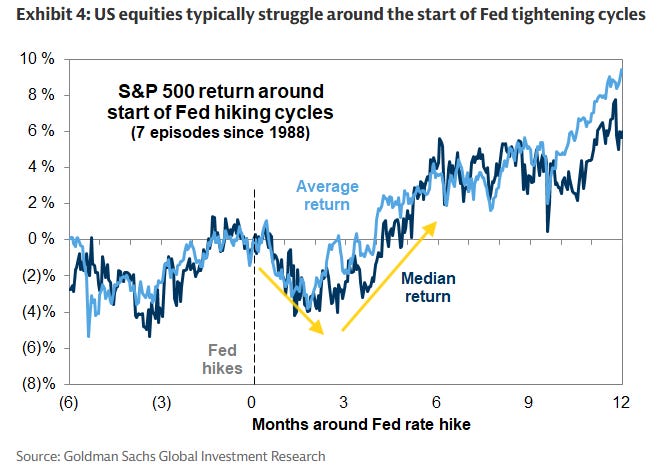
And as a reminder from Goldman, history says to watch for equity weakness now although they seem to indicate this time might be different with equities falling in advance of the hike (they normally rise):
Goldman: Equities typically struggle at the start of Fed hiking cycles, but the market has already priced substantial Fed tightening in coming months.
The S&P 500 has generated an average 3-month return of -2% at the start of seven hiking cycles during the last few decades. However, the S&P 500 then generated an average 12-month return of +9%, with positive returns in every episode but 2022. In 1997, for example, the S&P 500 declined by 10% alongside the Fed’s 25 bp hiking “cycle.”
Stocks bottomed when the market ceased pricing additional tightening, and the S&P 500 reached new highs within three months. Today, the rates market is already pricing more than three 25 bp hikes by the middle of 2027, lifting the bar for policy to surprise in a hawkish direction. The medium-term impact of Fed tightening on equities will depend on how tightening affects earnings growth, which is the most important driver of stocks.
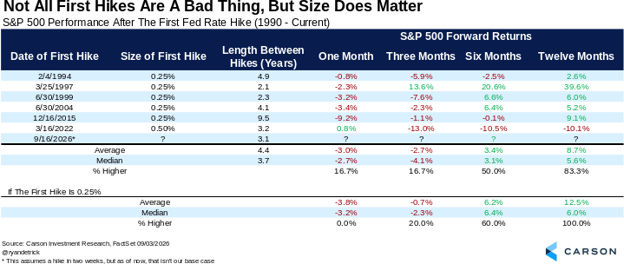
And from Carson Research:
Five recent hiking cycles started with 0.25%. Stocks were lower a month later all five times. A year later, they were higher all five times, up 12.5% on average.
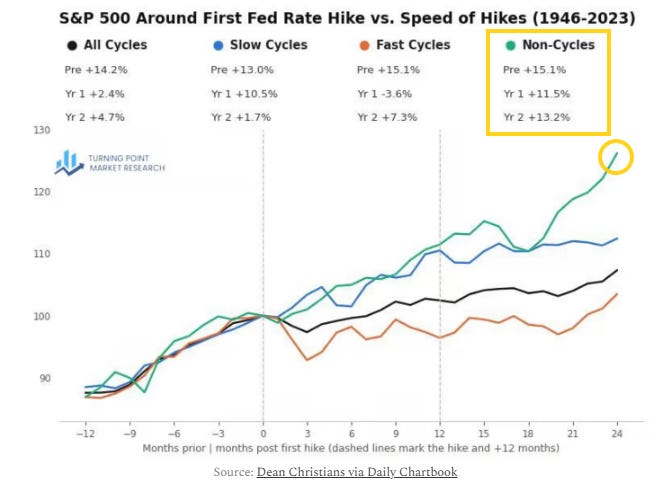
But history says a better way to look at this is to break apart the type of hiking cycle. As Eric Soda noted in his weekly article and as you might have seen elsewhere there is a starkdifferential in equity returns between “fast” hiking cycles (generally defined as hiking every meeting) and “slow” cycles (generally defined as pausing in between hikes).
But there are also “non-cycles” where the Fed only raises rates one or two times then stops, and that is actually the closest to what most expect (the majority of banks see no more than one additional hike with the rest looking for two more).
As you can see from the chart from @DeanChristians (via @dailychartbook) that is easily the best outcome historically with the SPX on average up 11.5% over the next year and 13.2% the following year.
I don’t have a strong feeling at this point as to whether they go in October. A lot probably depends on how the September data (NFP, CPI, PPI) come out (even as the Chair says the committee doesn’t pay much attention to any one data point). We’ll also get a lot of Fed speakers this week, so we’ll see what they say.
Turning to rates, as I mentioned last Friday,
despite markets then pricing in a September hike (and nearly three more over the next year), long maturity yields (10 and 30 years) recovered their early losses to trade roughly flat on the day. As I said “it appears that the bond vigilantes perhaps want more than a single rate hike before they will pull in their horns.”
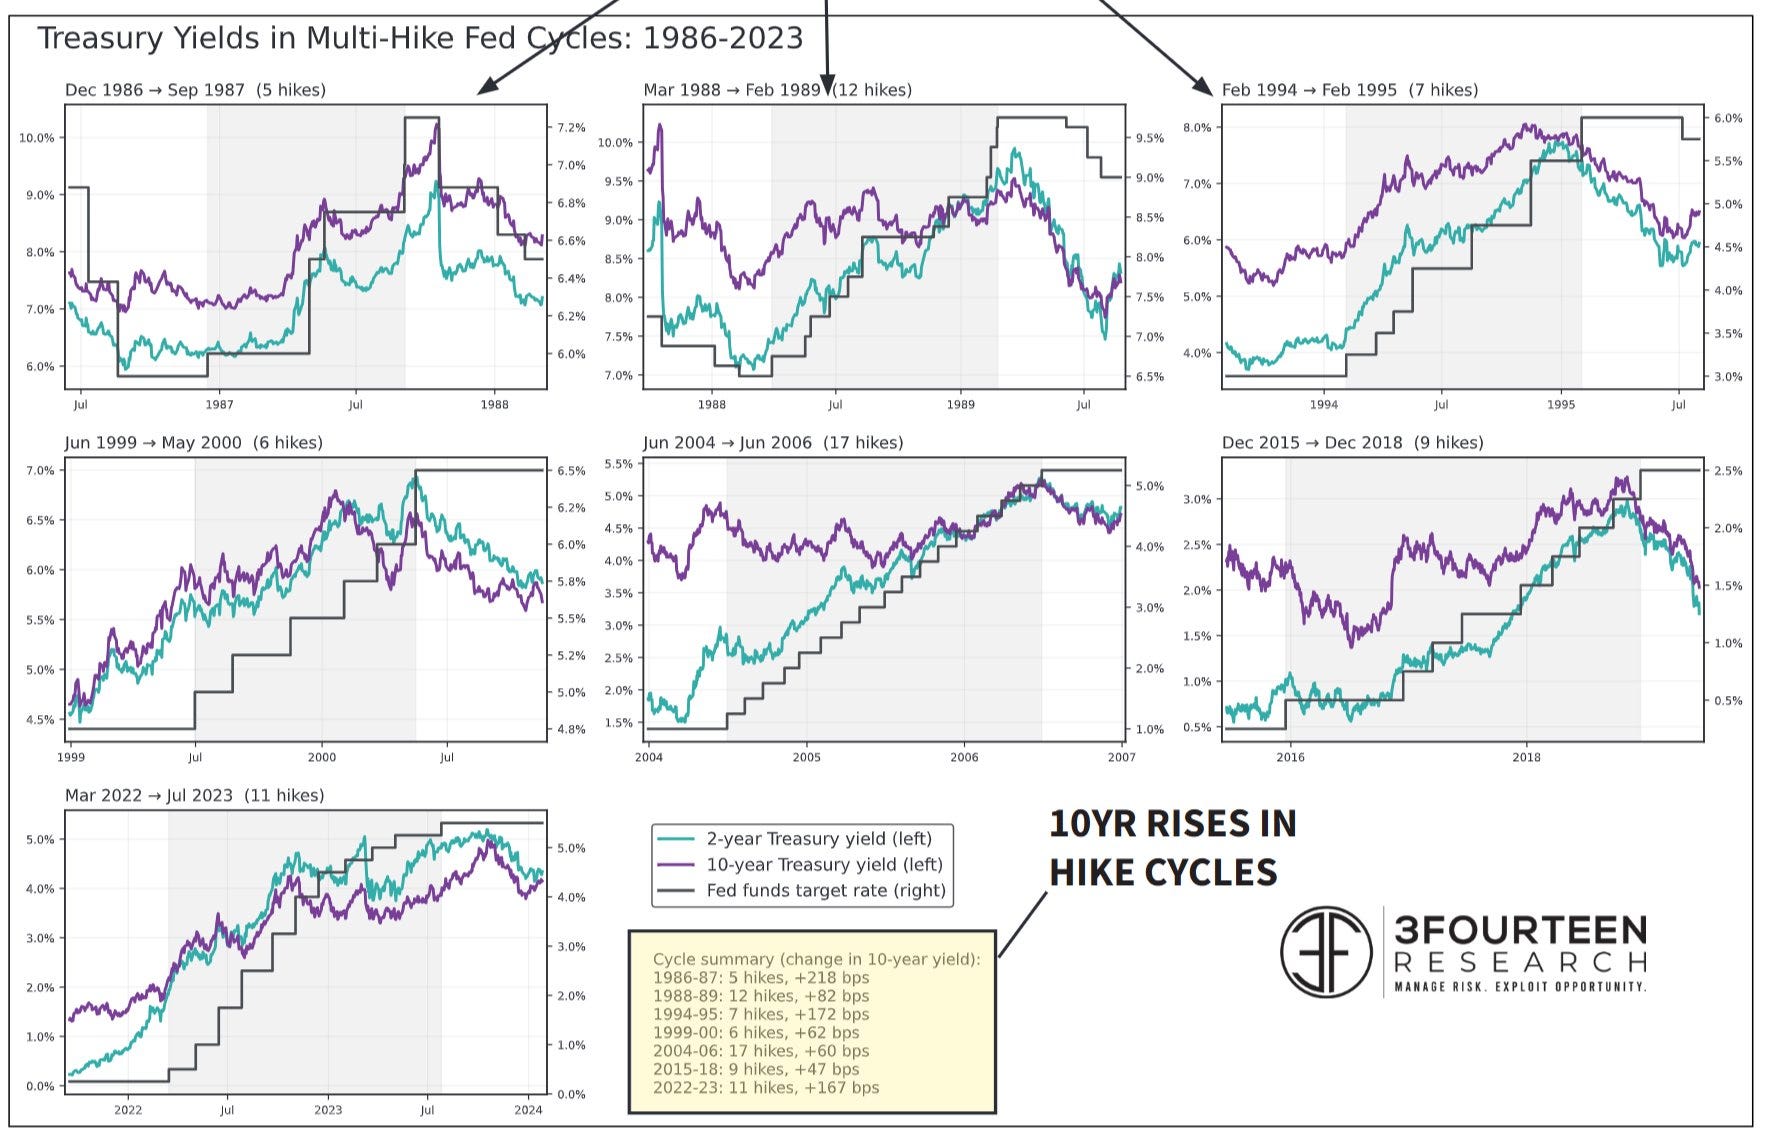
That continues to appear to be the case with 10-year yields back to 5% and 30-year yields not far from their highs. But perhaps that is what we should expect according to this analysis from Warren Pies of 3Fourteen Research:
It’s popular to suggest the 10y yield will fall if the Fed hikes rates this week.
Unless this is a “one and done” hike, though, history suggests the 10y will rise as the hike cycle progresses.
The 10y has risen in every modern hike cycle (especially early in the cycle).
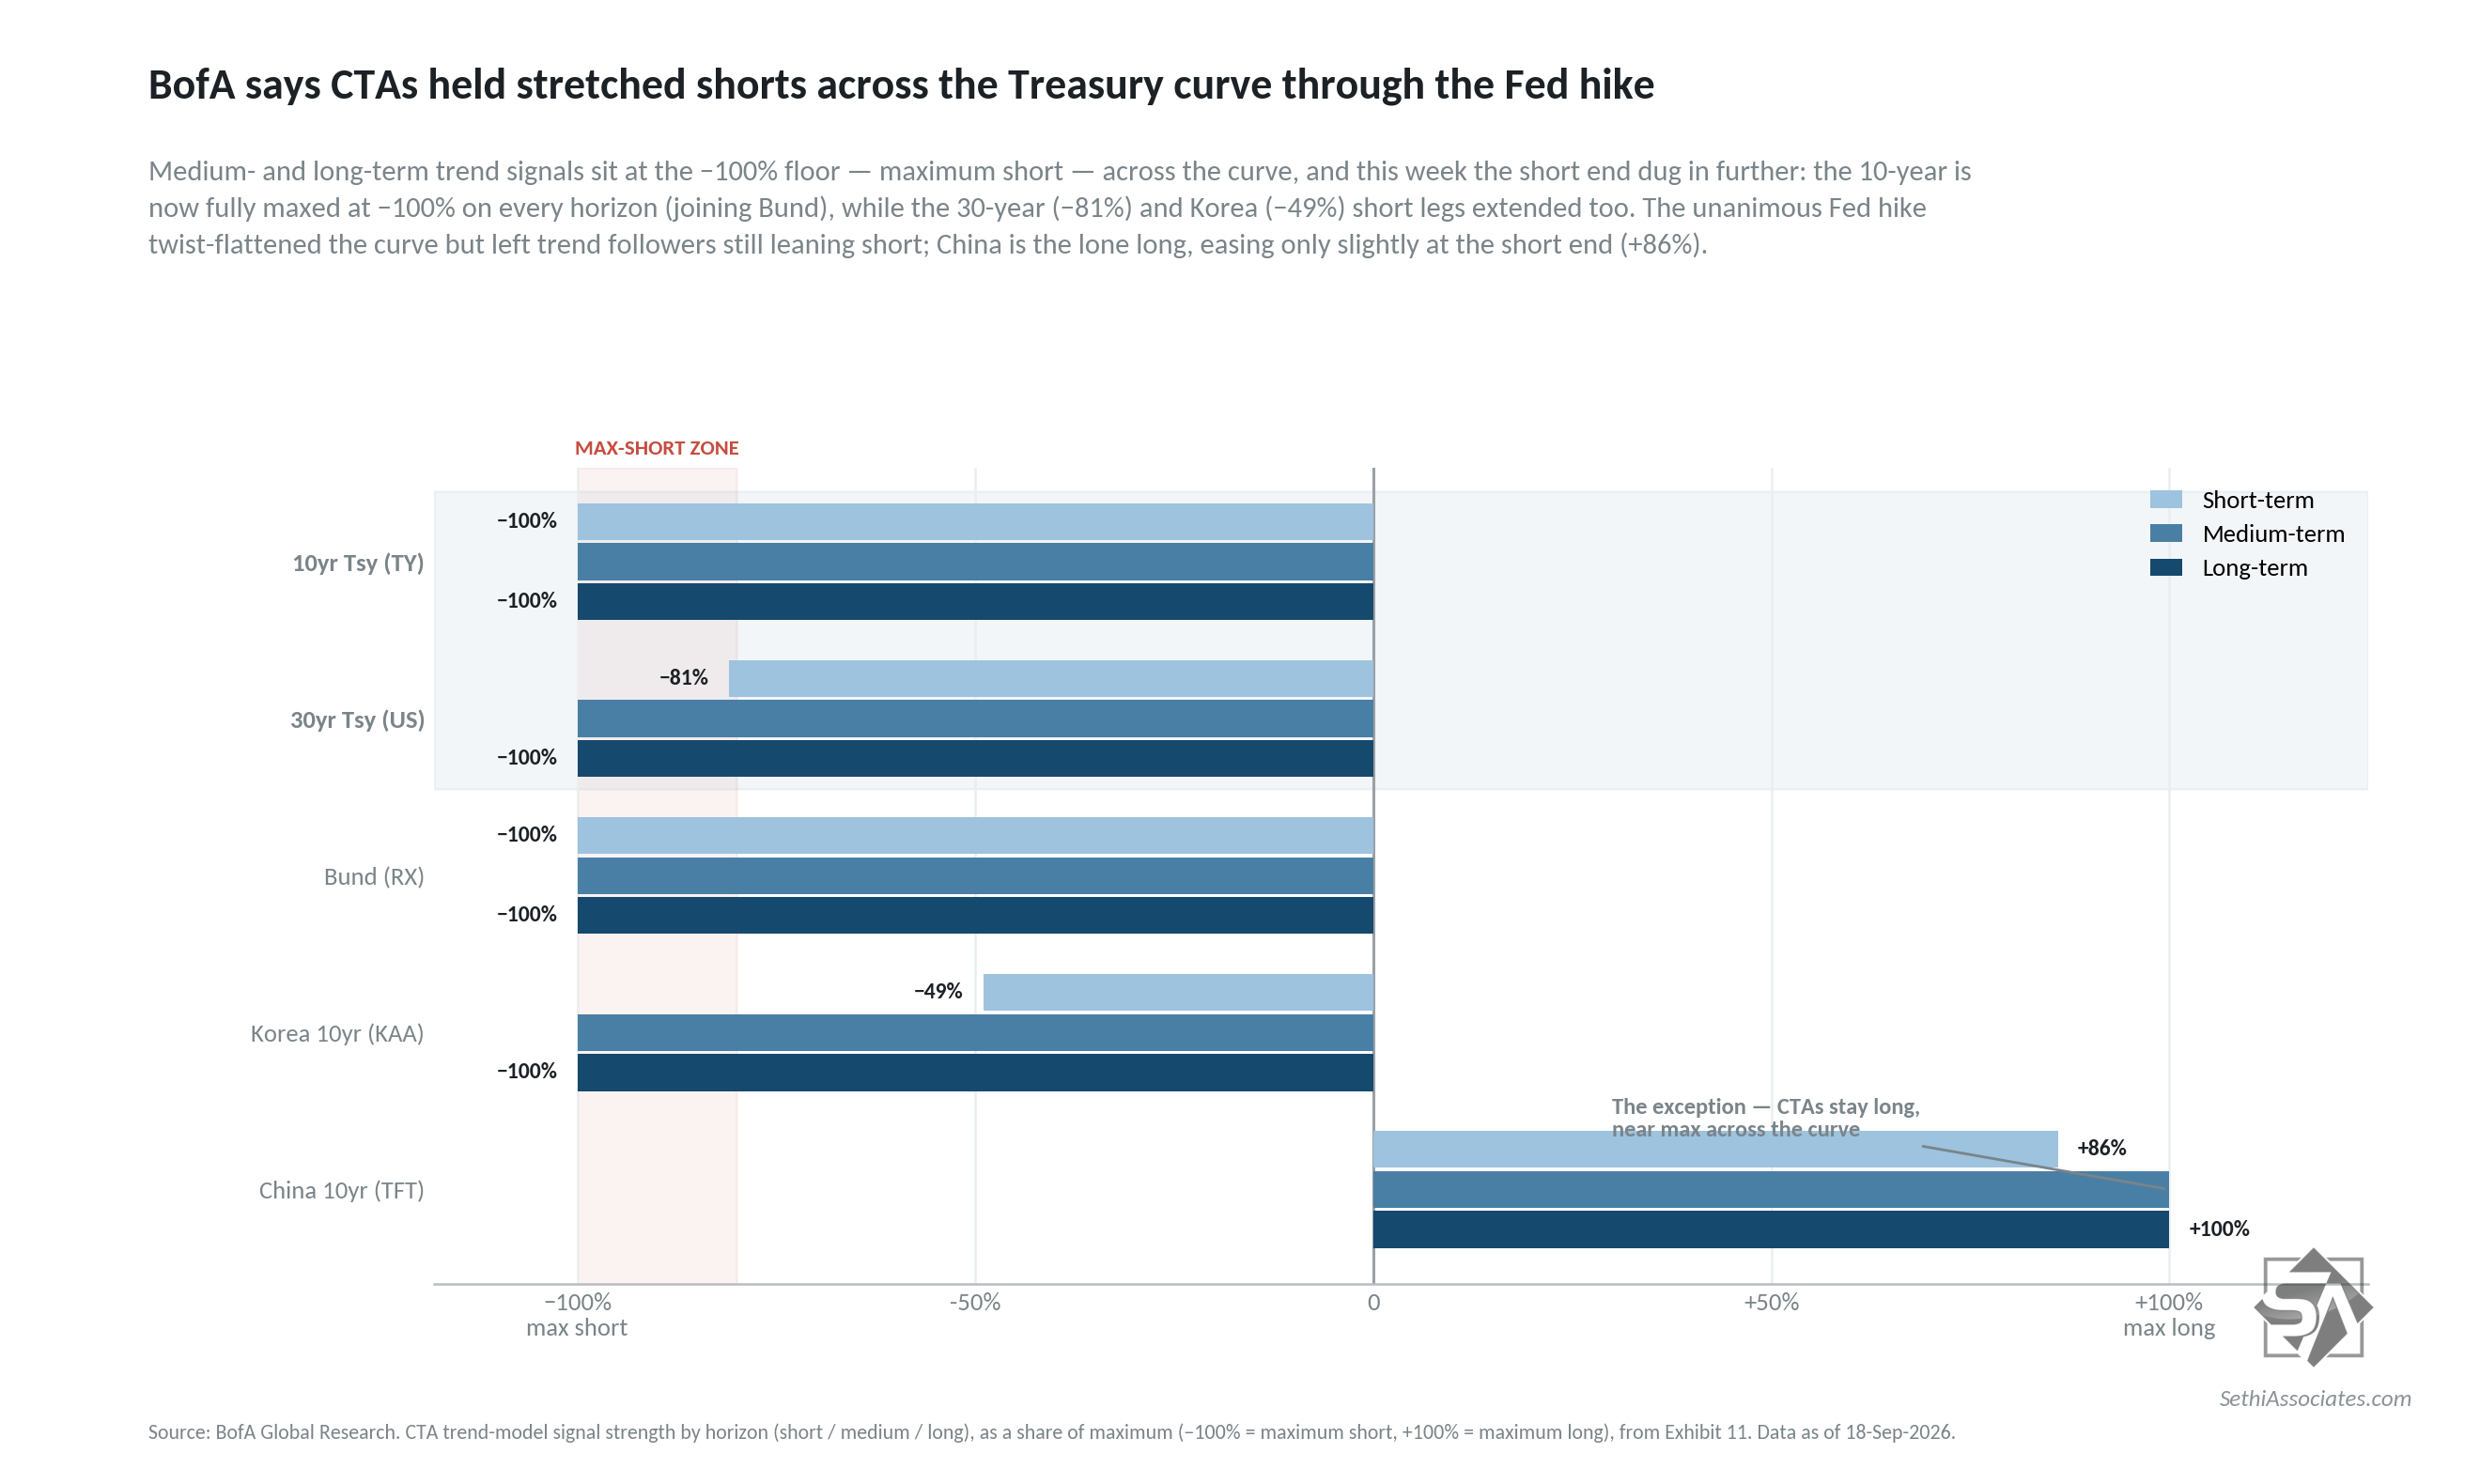
That said, we continue to remain extended in short positioning in bonds (bets on higher yields). As BofA reiterated again this week CTAs are nearly max short Treasuries (and are max-short the 10-year). As mentioned last week “at some point this will unwind in a vicious short covering rally, but for now cover triggers remain distant.”
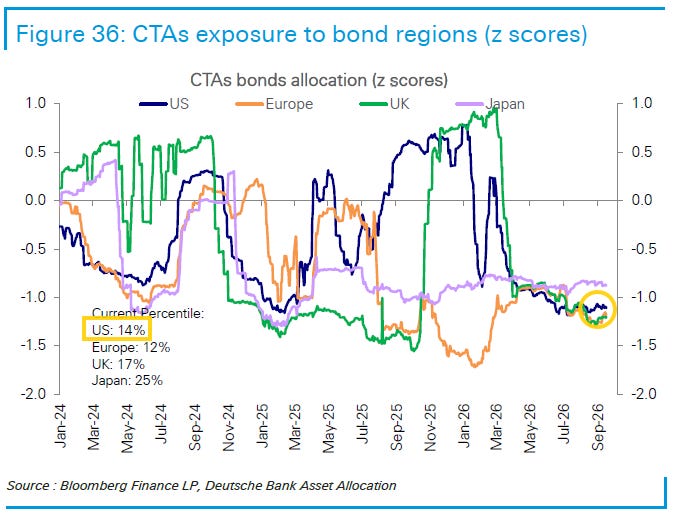
DB similarly says CTA “bond shorts remain extreme” at just the 14th percentile to 2012 for the US.
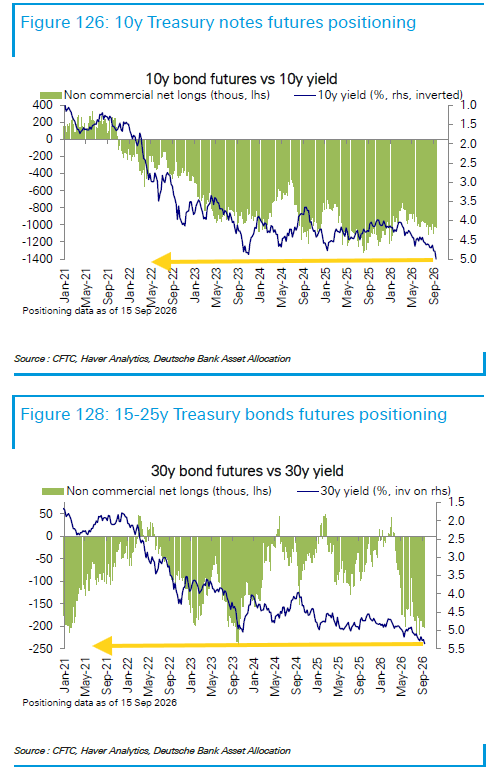
And overall futures positioning is the lowest in at least five years.
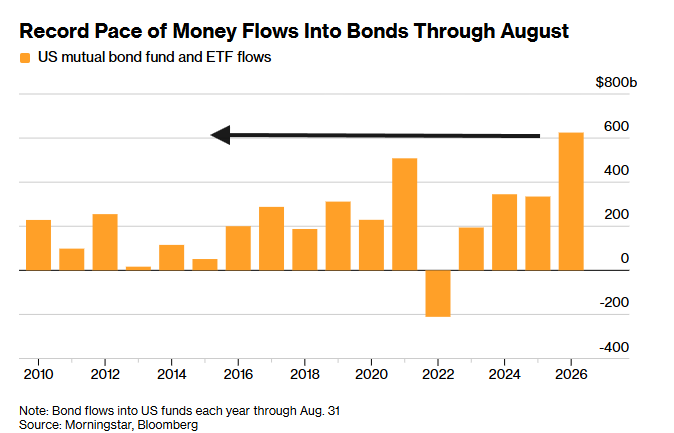
While buying has picked up according to Bloomberg: “A net $625 billion poured into US bond mutual funds and exchange-traded funds this year through August, the most for that stretch in Morningstar Inc. data going back to 2010.
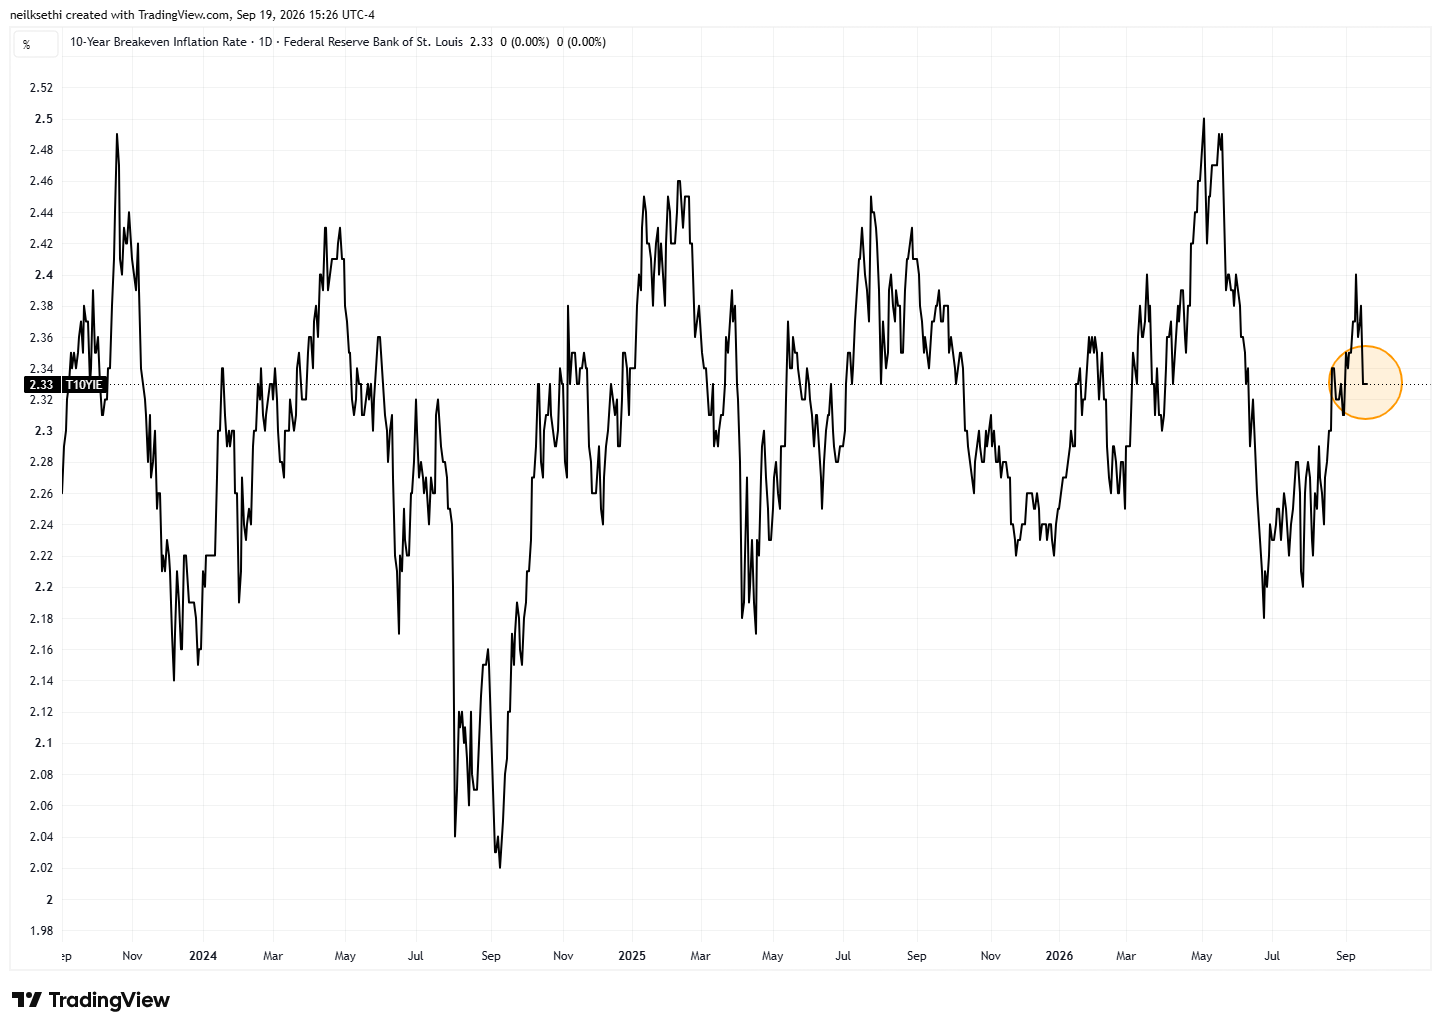
While 10-year inflation expectations fell back last week.
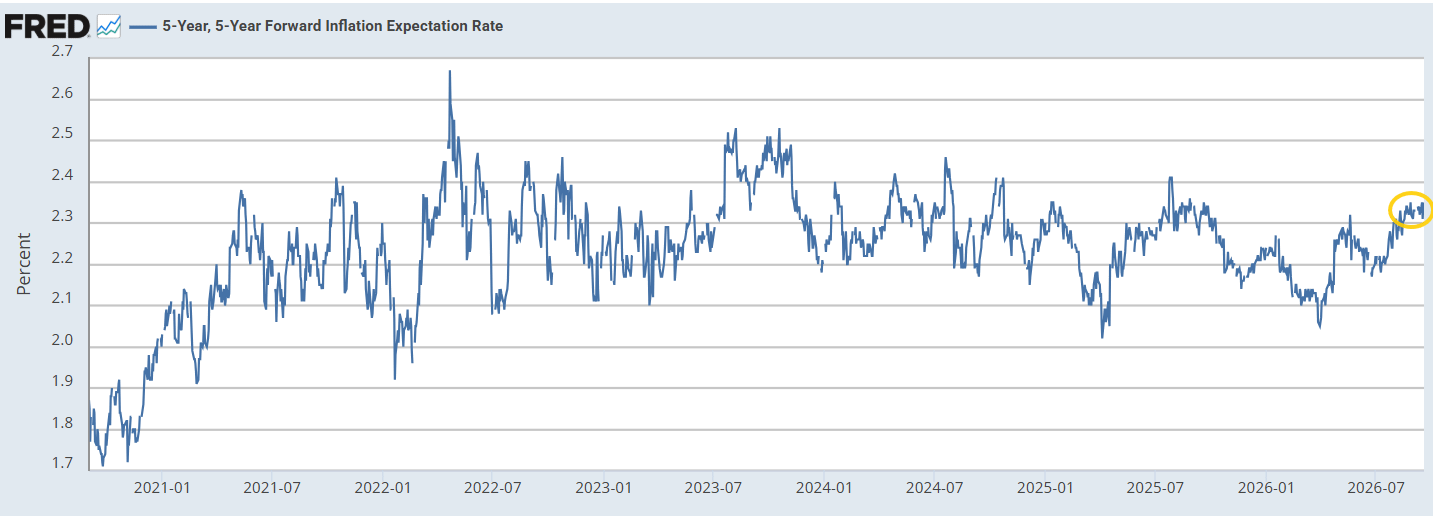
Although the Fed favorite 5-year, 5-year forward rate(expected inflation starting in 5 years over the following 5 years) remains around the highest in a year.
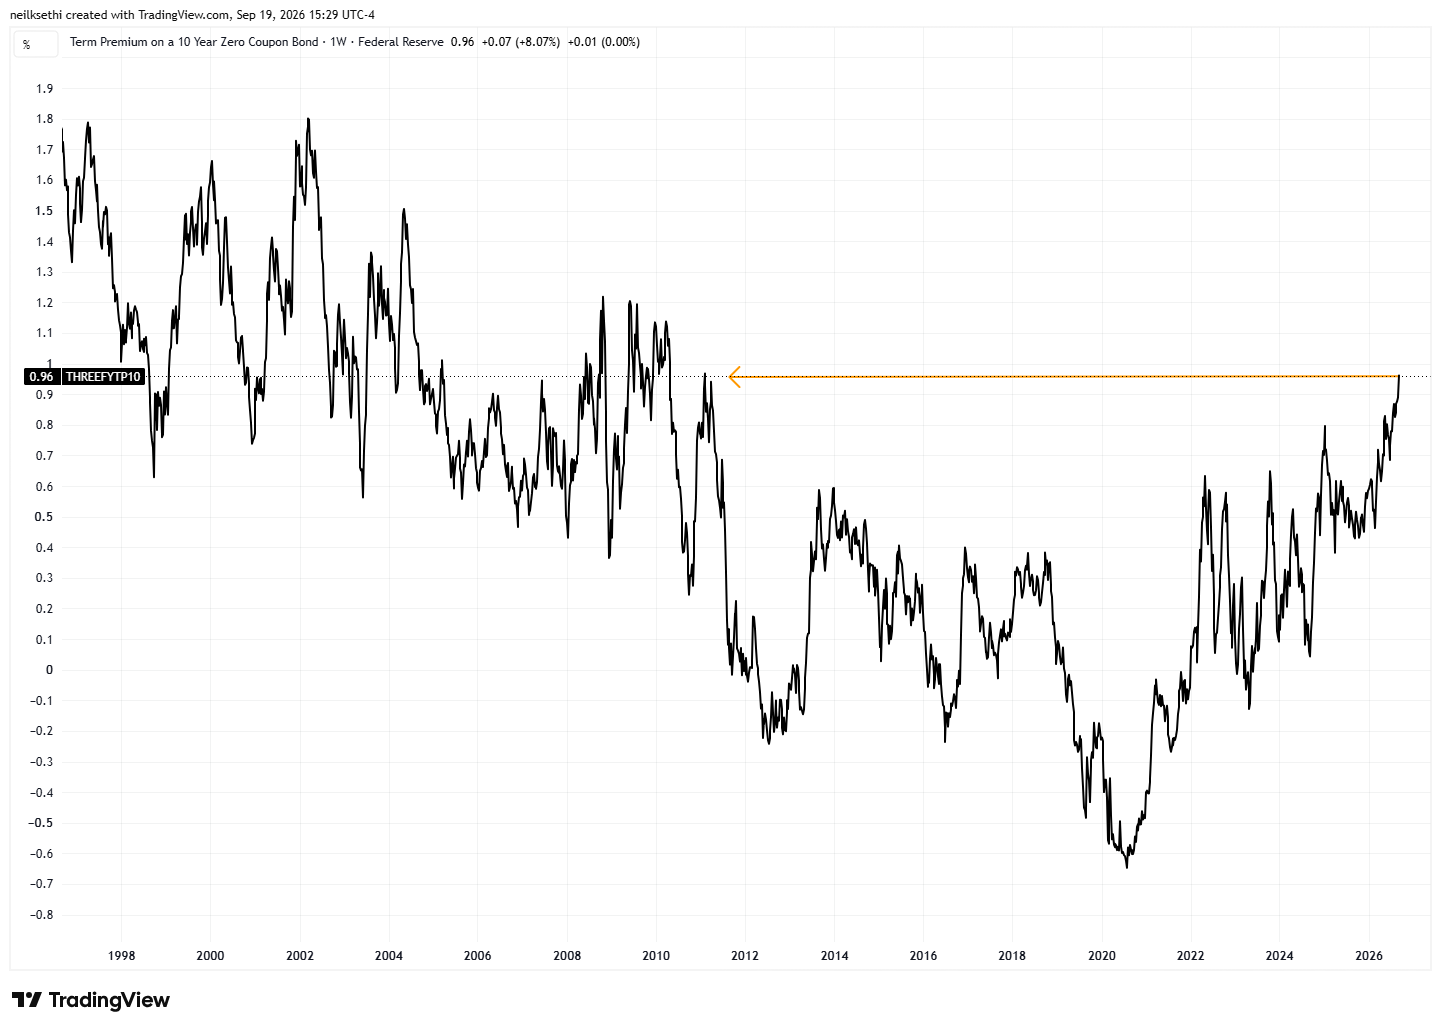
Which leaves term premium (extra yield investors demand to hold a longer-term bond instead of continually rolling over short-term bonds for the same period) as the main source of pressure with the Kim-Wright model for the 10-year now the highest since 2010 outside of one week in February 2011.
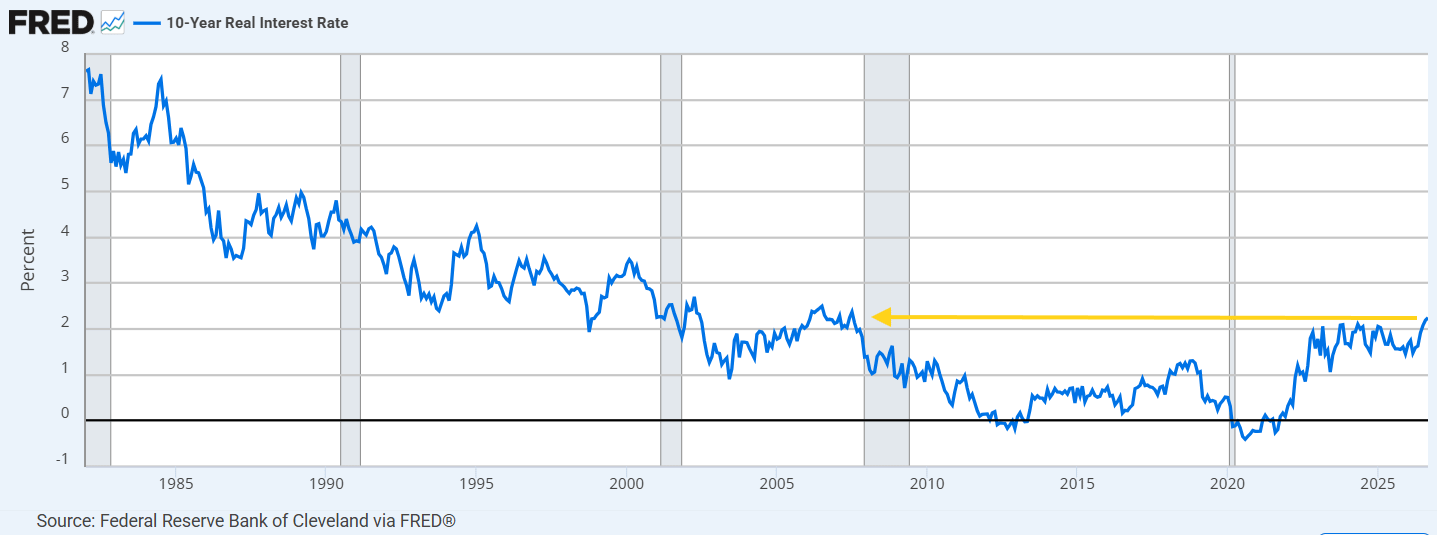
Seeing real rates push to the highest since 2007 at 2.24%. While this doesn’t mean much to the hyperscalers of the world, it does mean Main Street is facing the most restrictive rates in nearly two decades.
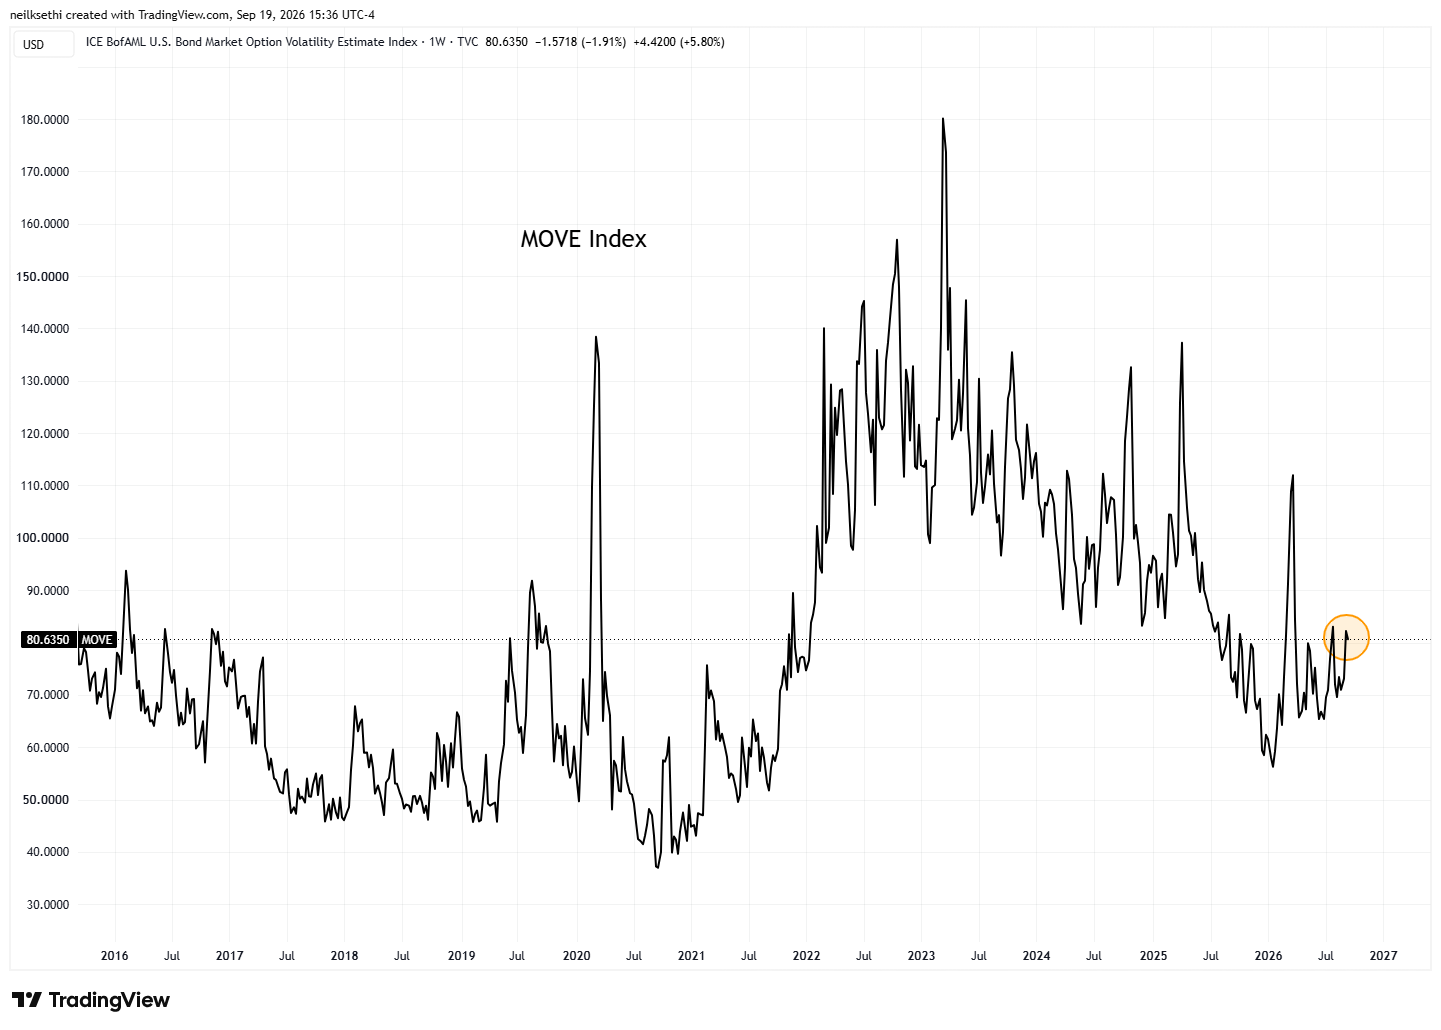
And while it remains well off the highs of the year, the MOVE index of expected 30-day Treasury volatility remains around the highest since July.
Overall, on yields, for now we remain in my new ranges established at the start of August but we’re at the very top for the 2-year and 10-year: “I still think that 5% on the 10-year and 5.75% on the 30-year represent areas where we will see very strong buying. On the 2-year I think a lot depends on whether the Fed hikes. If they do, there’s potentially another ~30 basis points to the upside (~4.75%). If they don’t, I think we’re going lower from here.”
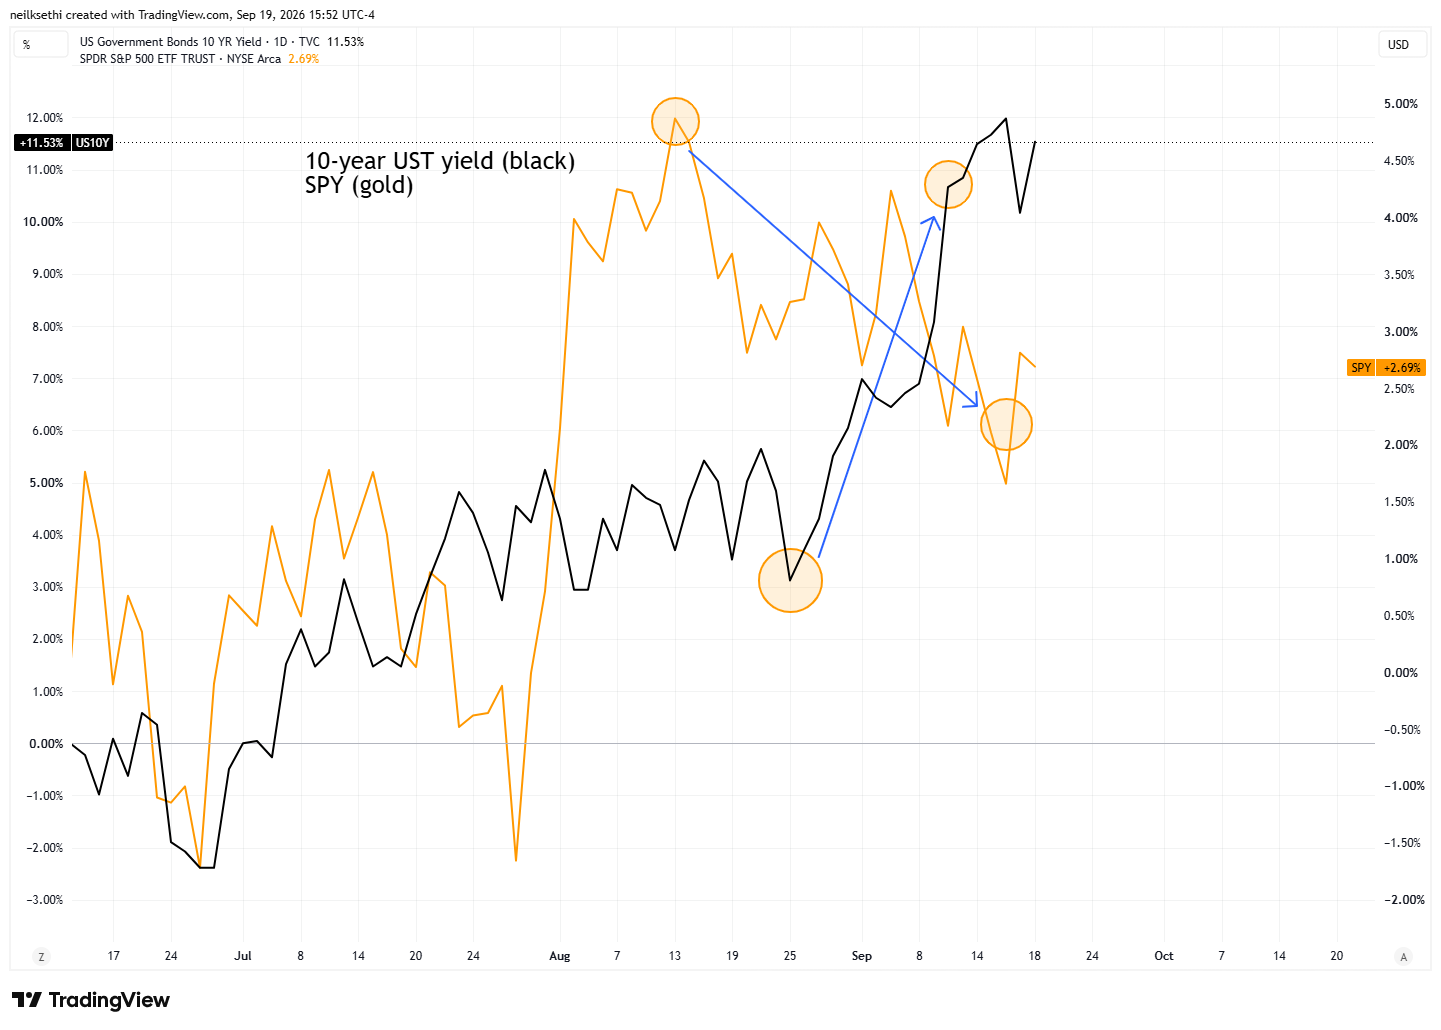
I mentioned last week that the last time yields saw 5% it catalyzed a 6% pullback in the SPX. This time we’re just 2% off the highs.
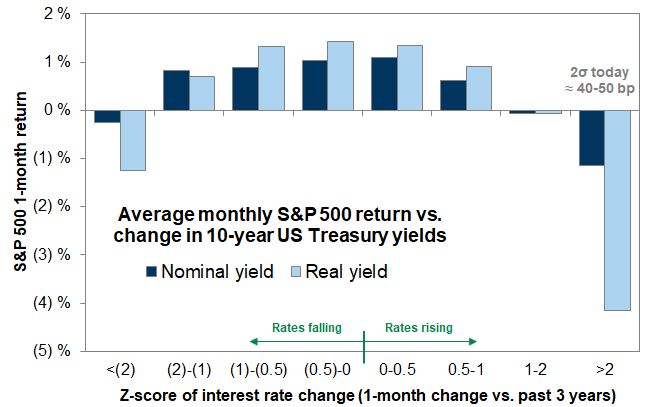
And I mentioned last week Goldman’s analysis that
interest rate volatility matters for equities.Stocks typically struggle to digest sharp increases in bond yields. During the past few decades, stocks have usually generated positive returns alongside rising interest rates unless the pace of rising rates exceeded 2+ standard deviations. Today, a 2 standard deviation move in 10-year Treasury yields would equate to about 50 bp over a month or 30 bp over two weeks. The speed of the rate moves during the last few weeks helps explain why stocks struggled to digest those changes.
Exhibit 8: Equities typically struggle to digest sharp increases in bond yields
Source: Goldman Sachs Global Investment Research
And while it was two days over two weeks, we did see a 34 basis point move from August 25th through September 10th, while the SPX fell -3.4% from August 13th through September 16th.
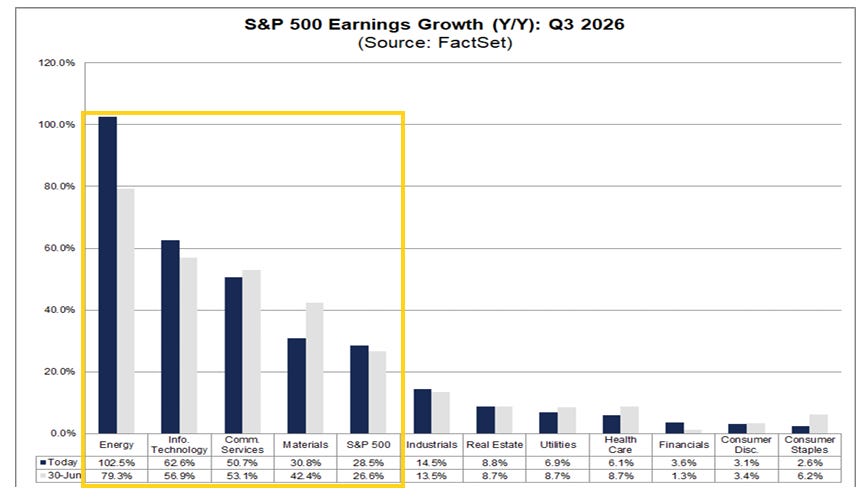
Looking at Q3, at this point analysts are still expecting a third consecutive quarter of 25%+ y/y earnings growth with the Q3 estimate at +28.9% (+0.2% w/w). As in Q2, Energy is expected to lead at +109.6% y/y growth (up from +79.3% at the start of the quarter (July 1st)), followed by Tech +63.3%, Comm Services +51.0%, and Materials +30.4%.
Unlike Q2 no sector is expected to have negative y/y growth with Staples the least at +2.5% (down from +6.2% at the start of the quarter).
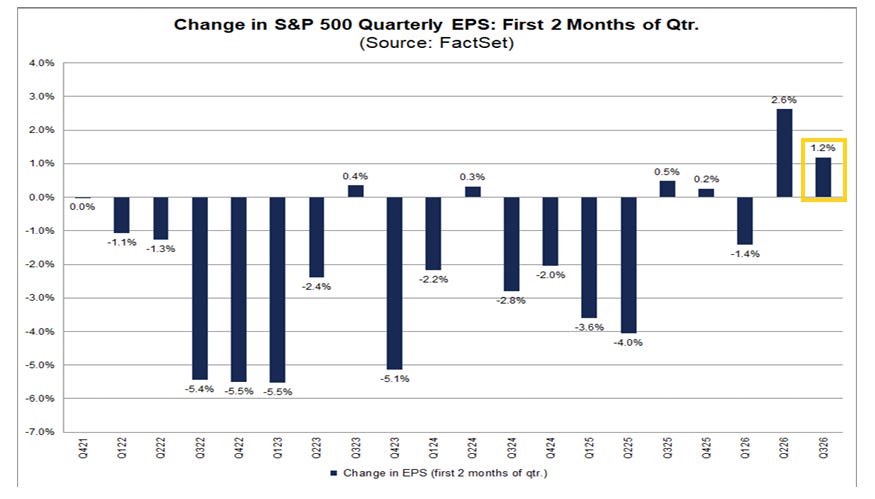
Factset noted two weeks ago thatearnings expectations for Q3 have risen 1.2% since the start of the quarter (July 1st). That’s now 1.6%. While not as large as we saw for Q2, (+2.6%), it is otherwise the most in over five years and compares to a 5-year average of -1.7% and 10-year average of -1.2%.
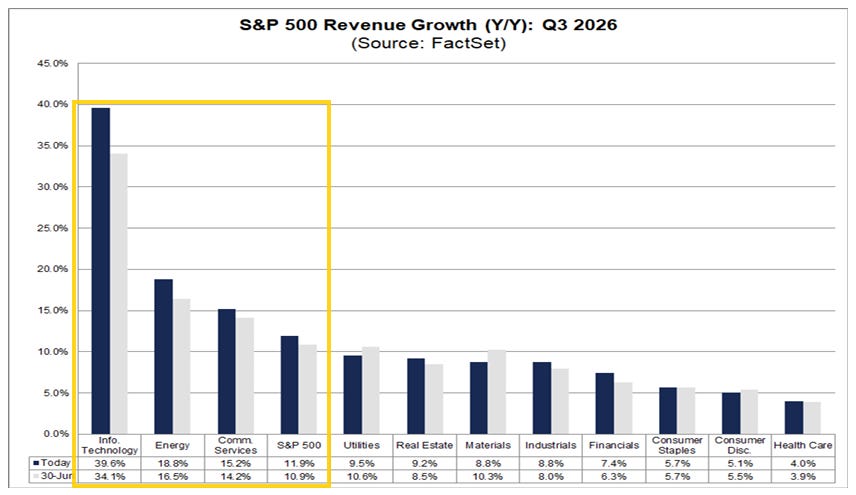
Q3 revenue growth is expected at a likewise stellar +11.9%, down from +15.5% in Q2, which though was the best since Q4 2021 (16.1%). It would mark the third consecutive quarter of double-digit revenue growth for the index.
Expectations are led by Tech (+39.6%), Energy (+18.8%), and Communications (+15.2%).
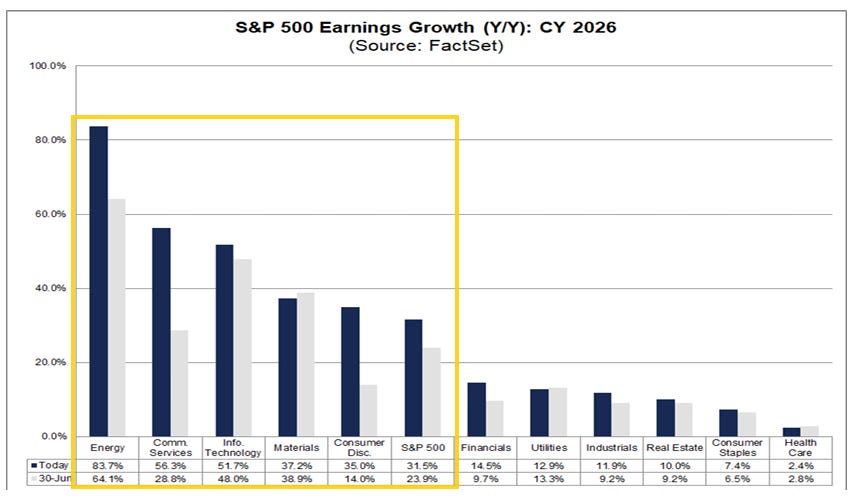
2026 SPX earnings growth expectations also continue to march higher now at +31.8% (+0.2% w/w), up from +25.4% on June 30th, +17.1% on March 31st, and over double the +14.8% at the start of the year.
As in 2025, Tech is a leader with y/y earnings growth of +52.1% (up from +28.6% at the start of the year) but Energy will exceed that (on a percentage basis) at +88.2% (up from +6.4% at the start of the year) along with Communications +56.7%. Those sectors along with Materials (+37.2%) and Consumer Discretionary (+35.3%) represent the five sectors expected to come in above the SPX average.
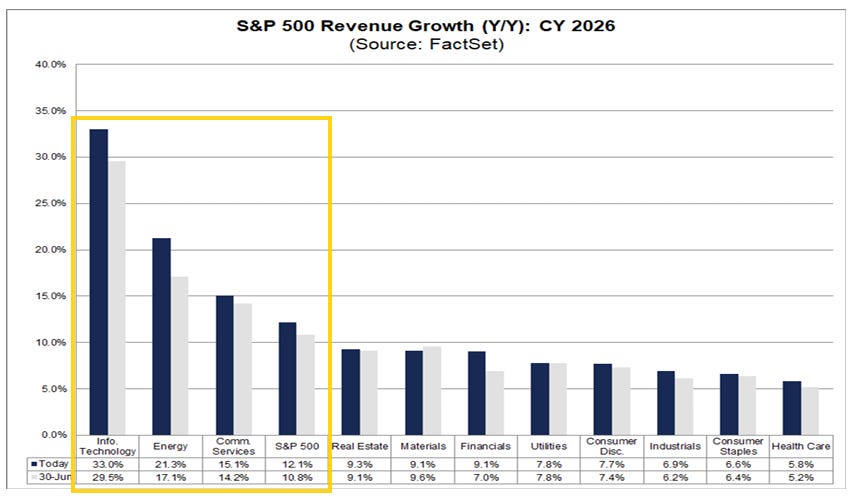
2026 revenues are now expected at +12.1% growth up from +7.3% at the start of the year and +10.8% June 30th led by Tech (+33.0%), Energy (+21.3%) and Communications (+15.1%).
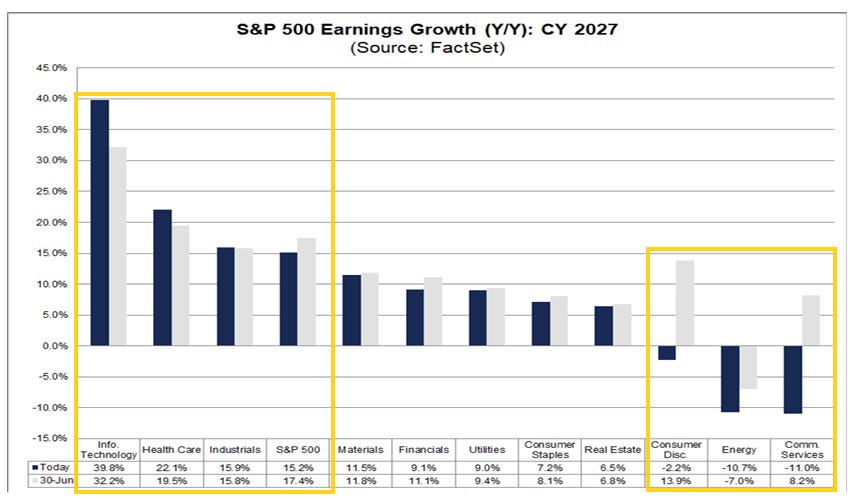
And 2027 earnings are expected to be up another +15.2% (+0.1% w/w) on top of the elevated 2026 results, which is down though from +17.4% as of June 30th as analysts are not carrying over all (but still most of) the boosts in 2026 earnings to next year. That’s also down from +16.5% at the start of the second quarter (Apr 1st). Still it’s a double digit advance on top of what is expected to be a 30%+ gain in 2026. That would also represent a fourth straight year of double-digit earnings growth for the S&P 500, something we’ve rarely seen.
2027 is expected to be led again by Tech (+39.8%, +0.3% w/w, up from 24.6% at the start of the second quarter (April 1st) despite the huge increase in 2026 estimates) followed by Health Care (+22.1%) which is expected to see a big turnaround after lagging in 2026. Industrials (+15.9%) is also above the SPX average.
With hyperscaler investment gains (in Anthropic, OpenAI, etc.) expected to slow, the sectors that have seen the biggest boosts from that are now expected to see negative y/y growth (Comm Services (-11.0% from +8.2% at the start of the third quarter) and Consumer Discretionary (-2.2% from +13.9%)) along with Energy (-10.7%).
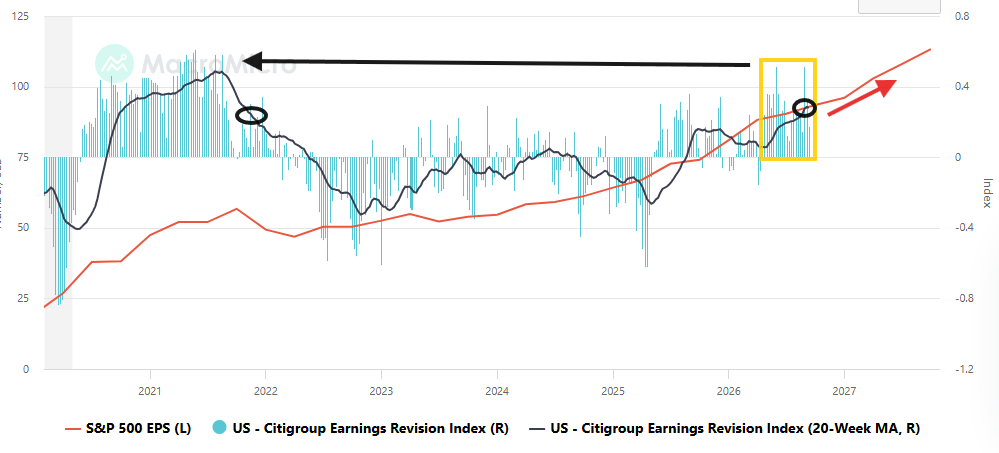
And earnings expectations continue to be supported by very strong earnings revisions although easing back for a second week in the week of September 11th from the joint highest (with May 29th) since August 2021 hit two weeks ago. Still that continues a now 21-week streak of positive revisions, something we also haven’t seen since late 2021 into early 2022.
As a result, the 20-week moving average (black line) eased back a touch from the best since October 2021, as 12-month out EPS estimates (red line) continue to rise to new highs, as they’ve done each week since the turn of the year.
And here is Ed Yardeni from this weekend touching on these topics (note though his dubious view of longer term earnings expectations):
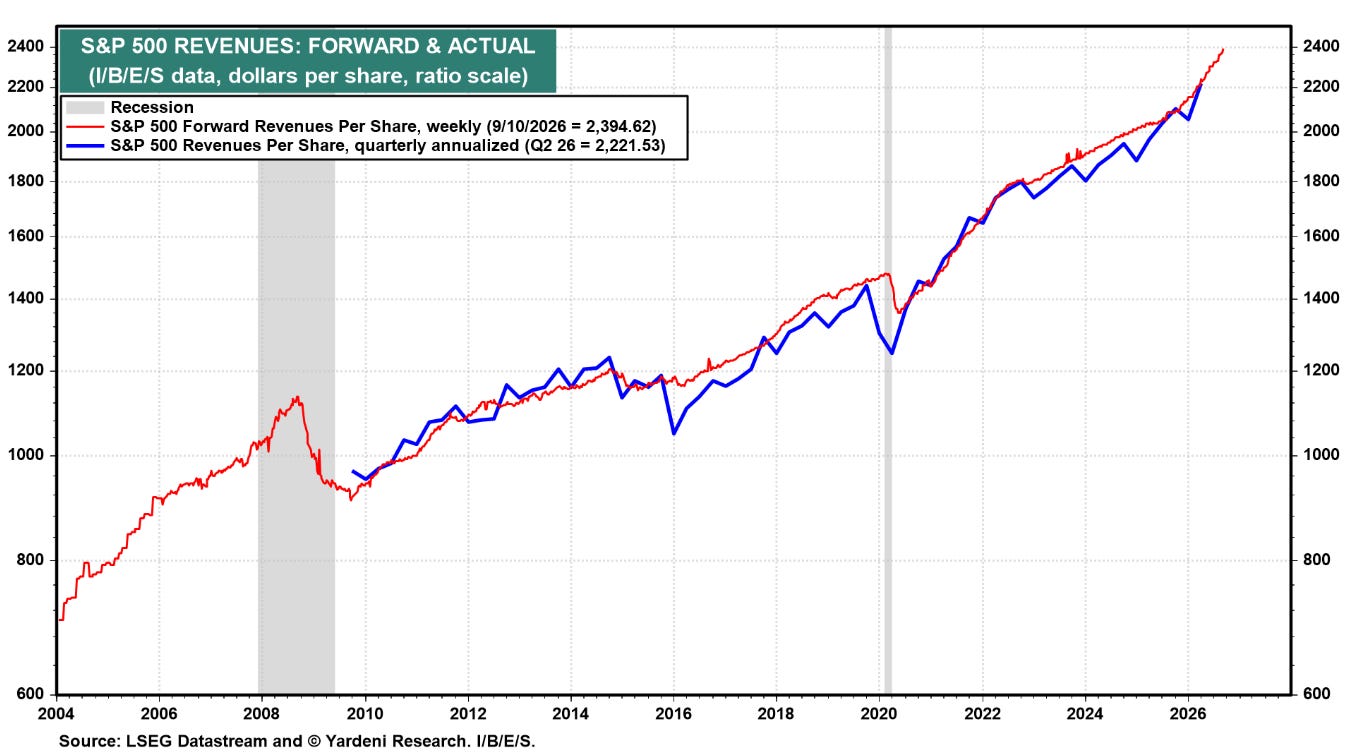
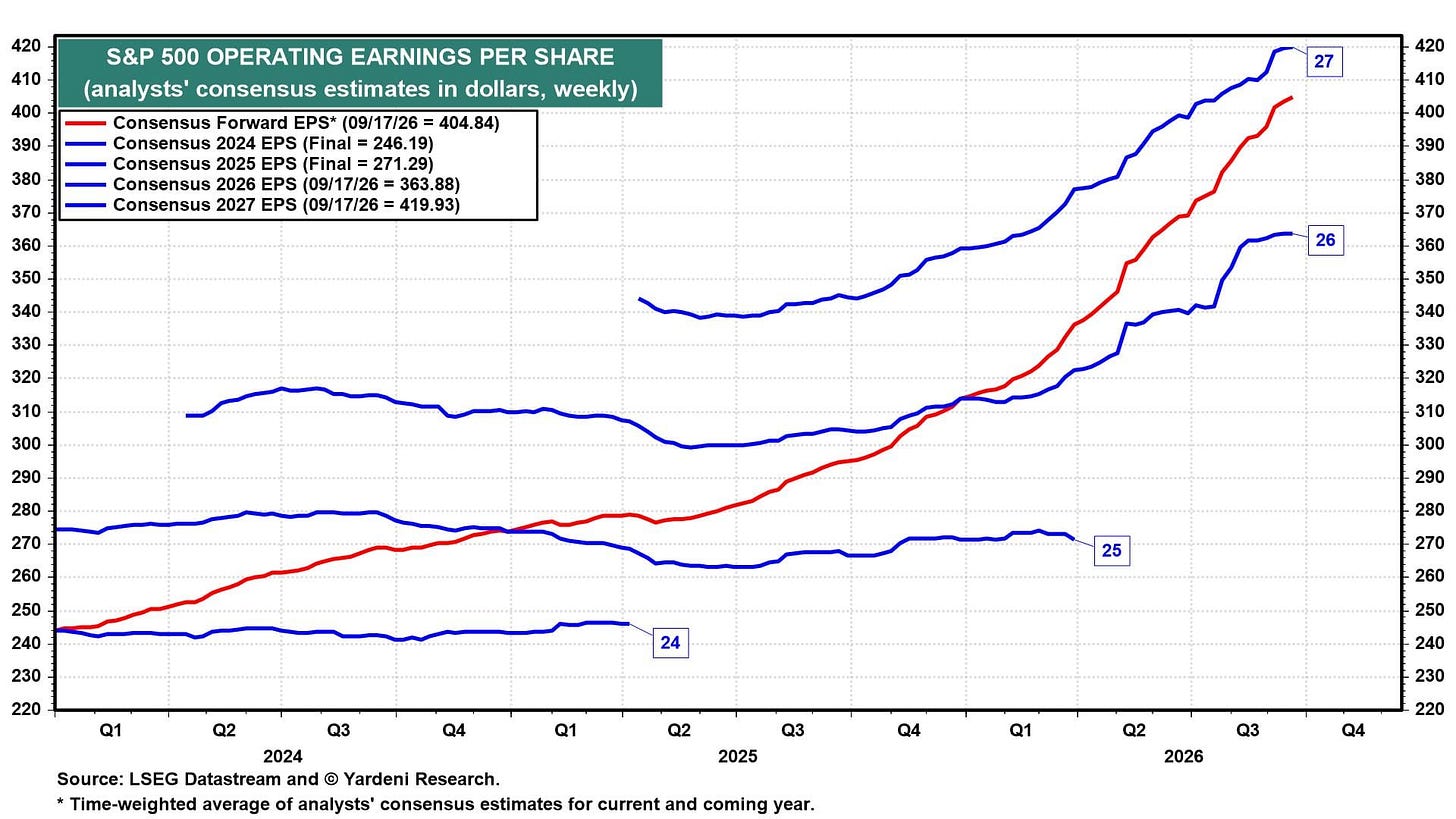
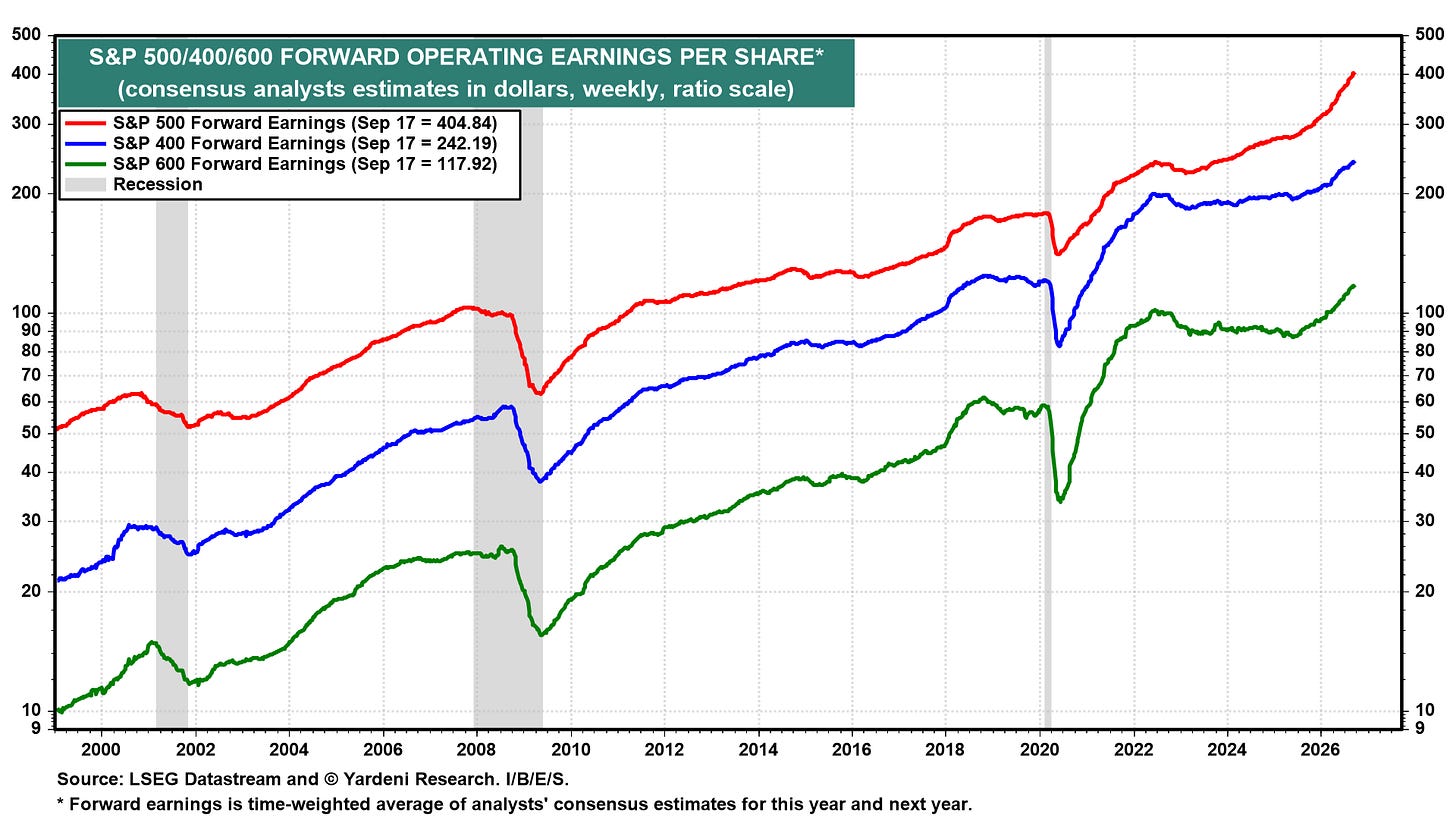
S&P 500 companies’ forward EPS rose to a record $404.84 last week (chart). The analysts’ consensus 2027 EPS estimate is up to $419.93. We expect it to keep climbing to $425 by year-end, which would put forward EPS at $425 too.
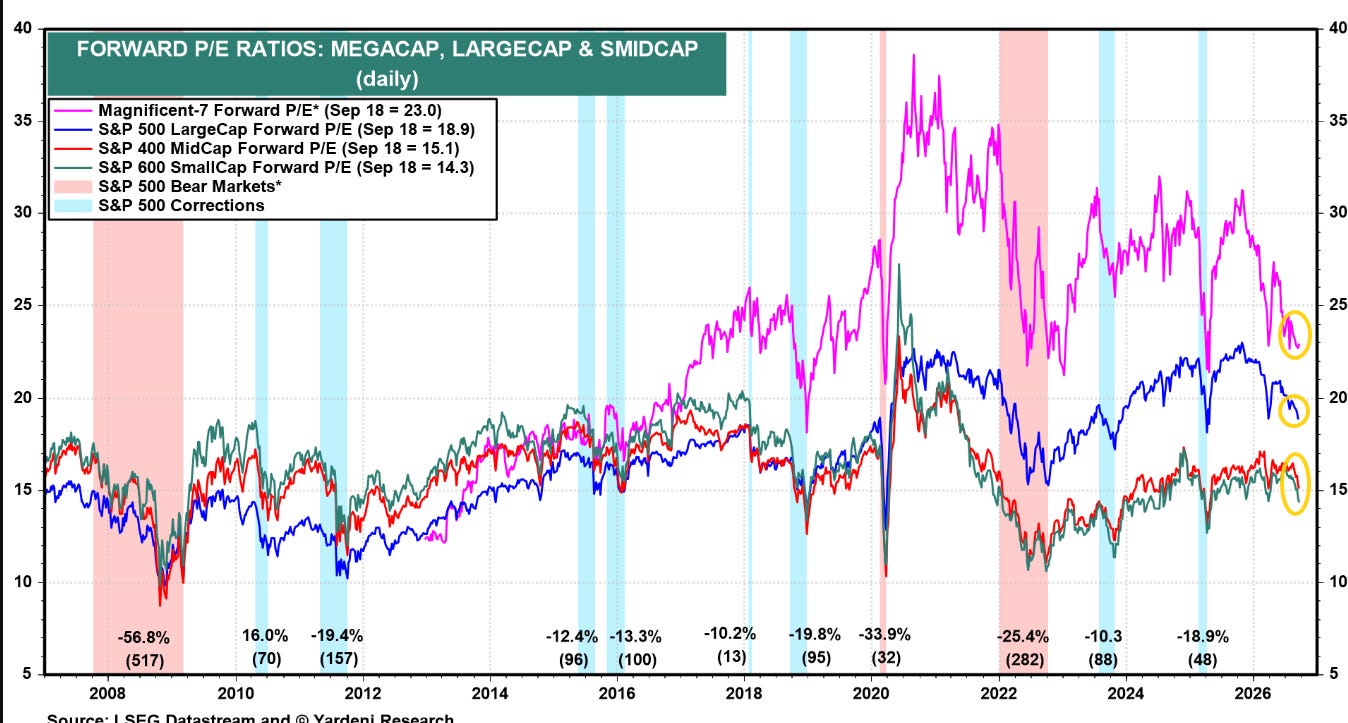
Multiplying that forward EPS target by a forward P/E of 18.6 yields our year-end target of 7,900. To get to 8,400 by year-end, the forward P/E would have to rise to 19.8. The current forward P/E is 18.9.
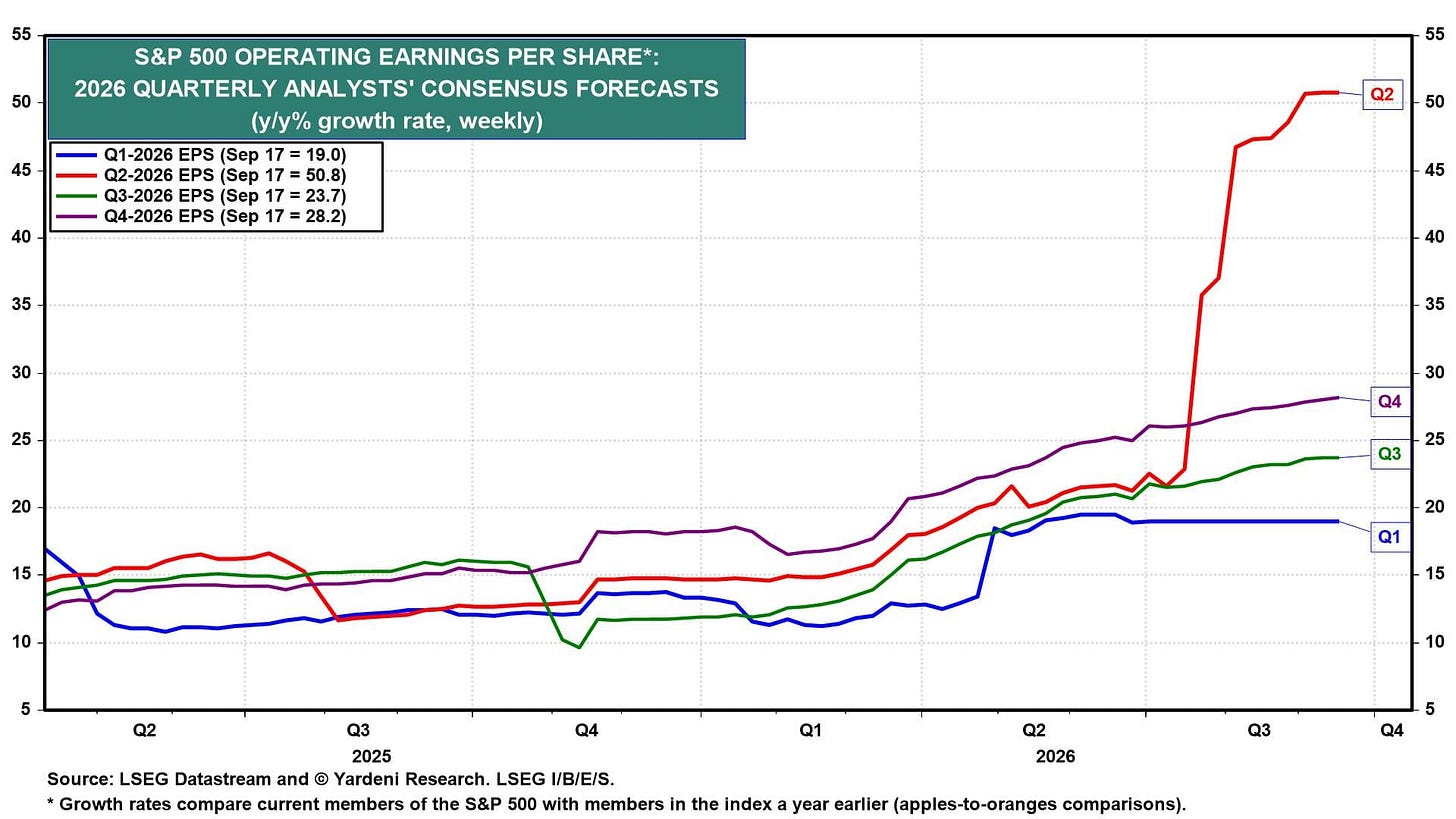
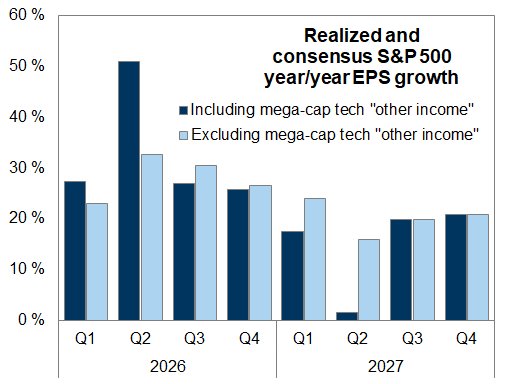
The Q3-2026 earnings season starts in early October. Analysts project 23.7% y/y growth for Q3 and 28.2% for Q4 (chart). Both estimates continue to rise. Q2’s 50.8% jump included huge mark-to-market capital gains; excluding those gains, EPS growth was about half that. Analysts’ estimates for the second half of the year carry no such distortion.
Forward earnings rose to record highs for the S&P 500, S&P 400, and S&P 600 last week (chart). Fabulous earnings momentum (FEMO) isn’t just a LargeCap story.
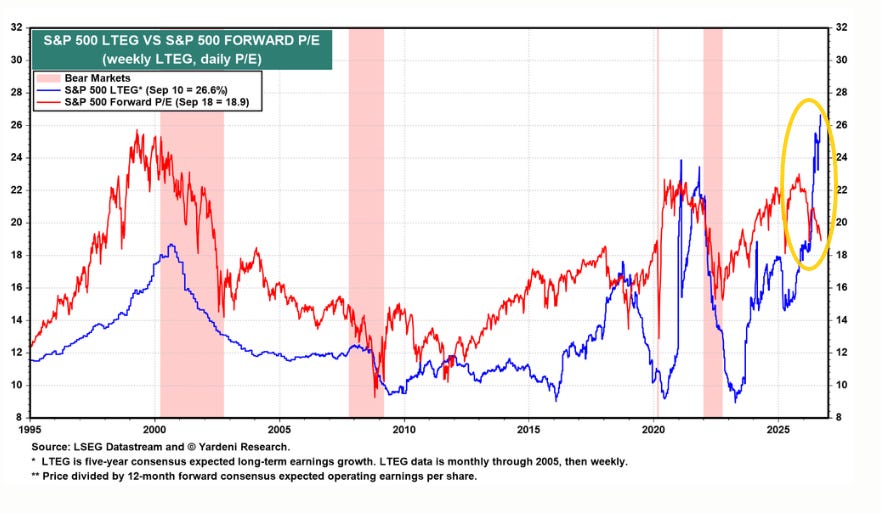
Analysts’ consensus long-term annual earnings growth (LTEG) expectation is up to 26.6%, as analysts have kept raising what they think their companies will earn over the next five years. That’s well above the 18.9 to which the S&P 500 forward P/E has fallen (chart). During the 1999 Tech Bubble, both LTEG and the forward P/E moved higher together and then fell together during the Tech Wreck. Their disconnect now shows that investors aren’t completely buying what analysts are selling.
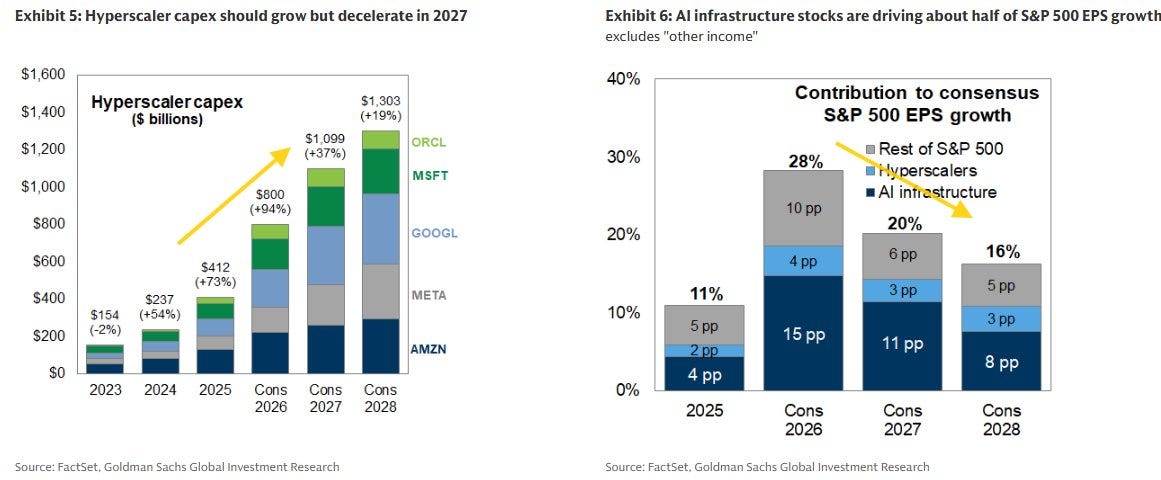
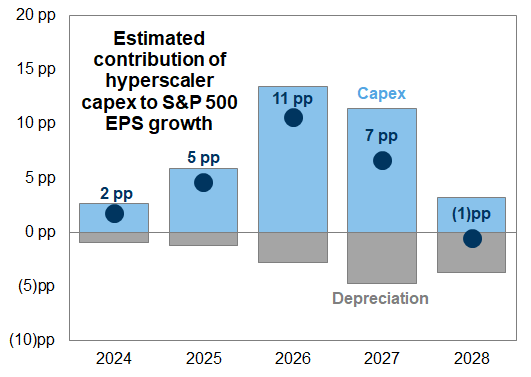
Meanwhile, Goldman this weekend did a deep dive on the AI investment boom noting it will drive nearly half of S&P 500 EPS growth this year, but its contribution will fade going forward while semiconductor margins and “other income” gains should normalize.
The mega-cap US hyperscalers are on track to spend $800 billion on capex this year, an increase of 94% vs. 2025. That spending is flowing through to the earnings of the AI infrastructure complex…The AI boom is also having a secondary impact on earnings outside of the infrastructure complex, for example by boosting capital markets activity and consumer wealth.
Both consensus and GS analyst forecasts show hyperscaler capex growing at a slower rate in coming years, which should result in decelerating earnings growth for much of the AI infrastructure complex and a fading tailwind to S&P 500 earnings.
Hyperscaler depreciation expenses will continue to increase as capex growth decelerates, further dampening the boost of AI investment spending to S&P 500 earnings growth. We estimate a drag from hyperscaler depreciation expenses on S&P 500 earnings growth of 5pp in 2027, offsetting nearly half of the 11pp boost to earnings from capex spending. By 2028, the drag from depreciation should offset the S&P 500 earnings uplift from continued capex spending.
Exhibit 7: Growing hyperscaler depreciation expense should increasingly offset AI capex beneficiary earnings
Source: Goldman Sachs Global Investment Research
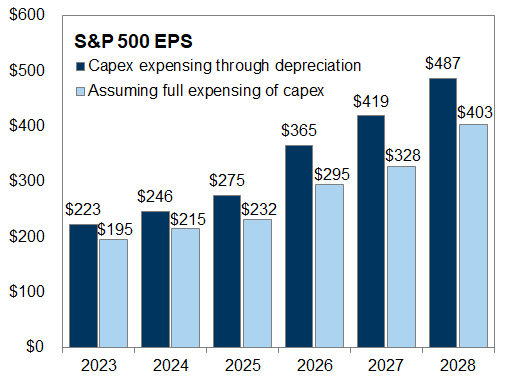
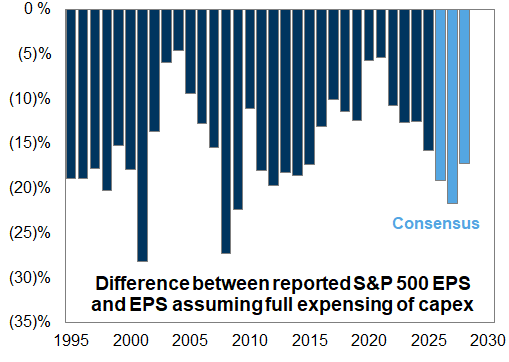
If capex were fully expensed, consensus 2027 S&P 500 EPS would be 22% lower than under current accounting rules. The current gap between actual reported and hypothetical fully-expensed earnings is one of the widest in recent decades, exceeded only as earnings fell more quickly than capex during the recessions of 2001 and 2008.
Exhibit 8: Fully expensing capex would reduce 2027 EPS by 22%
2026-2028 reflects consensus forecasts
Source: Goldman Sachs Global Investment Research
Exhibit 9: The AI capex boom is creating an unusually large gap between actual and hypothetical fully-expensed EPS
Earnings fell more rapidly than capex during the recessions of 2001 and 2008, driving a large gap between actual and fully-expensed hypothetical EPS.
Source: Goldman Sachs Global Investment Research
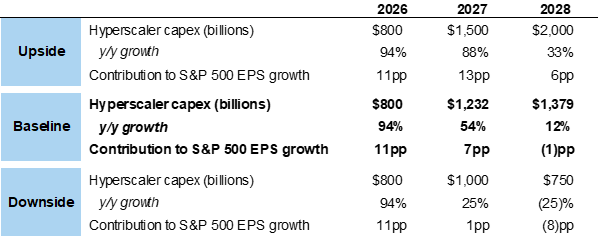
Hyperscaler capex has consistently surprised relative to consensus estimates during the last few years, and the potential for additional surprises going forward creates a wide range of potential S&P 500 earnings outcomes.…We estimate that hyperscaler capex would need to decline by roughly 30%, to $570 billion, to offset earnings growth for the rest of the S&P 500 in 2027. This decline would reduce earnings for the AI infrastructure complex by about 40%, leaving their profits about 25% above 2025 levels.
Exhibit 10: Hyperscaler capex scenarios and contribution to S&P 500 earnings growth
Source: Goldman Sachs Global Investment Research
Semiconductor margin expansion
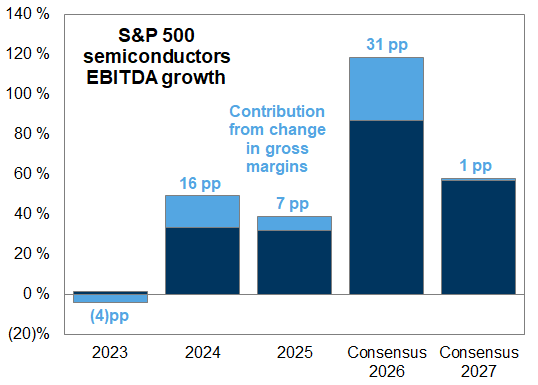
Margin expansion has accounted for a large share of recent semiconductor earnings growth, but that boost should fade going forward. We estimate that about 1/4 of S&P 500 Semiconductor earnings growth in 2026 is being driven by gross margin expansion. Our equity analysts believe the balance of memory supply and demand is likely to remain tight through 2027, with incremental supply additions unlikely to impact industry margins until 2028 at the earliest. However, they expect the rate of incremental margin expansion to slow meaningfully next year, reducing the contribution of semiconductors to S&P 500 earnings growth.
Exhibit 13: Gross margin expansion is driving about 1/4 of semiconductors earnings growth in 2026
Source: FactSet, Goldman Sachs Global Investment Research
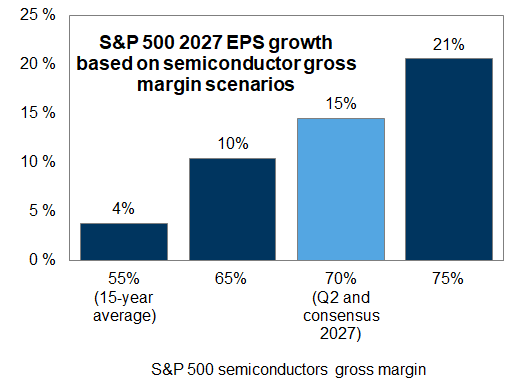
S&P 500 earnings growth in the next few years will be highly sensitive to the trajectory of semiconductor margins. In a scenario where slowing AI infrastructure investment, increasing supply, and/or technological shift lowers semiconductor prices and profit margins, S&P 500 EPS growth would also disappoint. We estimate that each percentage point change in S&P 500 semiconductor gross margins next year would shift S&P 500 EPS growth by about 1 pp.
Exhibit 14: S&P 500 earnings growth is sensitive to the path of semis margins
excludes “other income”
Source: FactSet, Goldman Sachs Global Investment Research
“Other income” from private investment gains
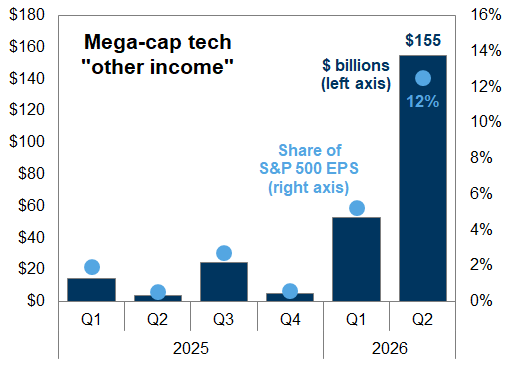
Appreciating equity investment stakes are also temporarily inflating S&P 500 earnings. Mega-cap tech earnings have recently been boosted by large GAAP “other income” related to their equity investments. In Q2 2026, the mega-cap tech companies enjoyed unrealized investment gains in private companies that totaled roughly $150 billion, translating into 12% of S&P 500 EPS. We expect H2 2026 reports will include additional “other income” that should be larger than the gains in Q1 but smaller than Q2 totals. We expect a much smaller contribution in 2027. The complete removal of this “other income” next year would create a drag of 8 pp on S&P 500 earnings growth in 2027 relative to 2026, all else equal.
Exhibit 15: “Other income” has risen as a share of S&P 500 earnings
Source: Goldman Sachs Global Investment Research
Exhibit 16: S&P 500 EPS growth will appear to decelerate sharply in Q2 2027 due to “other income” this year
Source: FactSet, Goldman Sachs Global Investment Research
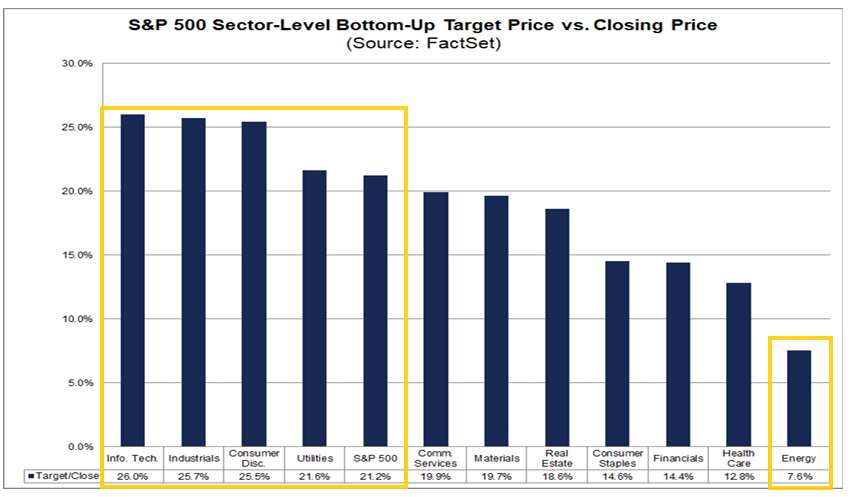
Analysts meanwhile collectively continue to think that the S&P 500 has a lot of upsidewith FactSet’s compilation of analyst bottom-up SPX 12-month price targets up to 9,260 (+9pts w/w, ~965 pts since March 31st, ~+2,140 pts since Thanksgiving, and ~+3,090 pts since July 1, 2025) although that’s slowed as is typical in between earnings seasons. That would be +21.2% from Thursday’s close.
Tech (+26.0% down from +27.5% the prior week) remains the sector seen with the biggest upside, followed by Industrials (+25.7%), Consumer Discretionary (+25.5%), and Utilities (+21.6%). On the other side Energy (+7.6%) remains the sector with the least upside and the only not expected to see double digit gains over the next year.
As a reminder we started the year with a 12-month bottom-up price target of 8,000 and according to FactSet the last 20 yrs (through 2024) analysts have been on avg +5.9% too high from where they start the year, but they have underestimated it five of the past six years (including 2025 when they saw 6,755 at the start of the year and we ended at 6,845). Currently we’re about 4.6% away.
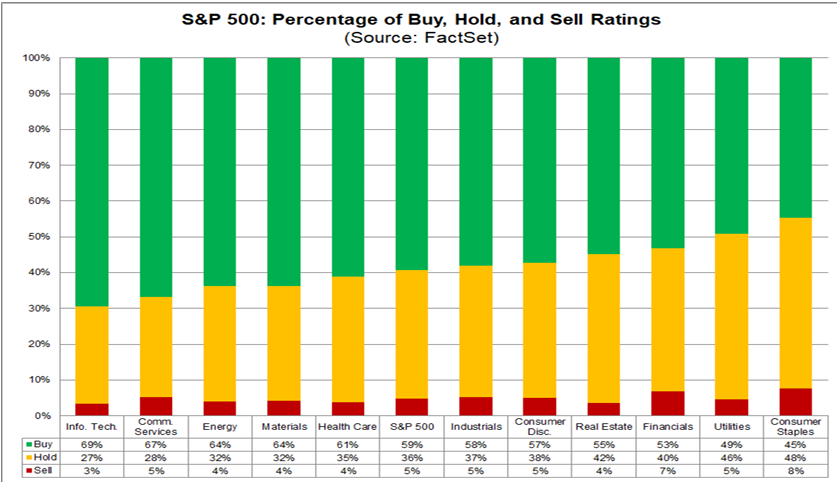
In terms of analyst ratings, buy and hold ratings continue to dominate with buy ratings at 59.3% six tenths below the record high of 59.9% the last week of April. The 5-year month-end average though is 55.8% according to FactSet, so we’re well above that.
Hold ratings are at 35.9%, off the 35.4% record low (to 2009), but well below the 5-year month-end average of 38.7%, with sell ratings at 4.8%, remaining in their narrow range since 2009 but below the 5-year month end average of 5.6%.
Tech leads in buy ratings (69%) while Staples leads in sell ratings (8%).
These numbers have not changed much since the end of July.
Valuations Remain Relatively Attractive But Pressured By Rising Rates
The relatively modest increase in the indices since the start of the third quarter versus the huge increase in earnings expectations has seen valuations (price to next-twelve-month earnings) hit the lows of the year this week across large, medium, and small caps.
Ed Yardeni:
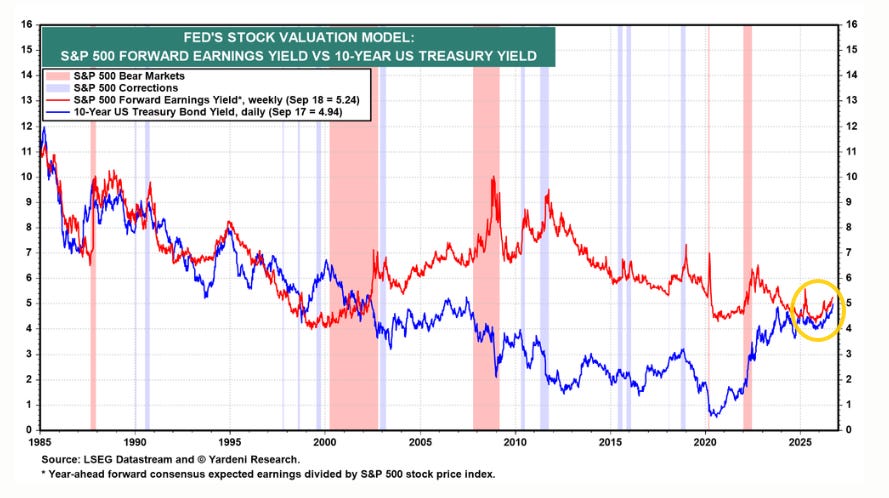
The Fed’s Stock Valuation Model (named as such by Dr. Ed in 1997) is working again (chart). The S&P 500 earnings yield and the 10-year Treasury bond yield are moving in tandem. Rising bond yields are depressing the forward P/E, which is the reciprocal of the forward earnings yield.
In addition to rising bond yields, Ed Yardeni lists a number of other reasons for the pullback in valuations:
Investors want a valuation discount for the known unknowns: How far will the Fed tighten from here? How long will the war last? How high will oil prices and bond yields go? What will the midterm elections deliver? Will the AI labs’ push to slow frontier development slow the capital-spending boom driving earnings? By how much?
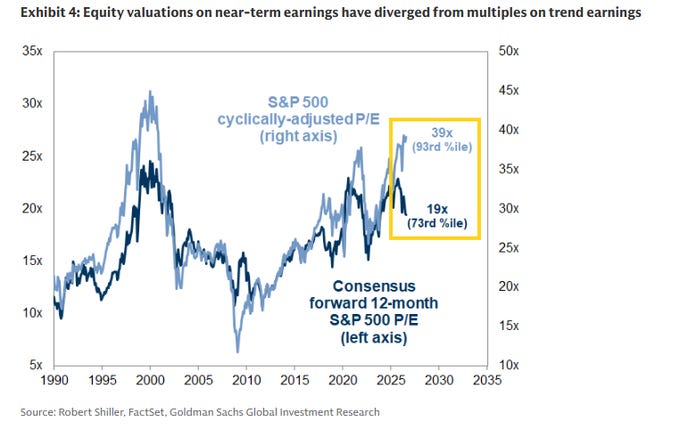
Goldman: The degree to which the US equity market is currently “expensive” depends in large part on the sustainability of recent earnings strength.
The exceptional recent strength of earnings has driven an unusual wedge between equity valuation multiples based on near-term earnings and valuations on trend earnings.
Because equity prices have failed to keep pace with surging earnings, near-term valuations show no hint of a bubble: The S&P 500 12-month P/E ratio has declined from 23x a year ago to 19x today and now matches its 10-year average.
However, even an “average” multiple may be expensive if current earnings are unsustainable. The cyclically-adjusted P/E based on trailing 10-year earnings has climbed to one of its highest levels on record, falling shy of the highs of 1999-2000 but surpassing the level reached in 2021.
Similarly, our colleagues have argued that the increase in market value of AI companies during the last few years requires an optimistic estimate of the future magnitude of AI-related profits and who will capture them.
Affirming investor concerns that US companies are “over-earning,” there are three factors that are boosting earnings today but will contribute to deceleration going forward: 1) AI capex spending, 2) semiconductor margin expansion, and 3) earnings from private investment gains.
The Bad Breadth Gets Worse
Breadth continued to deteriorate, although some metrics are getting into “oversold” levels arguing for a bounce at some point.
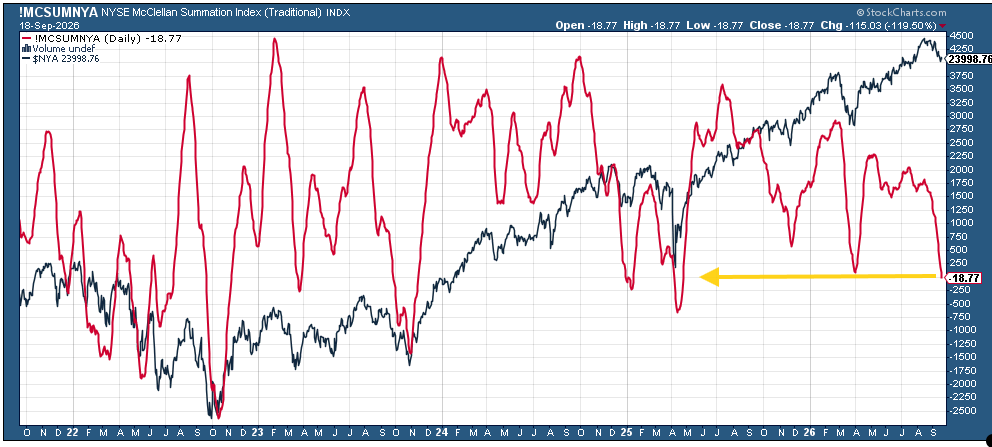
The McClellan Summation Index (red line, broadly whether the typical stock is doing relatively better or worse than the index) has now fallen to negative territory for the first time since the post-liberation day correction. Typically a negative reading is associated with a much larger pullback than what we’ve seen.
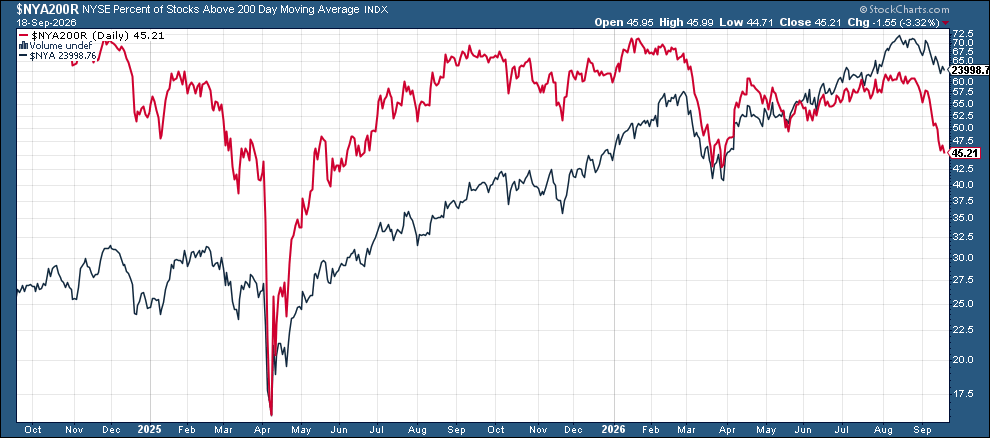
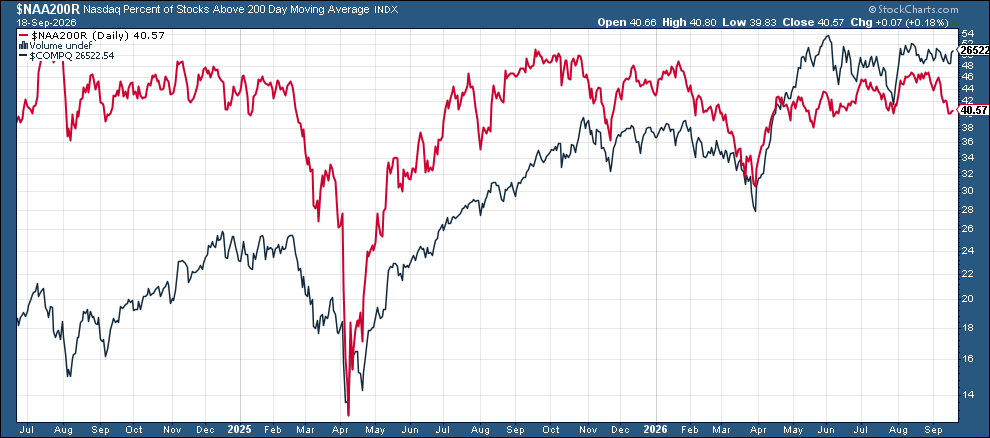
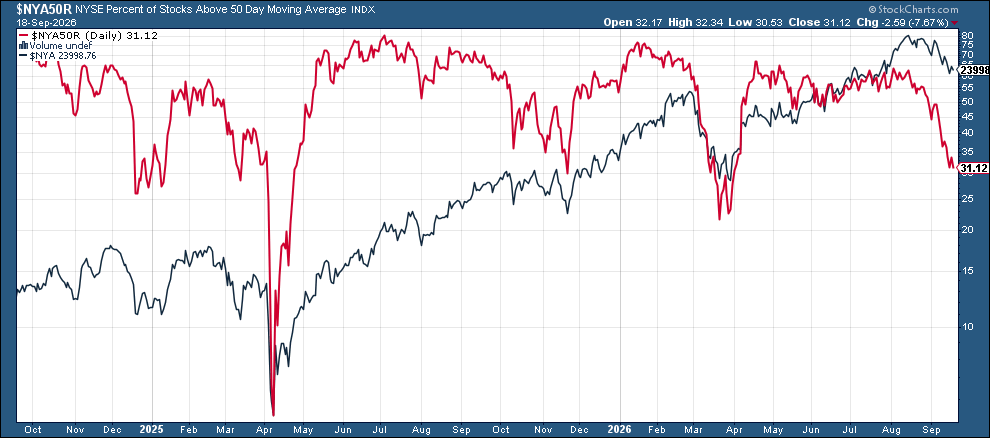
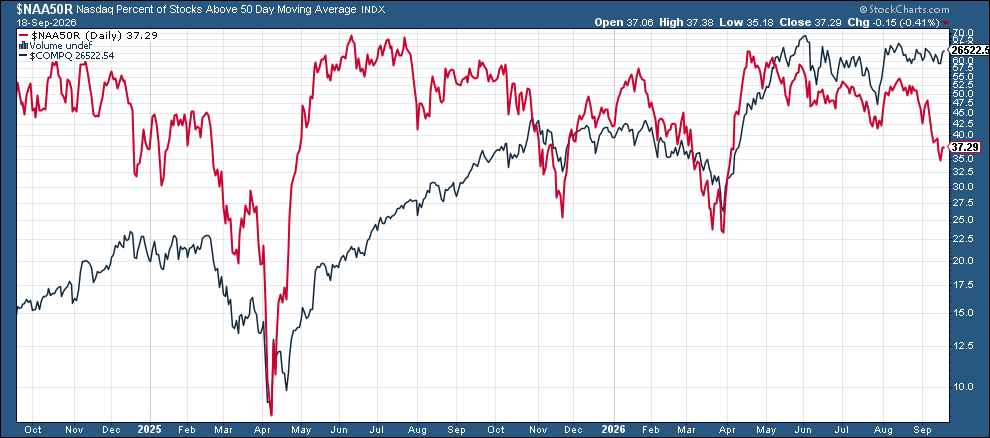
Percentage of stocks over 200-DMAs (red lines), continue to see more deterioration on the NYSE which are approaching the lows of the year. Nasdaq is far from those levels.
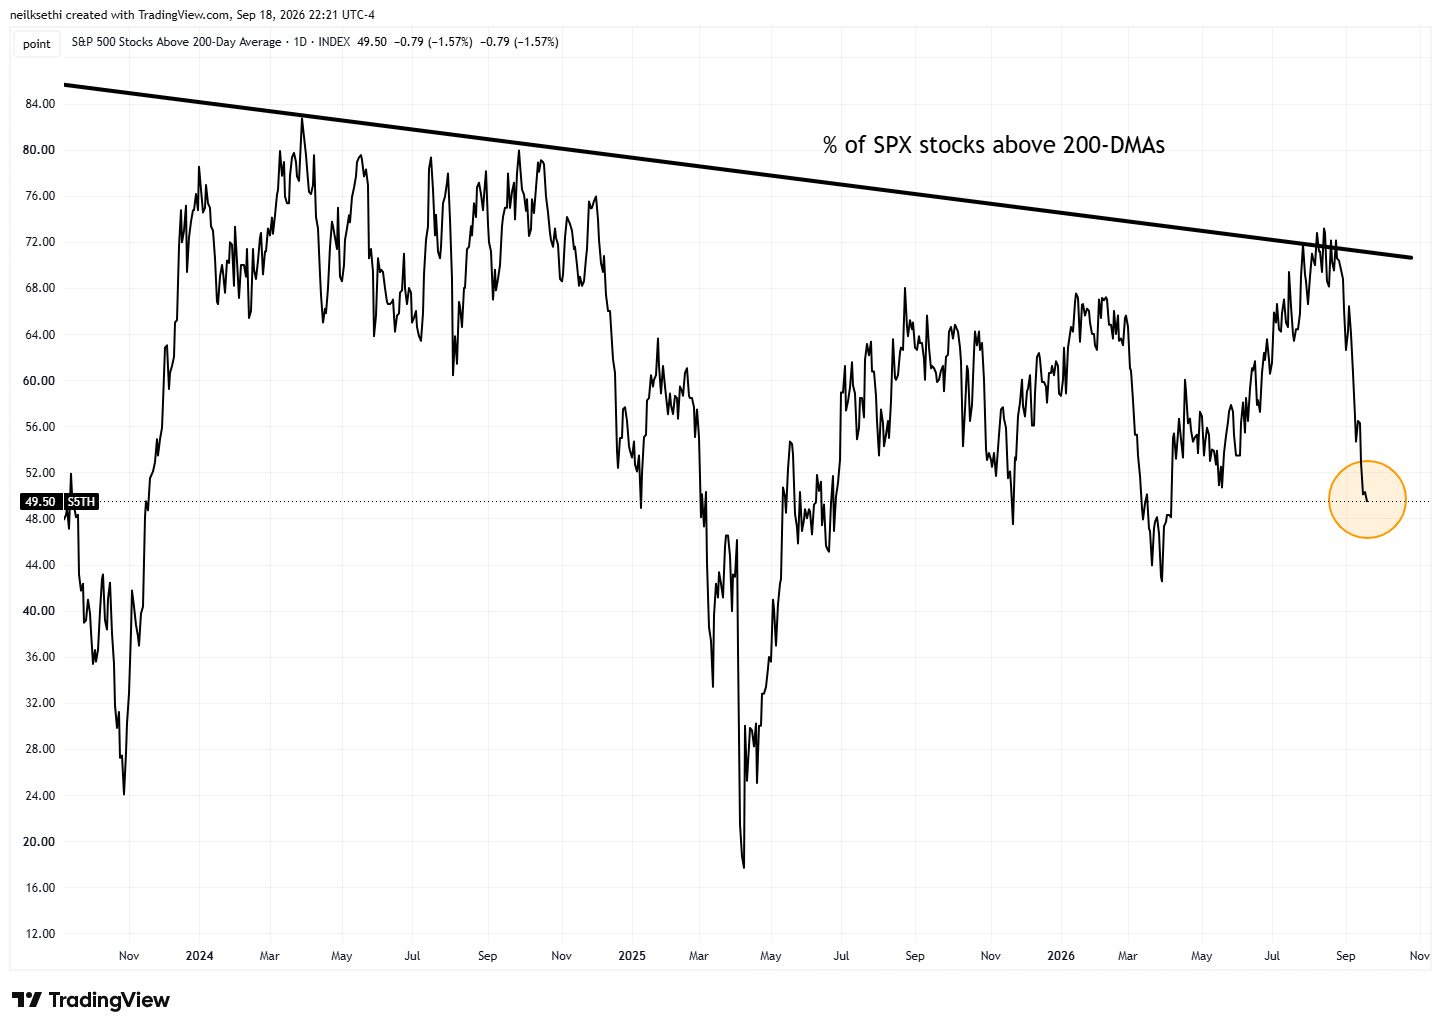
While SPX percent of components above their 200-DMAs fell under 50% for the first time since April:
“The percentage of SPX names > 200 DMA closed at 49% this week,” BTIG’s Jonathan Krinsky wrote. “This is the first time since April ’00 when this closed below 50%, while the SPX itself was at least 4% above its 200 DMA and within 4% of an all-time high.”
“As we discussed yesterday, you just aren’t getting rewarded for buying strength. More and more stocks are breaking support and their 200 DMAs,” he added. “Ultimately we need to see sentiment become less complacent, more oversold conditions, and a higher correlation index decline for us to think this correction has run its course.”
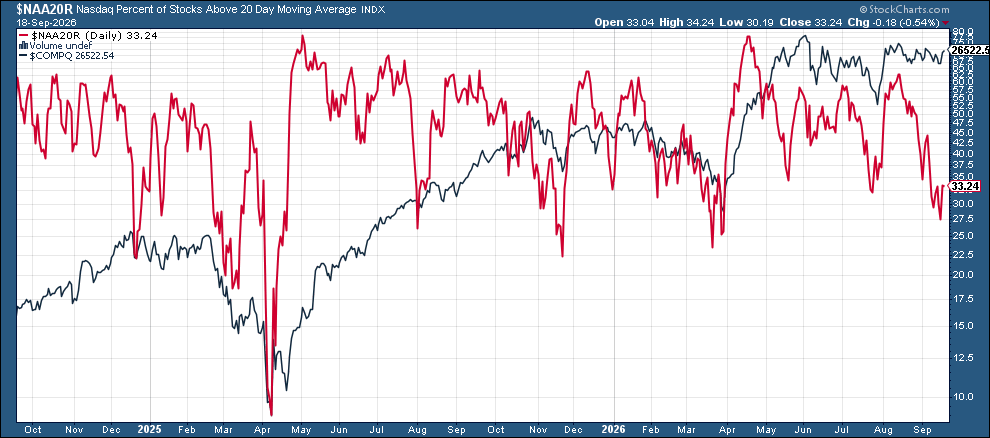
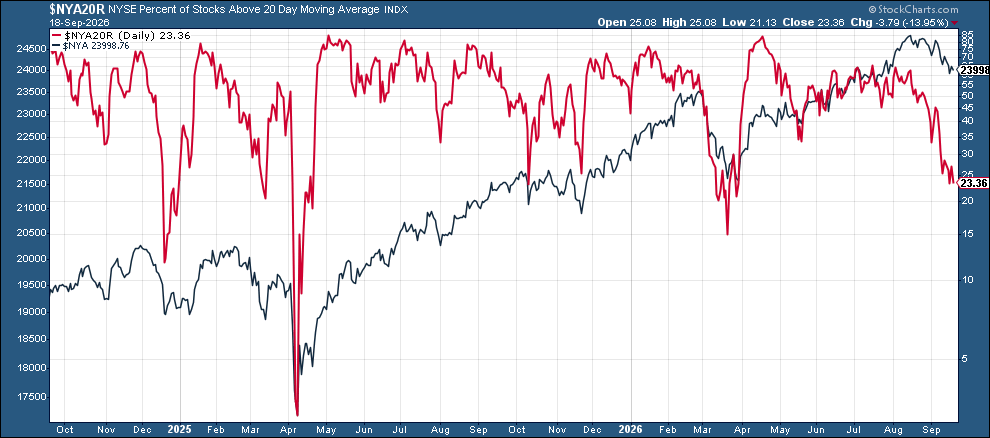
While shorter-term 50 & 20-DMAs got a little bounce this week on the Nasdaq, not so much on the NYSE, after falling to the least since April and March respectively.
50-DMAs
20-DMAs
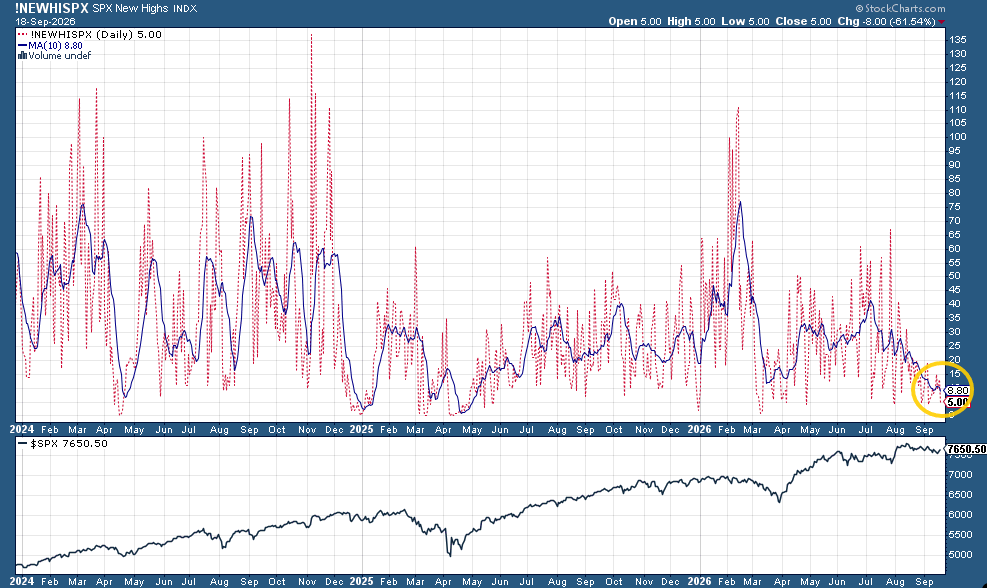
SPX new 52-week new highs minus new lows didn’t breach the 4 from the prior week but didn’t get over 15 either, while the 10-DMA (blue line) is just off the least since May 2025 at just 8.8.
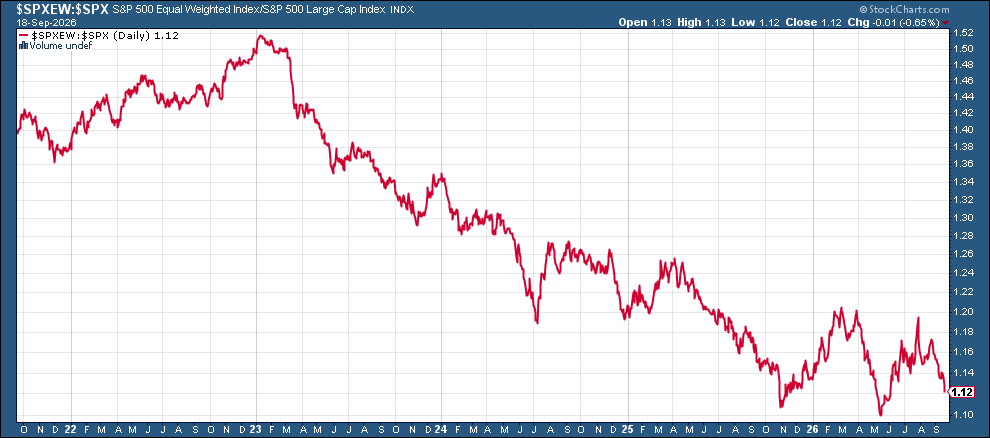
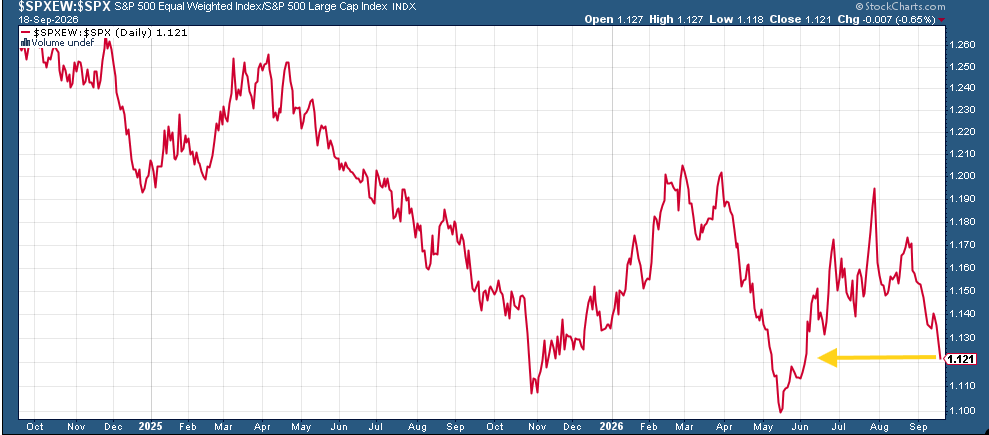
And the ratio of the equal-weight SPX to the cap-weighted continues to drop. Note the May low was the lowest since 2003.
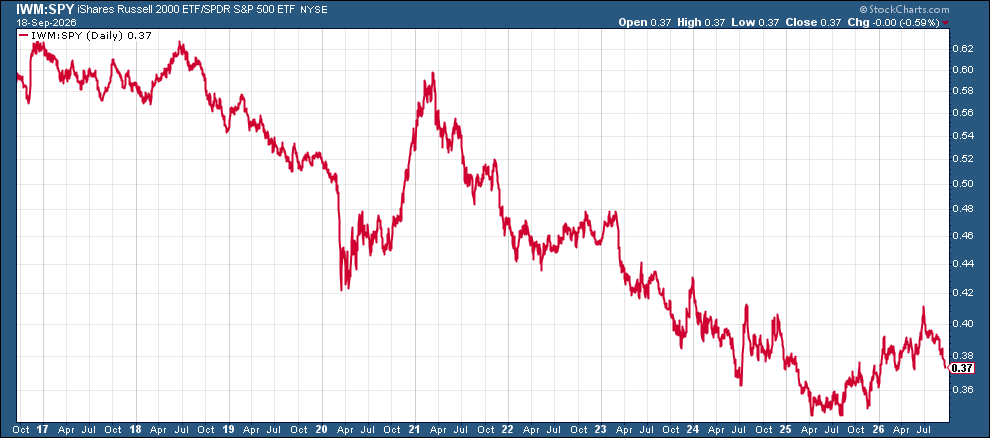
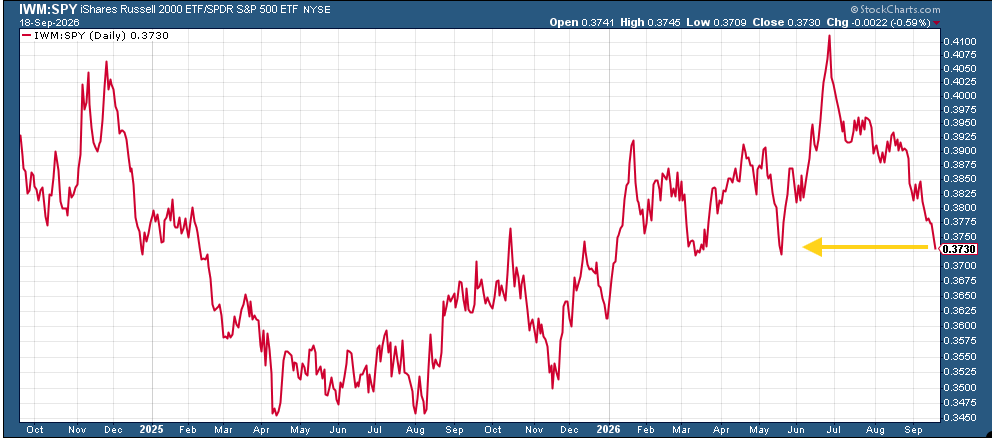
While the ratio of small caps to large caps (Russell 2000 to SPX) is the least since May.
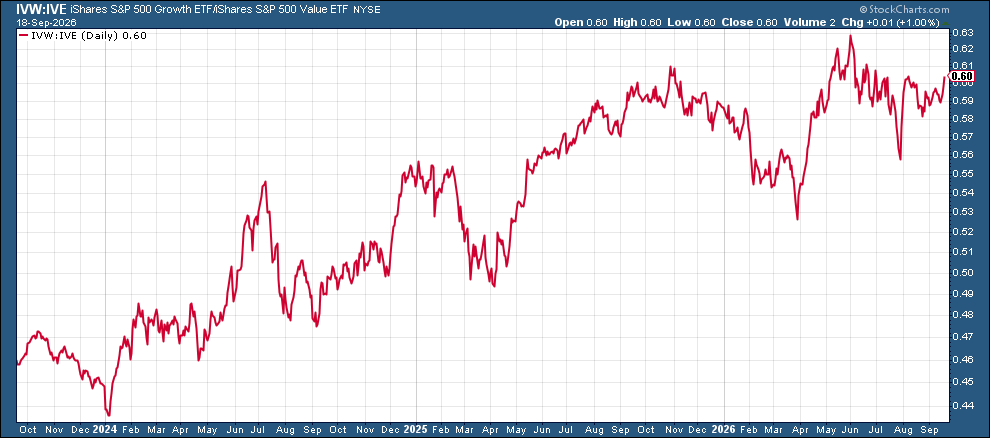
While S&P 500 growth/value remained just off its all-time high from May.
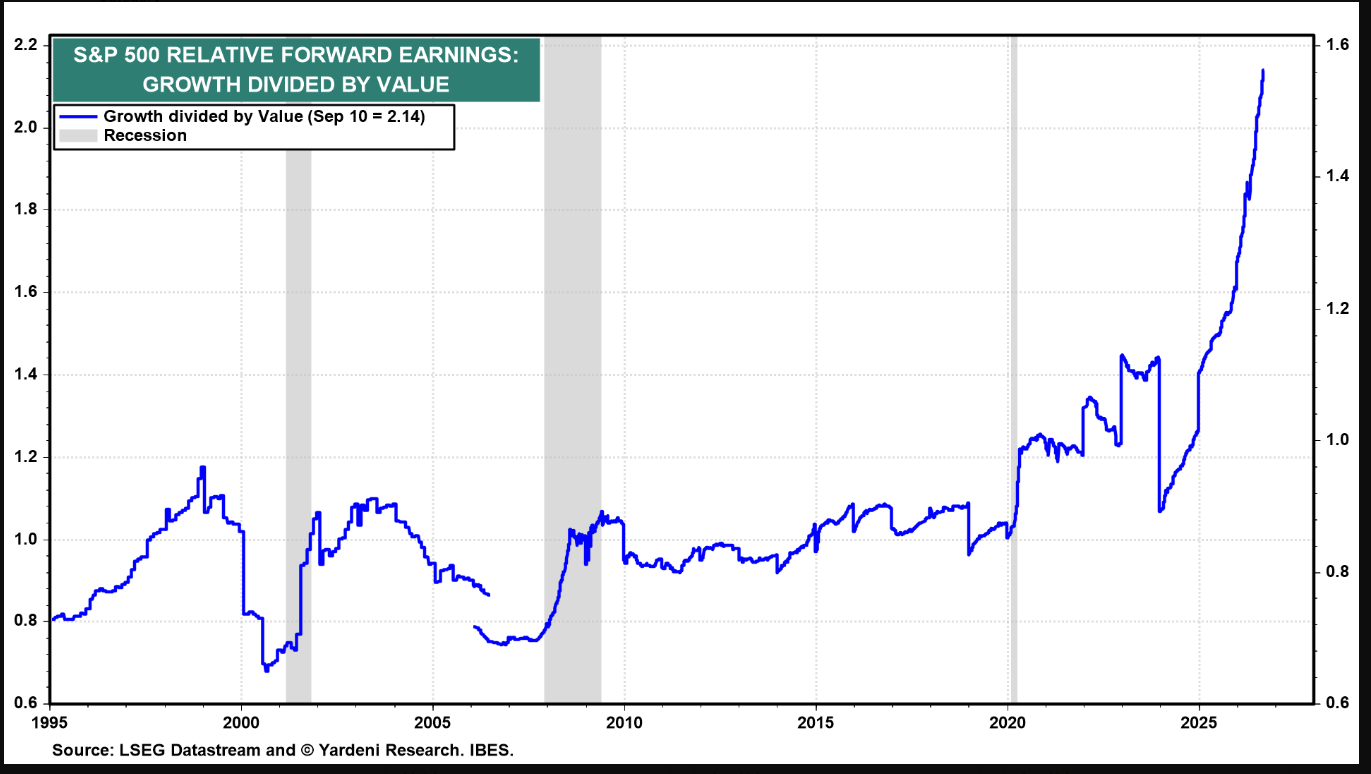
As the ratio of forward earnings for growth/value remained at an all-time high at 2.14. That is up from around 1.0 at the start of 2025.
Positioning Bifurcates Further
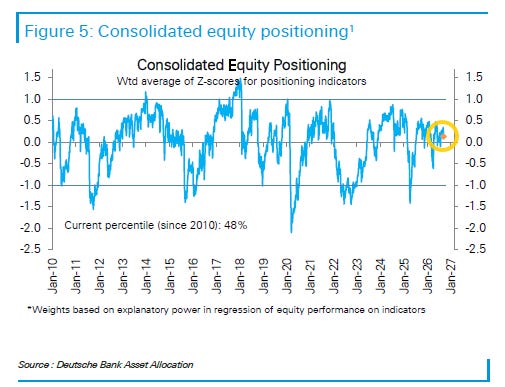
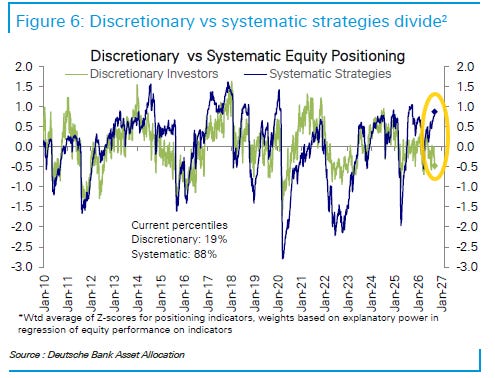
Turning to equity market positioning, after having rebuilt the previous five weeks, positioning overall eased back for a second week last week, but the headline masked a widening divergence.
Deutsche Bank:
Our measure of aggregate equity positioning declined to slightly above neutral this week, at 0.13 standard deviations and the 48th percentile.
The move was driven by a sharp unwind in discretionary investor positioning, which fell to a notable underweight at -0.47 standard deviations and the 19th percentile. By contrast, systematic strategies increased equity exposure amid subdued volatility to 0.87 standard deviations, around the 88th percentile, the highest level since October 2025.
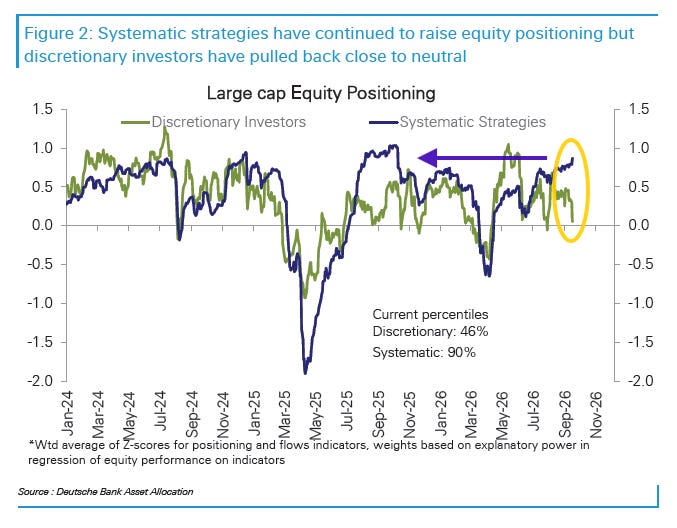
Looking just at large cap positioning discretionary investors have also pulled back and are barely above neutral in the alternative measure cited, at 0.06 standard deviations and the 46th percentile. While systematic positioning is also at the 90th percentile, the highest level since October 2025.
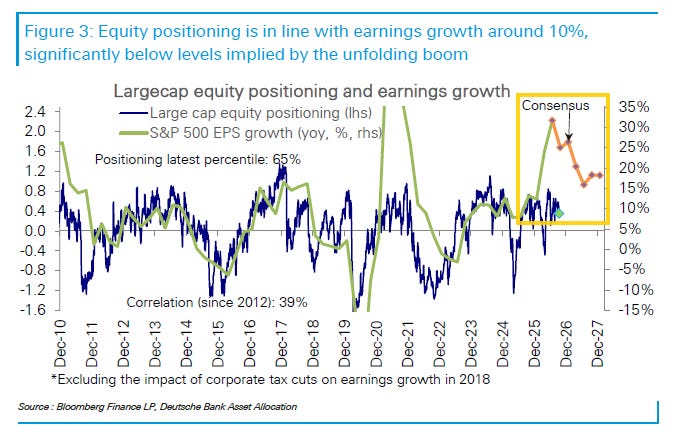
Overall, large-cap equity positioning remains modestly overweight at 0.35 standard deviations and the 65th percentile. While that may not initially appear especially cautious, it is consistent with earnings growth of roughly 10% year over year—well below the positioning levels implied by the unprecedented earnings-growth boom now underway.
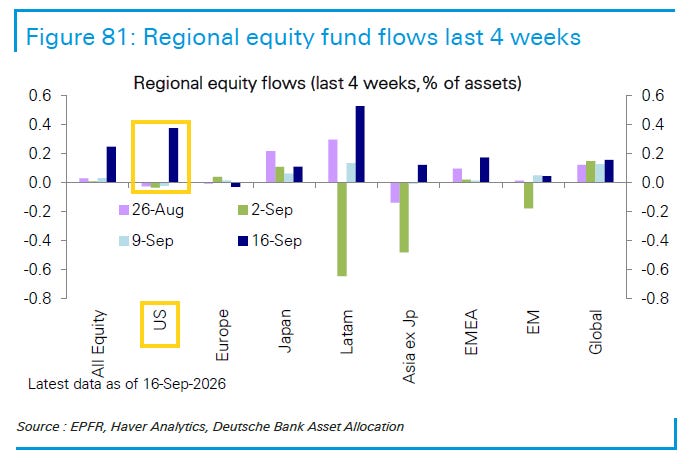
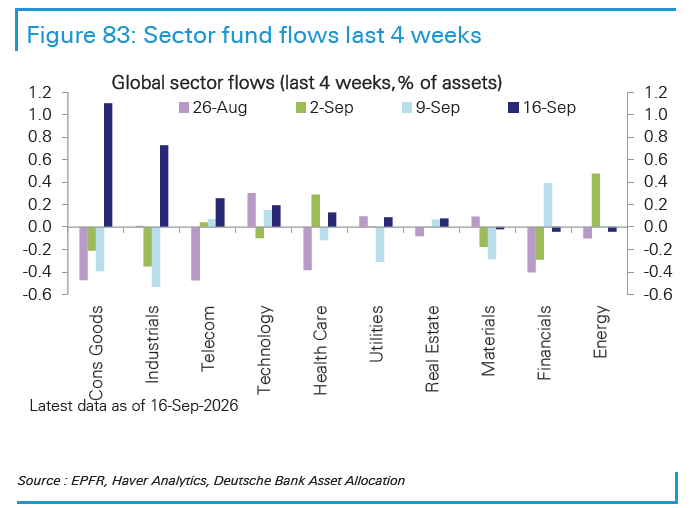
They note that global funds saw the largest inflows in three months, while bond inflows fell to a 5-month low and “money markets saw large outflows”. US equities also were at a three-month high after three weeks of outflows. Inflows were led by Tech (for a third week), Consumer Goods, and Industrials.
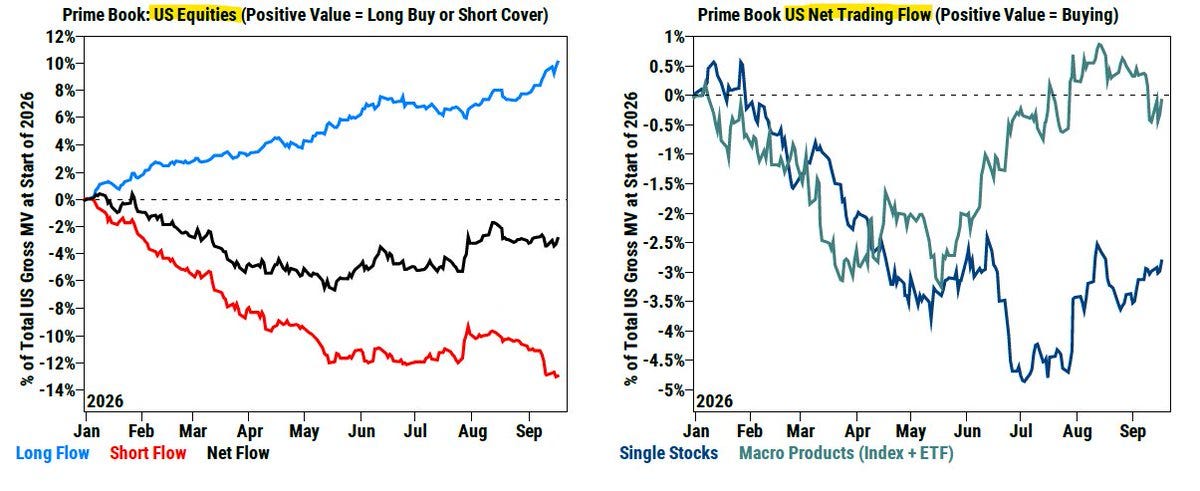
Goldman’s prime desk (mostly hedge funds) also saw buying last week:
Last week US equities saw the largest net buying in five weeks (+0.9 SDs 1-year), driven by short covers in Macro Products and long buys in Single Stocks.
Macro Products (Index and ETF combined) made up 60% of the total $ net buying (+0.8 SDs 1-year), driven mainly by short covers.
Single Stocks were net bought for a third straight week and made up 40% of the total $ net buying (+0.5 SDs 1-year), driven by risk-on flows with long buys outpacing short sales (1.5 to 1).
Information Technology and Communication Services were the most heavily net-bought US sectors for a third consecutive week, with both driven by long buying as short flows remained relatively muted.
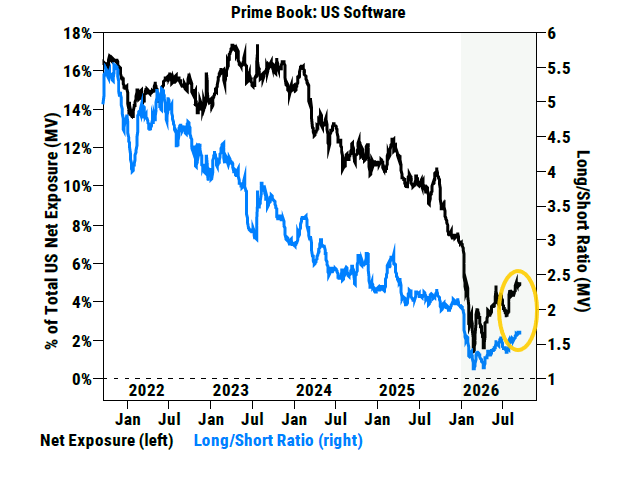
Hedge funds have net bought US software stocks for four consecutive weeks—six of the past eight—and there are early signs of increased long buying in the group, pointing to a positive shift in sentiment.
Net allocation to software stocks, as a percentage of total US net market value, now stands at 5%. That compares with a record low of 1.3% in February and 7% at the start of the year. The current allocation is at the 66th percentile relative to the past year, but only the 13th percentile relative to the past five years.
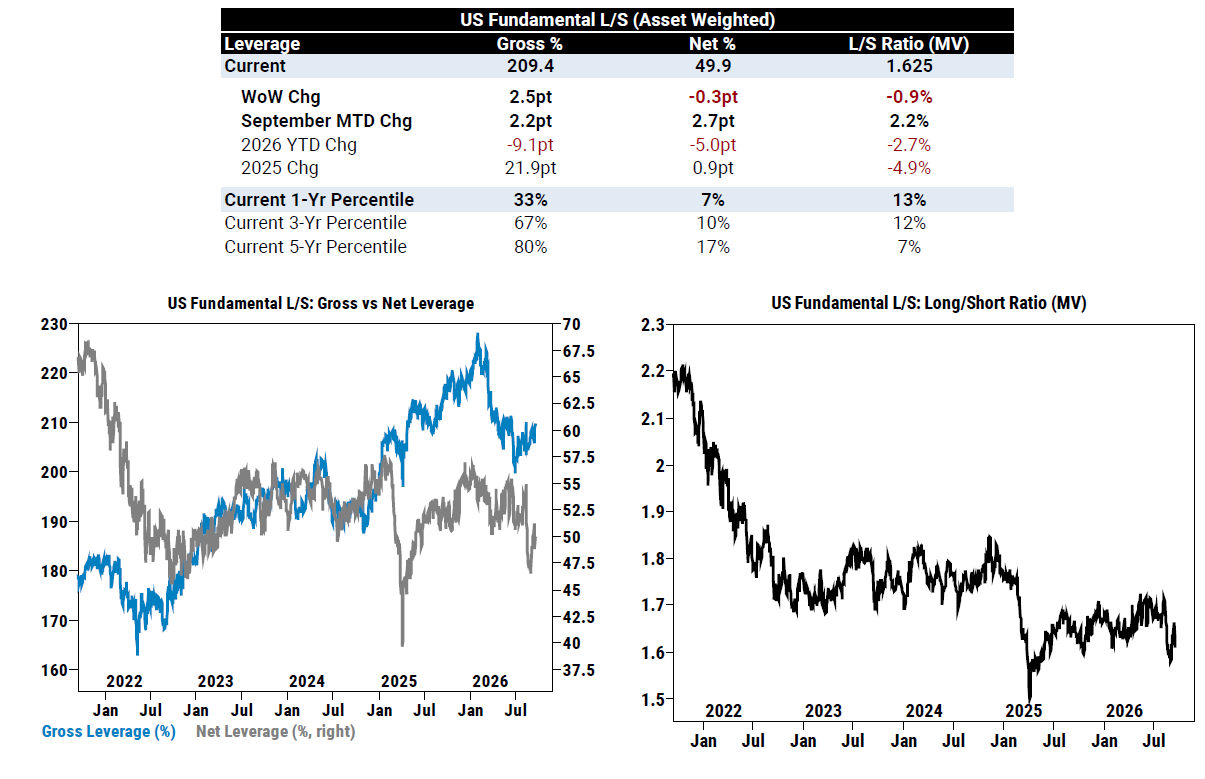
Overall positioning remains light though with US Long/Short Fund gross leverage at the 33rd percentile one-year (but 80th five-year), while US net leverage is at just the 7th percentile (17th). The US Fundamental long/short ratio (MV) decreased to the 13th percentile one-year (7th).
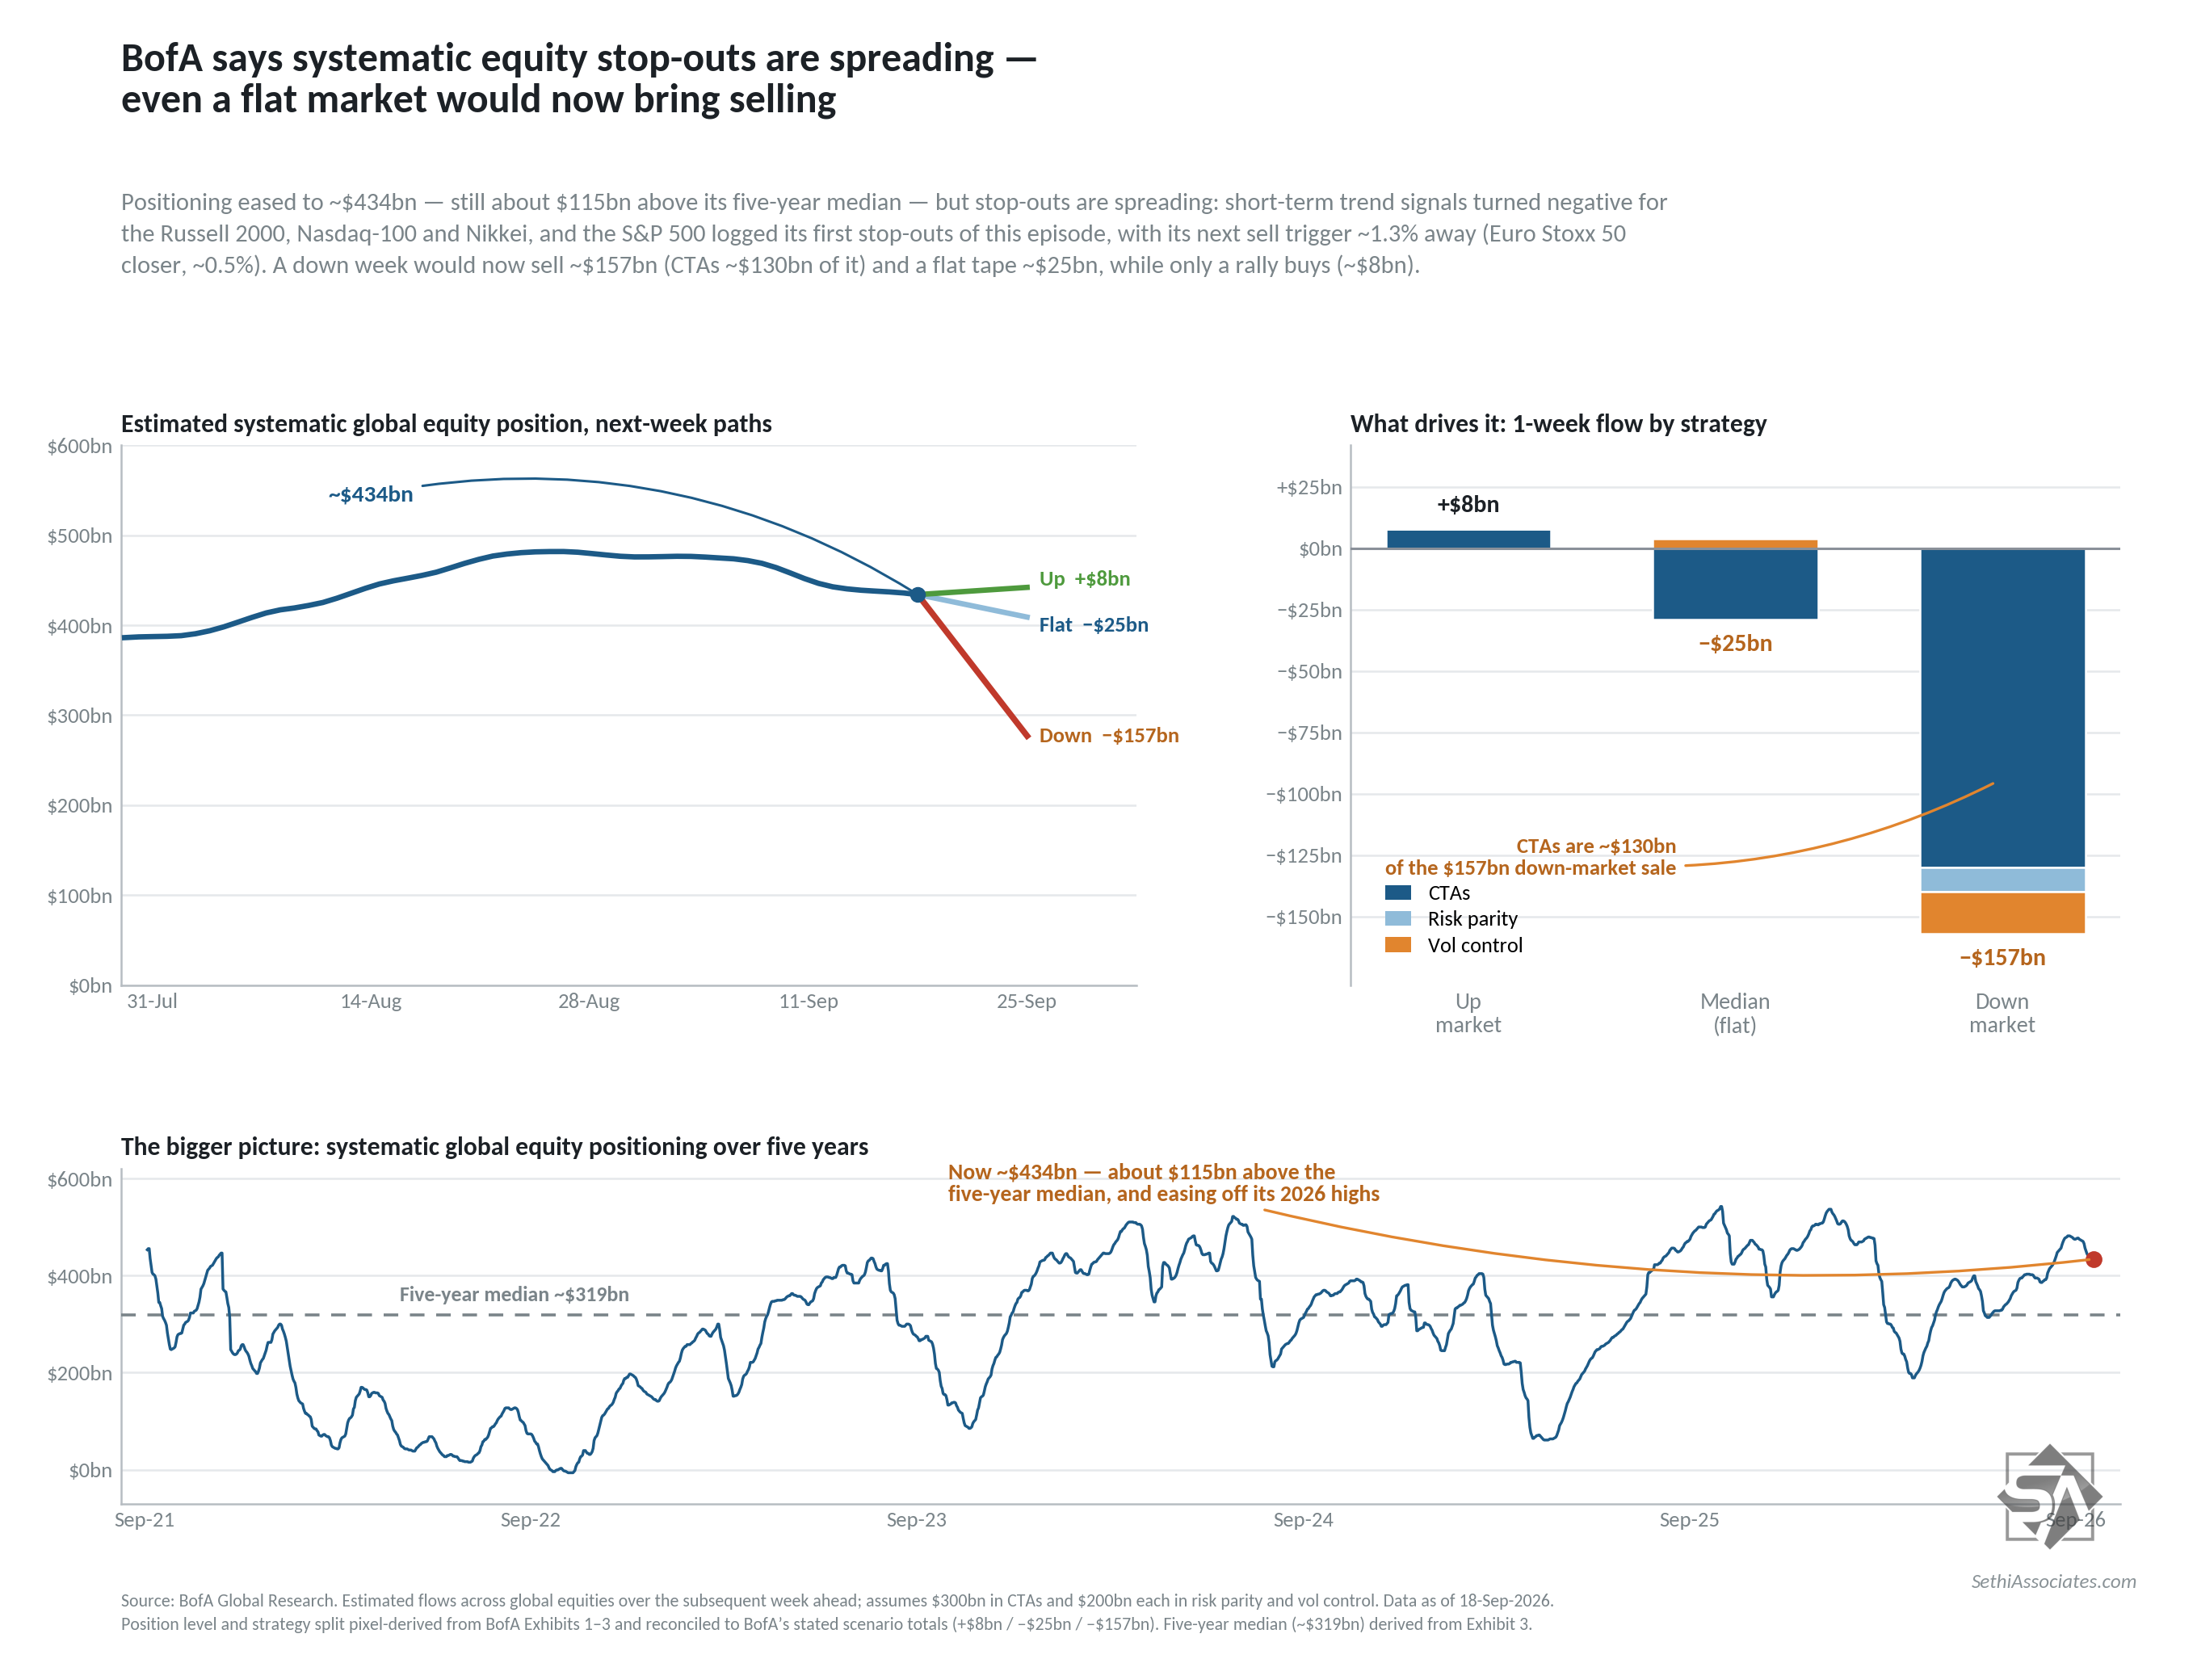
I mentioned last week we were getting near “key support thresholds” and BofA says that we started to breach them last week. They see overall systematic positioning in global equities as having moderated for a second week, although remaining above the 5-year median.
They note
short-term trend signals weakened across every index we track. In small caps and Europe, stop-outs were concentrated among medium- and slower-moving trend followers, the cohort carrying the largest long exposure, while faster models had already trimmed longs and took less damage.
In the Russell 2000, Nasdaq-100, and Nikkei, short-term signals have now turned negative, suggesting the fastest CTAs are moving short. Notably, Russell 2000 medium- and long term trends remain bullish, yet risk management alone should have forced meaningful de-risking. The S&P 500 saw its first stop-outs of this episode, with its next nearest sell trigger about 1.3% away and the Euro Stoxx 50 closer still at roughly 0.5%.
That puts their base case at more expected selling in the week ahead (-$25B). The next layer of sell triggers now sits around −1.4% for the S&P 500 — while the Nasdaq-100 retains much more cushion (~−4.1%).
Specifically they see:
−$25B of selling in a flat market (from +$20B of buying last week);
+$8B of buying in an “up” market (from +$15B; “up market” defined as the 97.5th percentile price path or ~+3.5%, similar to Goldman); and
−$157B of selling in a “down” market (from −$157B last week and −$126B the prior week; “down market” defined as the 2.5th percentile price path or ~−2.9%, different than Goldman who uses −4.5%).
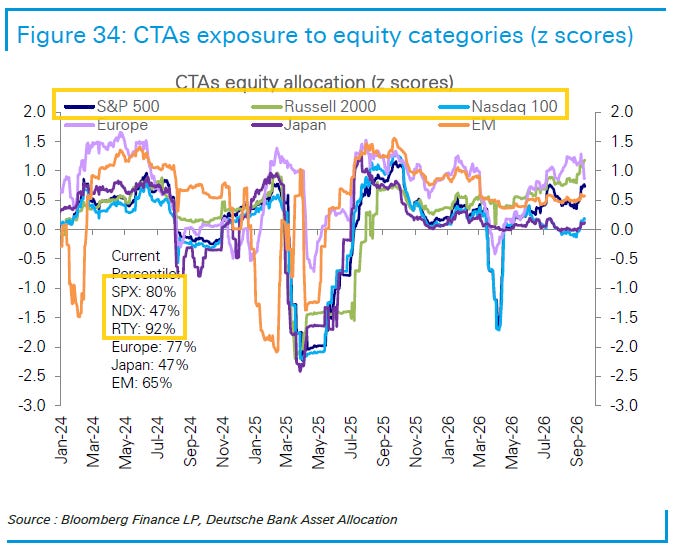
DB also sees global CTA positioning as having moderated last week but “remains elevated” at the 79th percentile to 2010 (from the 89th the prior week) but firming in the US to the 79th percentile (up from the 68th two weeks ago), with the Nasdaq-100 continuing to lag at the 47th percentile, while SPX and RUT are at the 80th and 92nd.
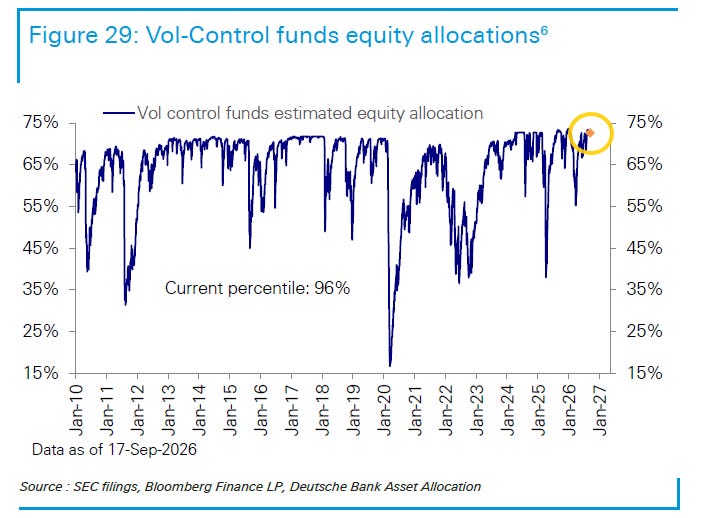
DB’s estimate of vol control* positioning also “declined this week but remains elevated” at the 96th percentile and becoming a bigger risk on selloffs:
Their sensitivity to selloffs increased, making them more responsive to downside moves than in recent weeks. With positioning still elevated, the capacity to add further to equities is limited, while the flow backdrop has become less supportive during market drawdowns.
*vol control strategies enter and exit based on changes in volatility over past windows (mostly 1-month and 3-month).
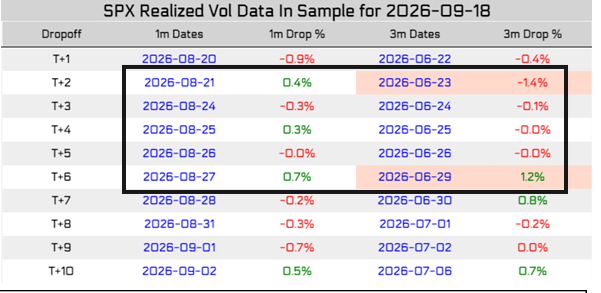
Looking at the upcoming week, it’s a mixed one for potential vol control buying. While we do drop two 1+% days from the 3-month lookback, we also unusually have three days of 0.1% or less dropping off.
(as a reminder from two weeks ago “1-month realized volatility has now fallen back below the 3-month measure, shifting the 3-month reading into the primary volatility input for funds that deploy volatility scaling as a way to manage risk”):
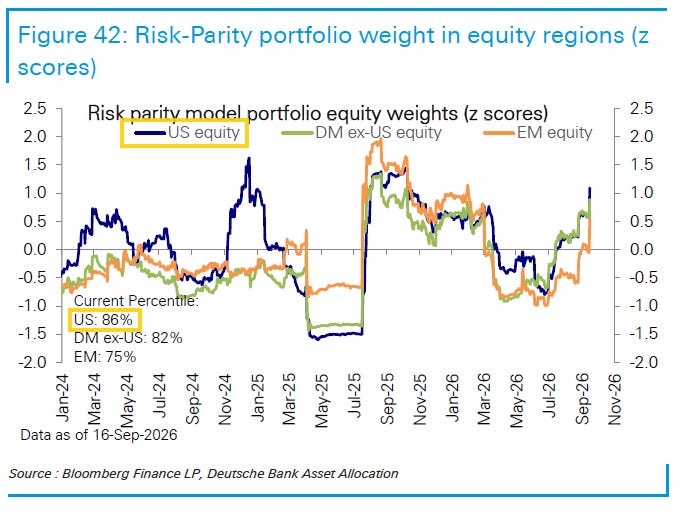
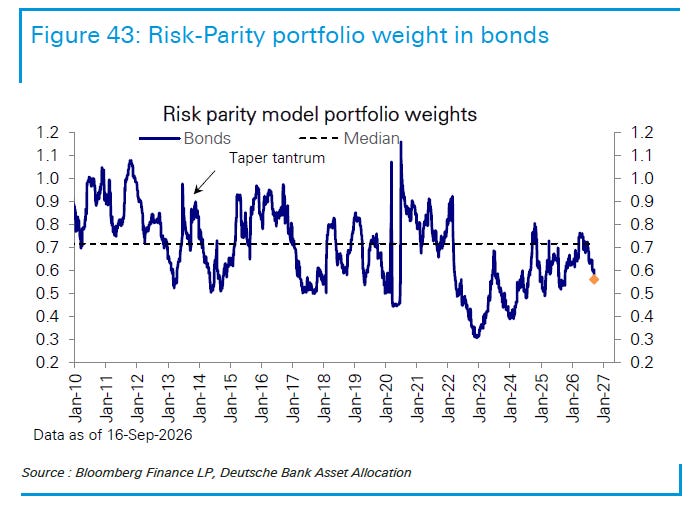
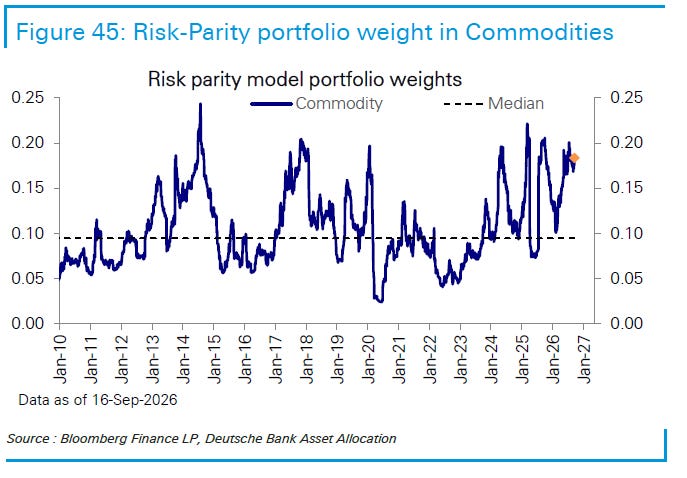
While for risk parity DB says” equity allocations increased sharply this week,” the fourth rise in five weeks with the US at the 86th percentile from the 76th percentile the prior week. That pushes it to “stretched”. Bond exposure though fell to the 26th percentile (down from the 34th) while commodities remain elevated at the 95th (up from the 91st).
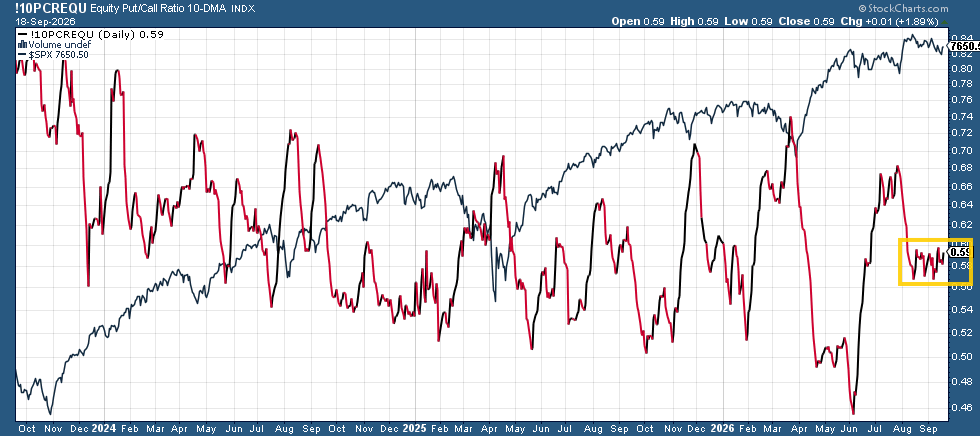
While put/call buying (which adds incremental downside/upside pressure) continued to chop back and forth for a seventh week.
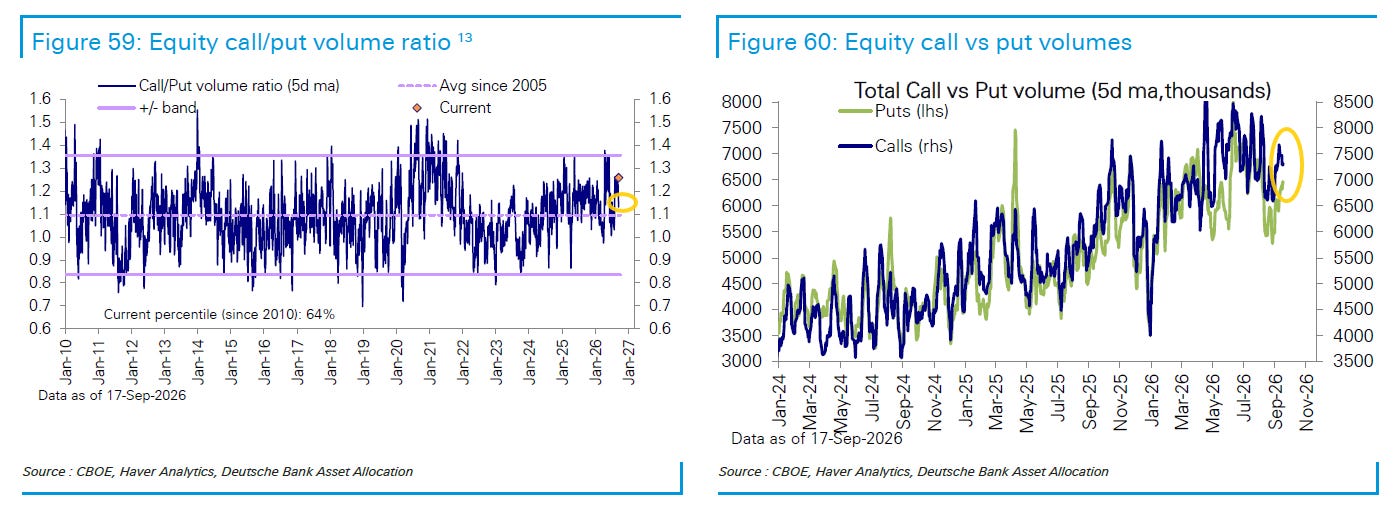
DB though said call/put volume (5-DMA) “declined sharply this week driven by a decline in net call volume,” seeing the ratio fall to the 64th percentile since 2010 from the 5-year highs of the 89th percentile three weeks ago).
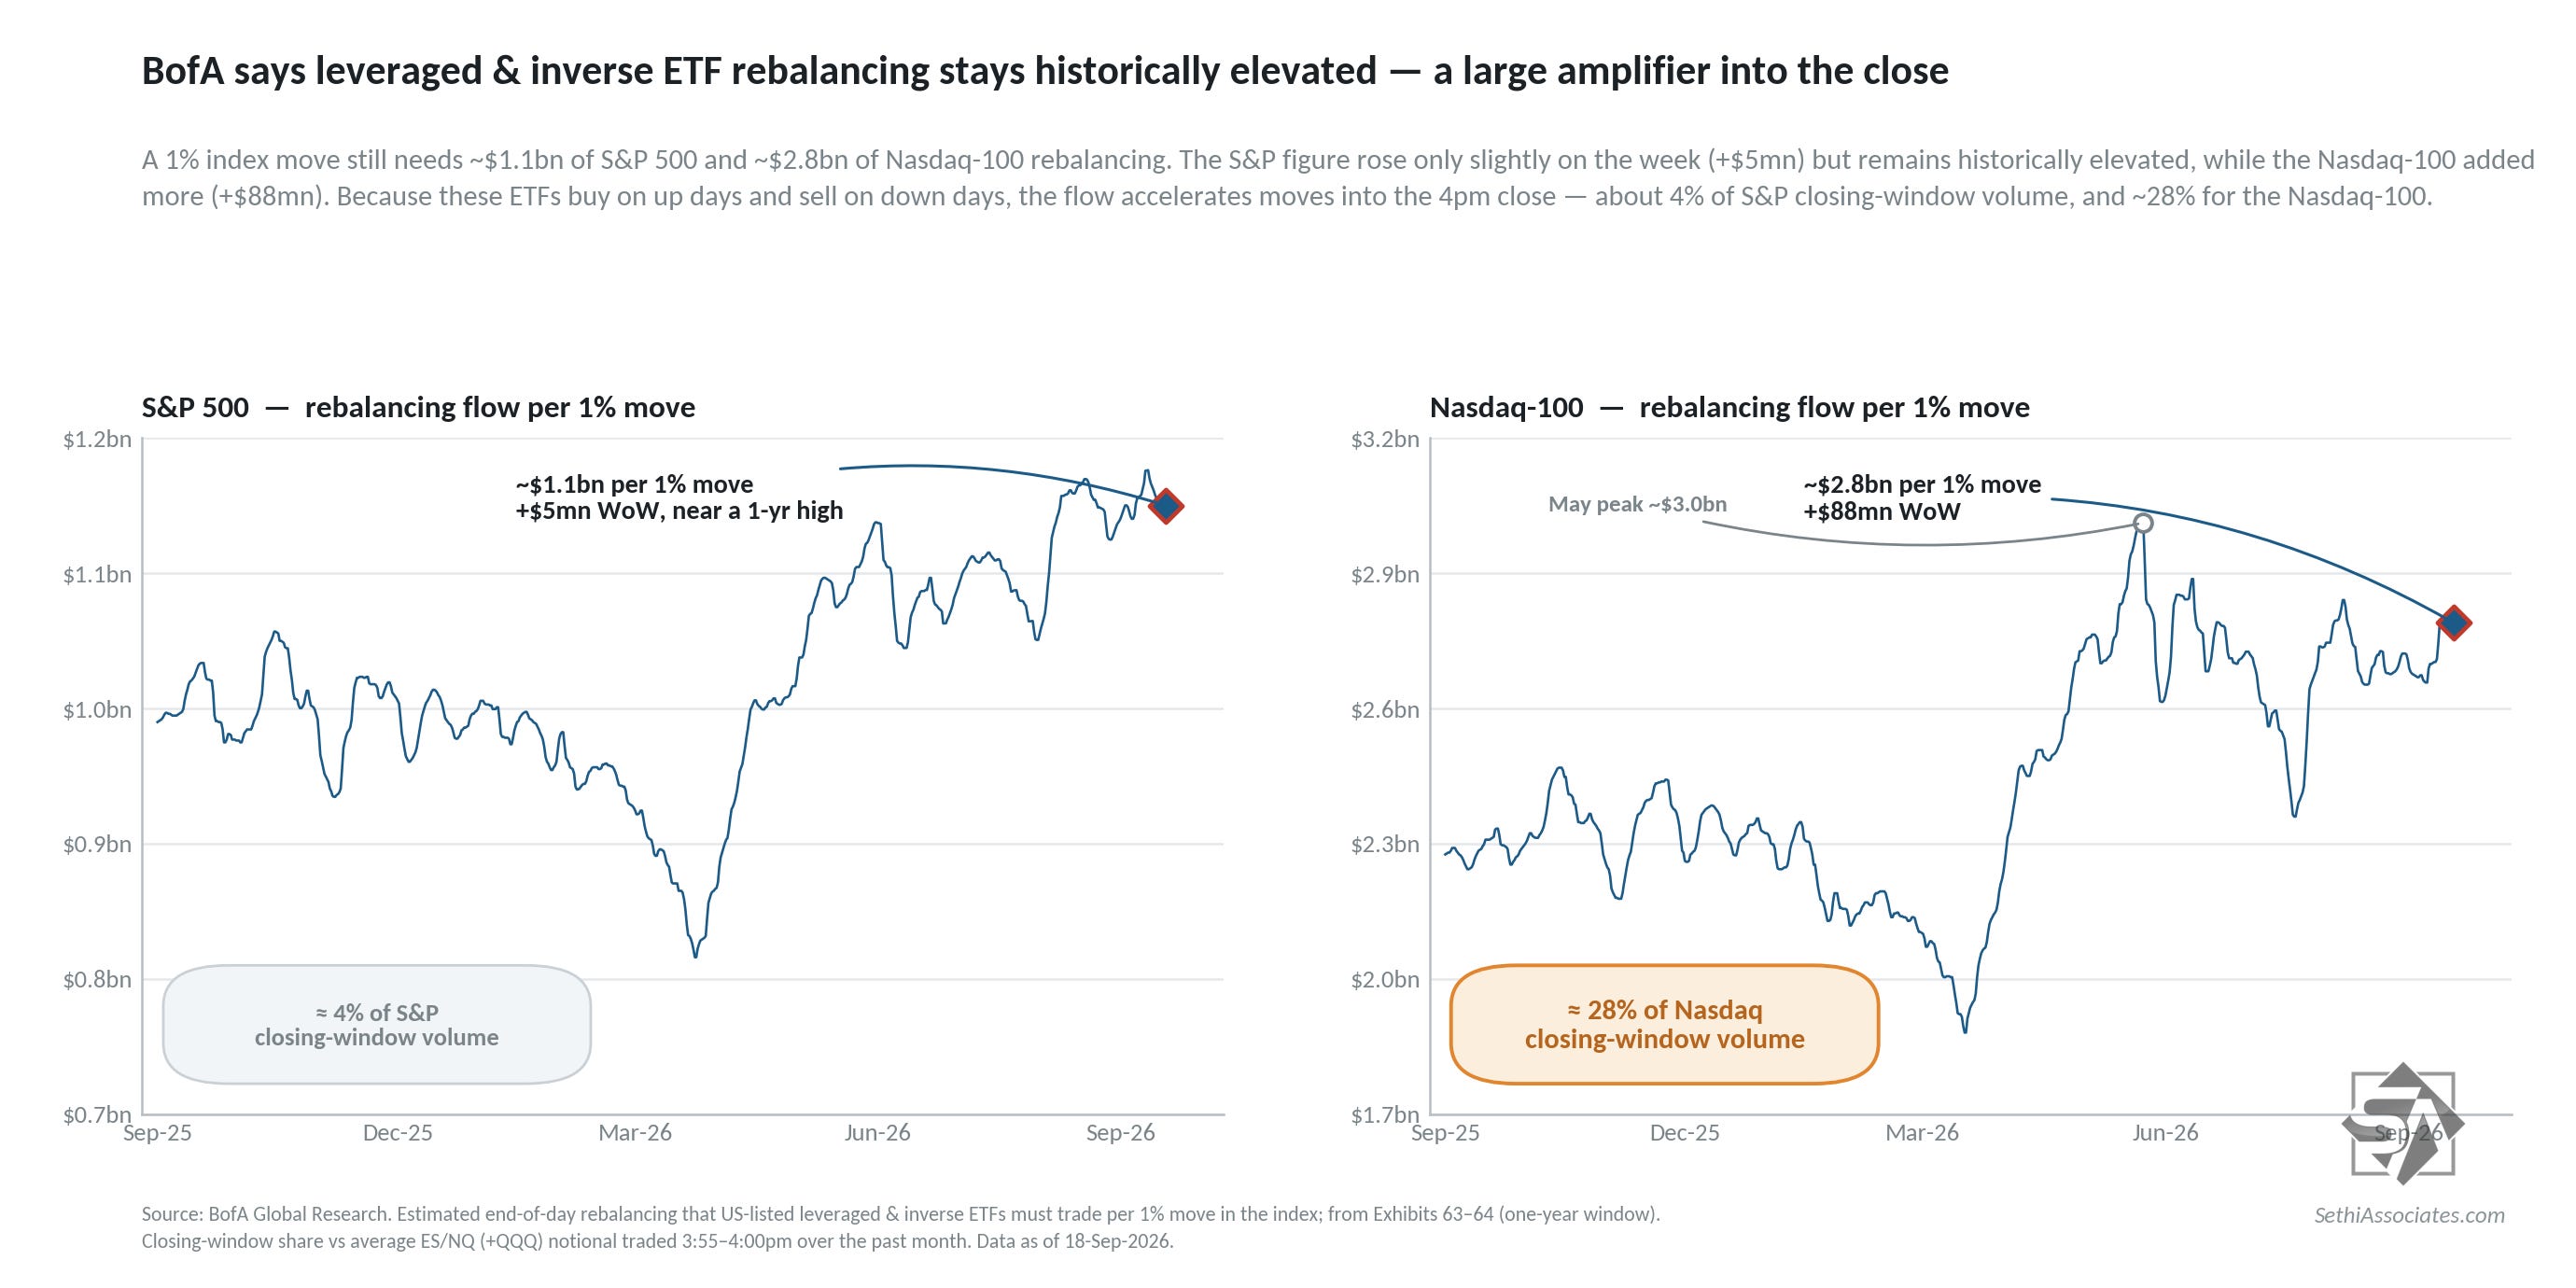
Like call buying, leveraged positioning acts as a “negative gamma source” as Charlie McElligott has put it (meaning that there is added buying/selling pressure from them in the direction of daily flows as they rebalance each day).
Rebalancing flows for Nasdaq-100 and SPX leveraged ETFs climbed last week, particularly for the former remaining at historically elevated levels.
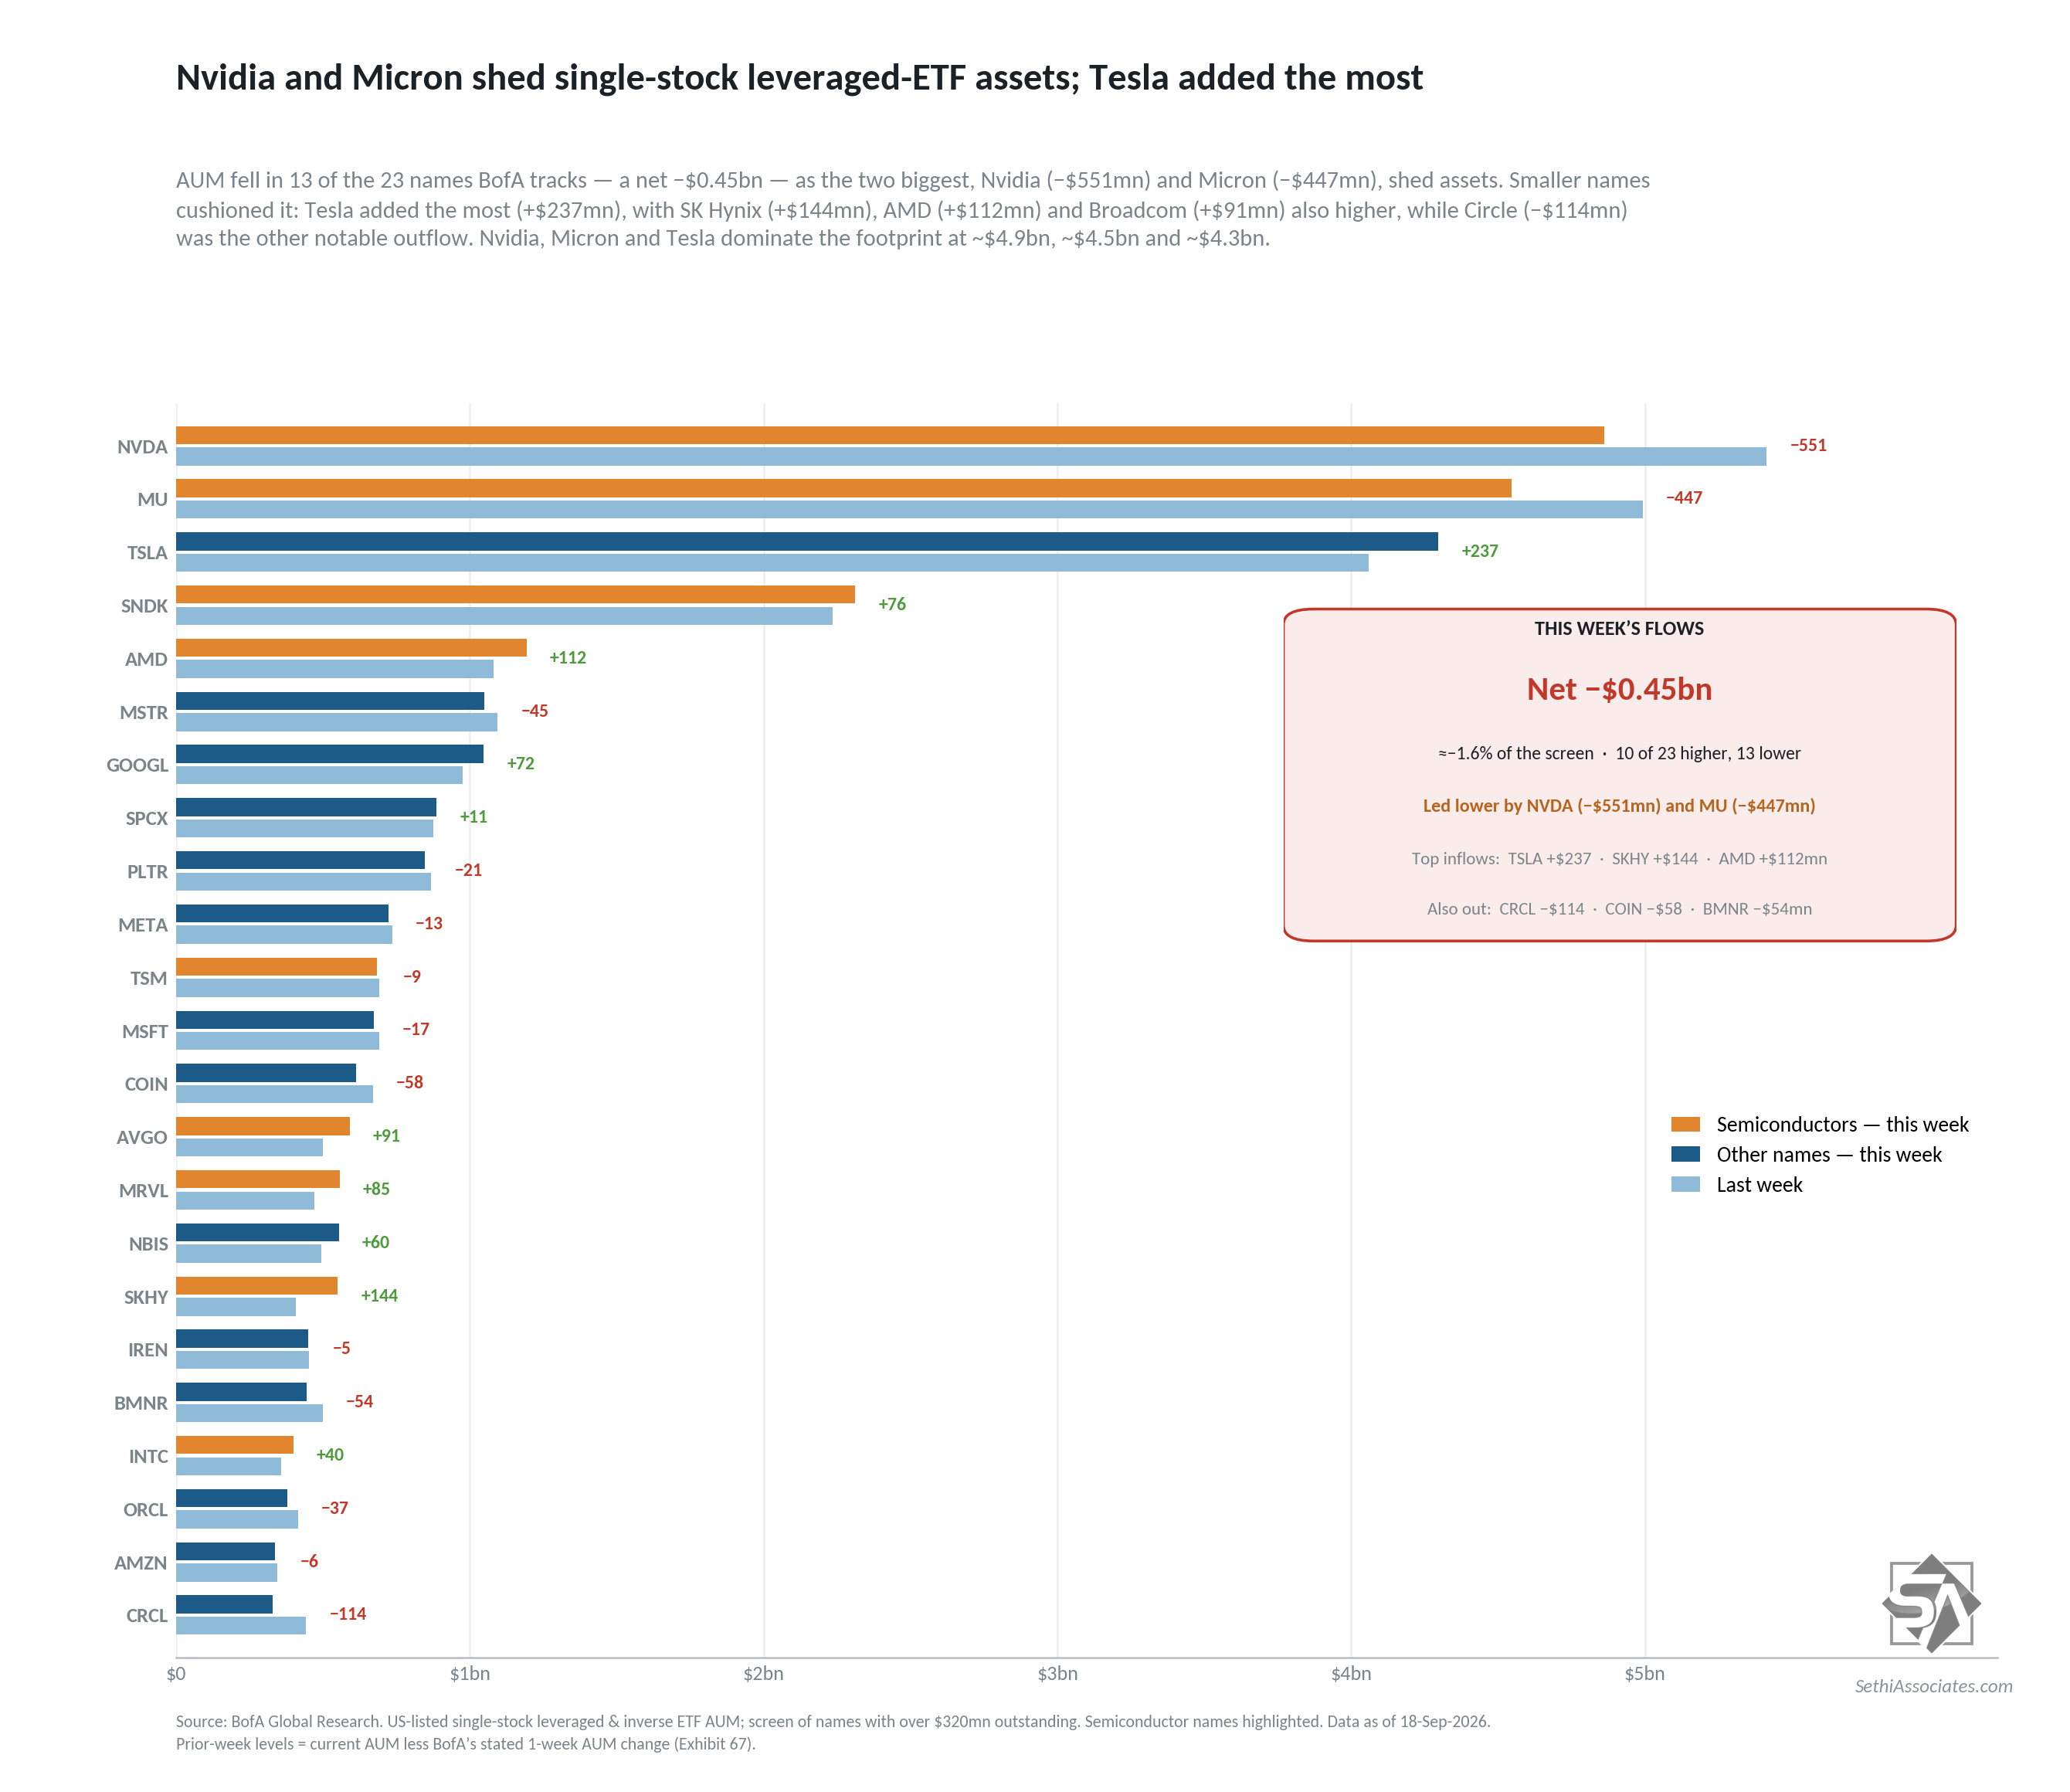
Single-stock leveraged ETF AUM though eased back for a second week led lower again this week by Nvidia (NVDA) and Micron (MU) leveraged ETFs.
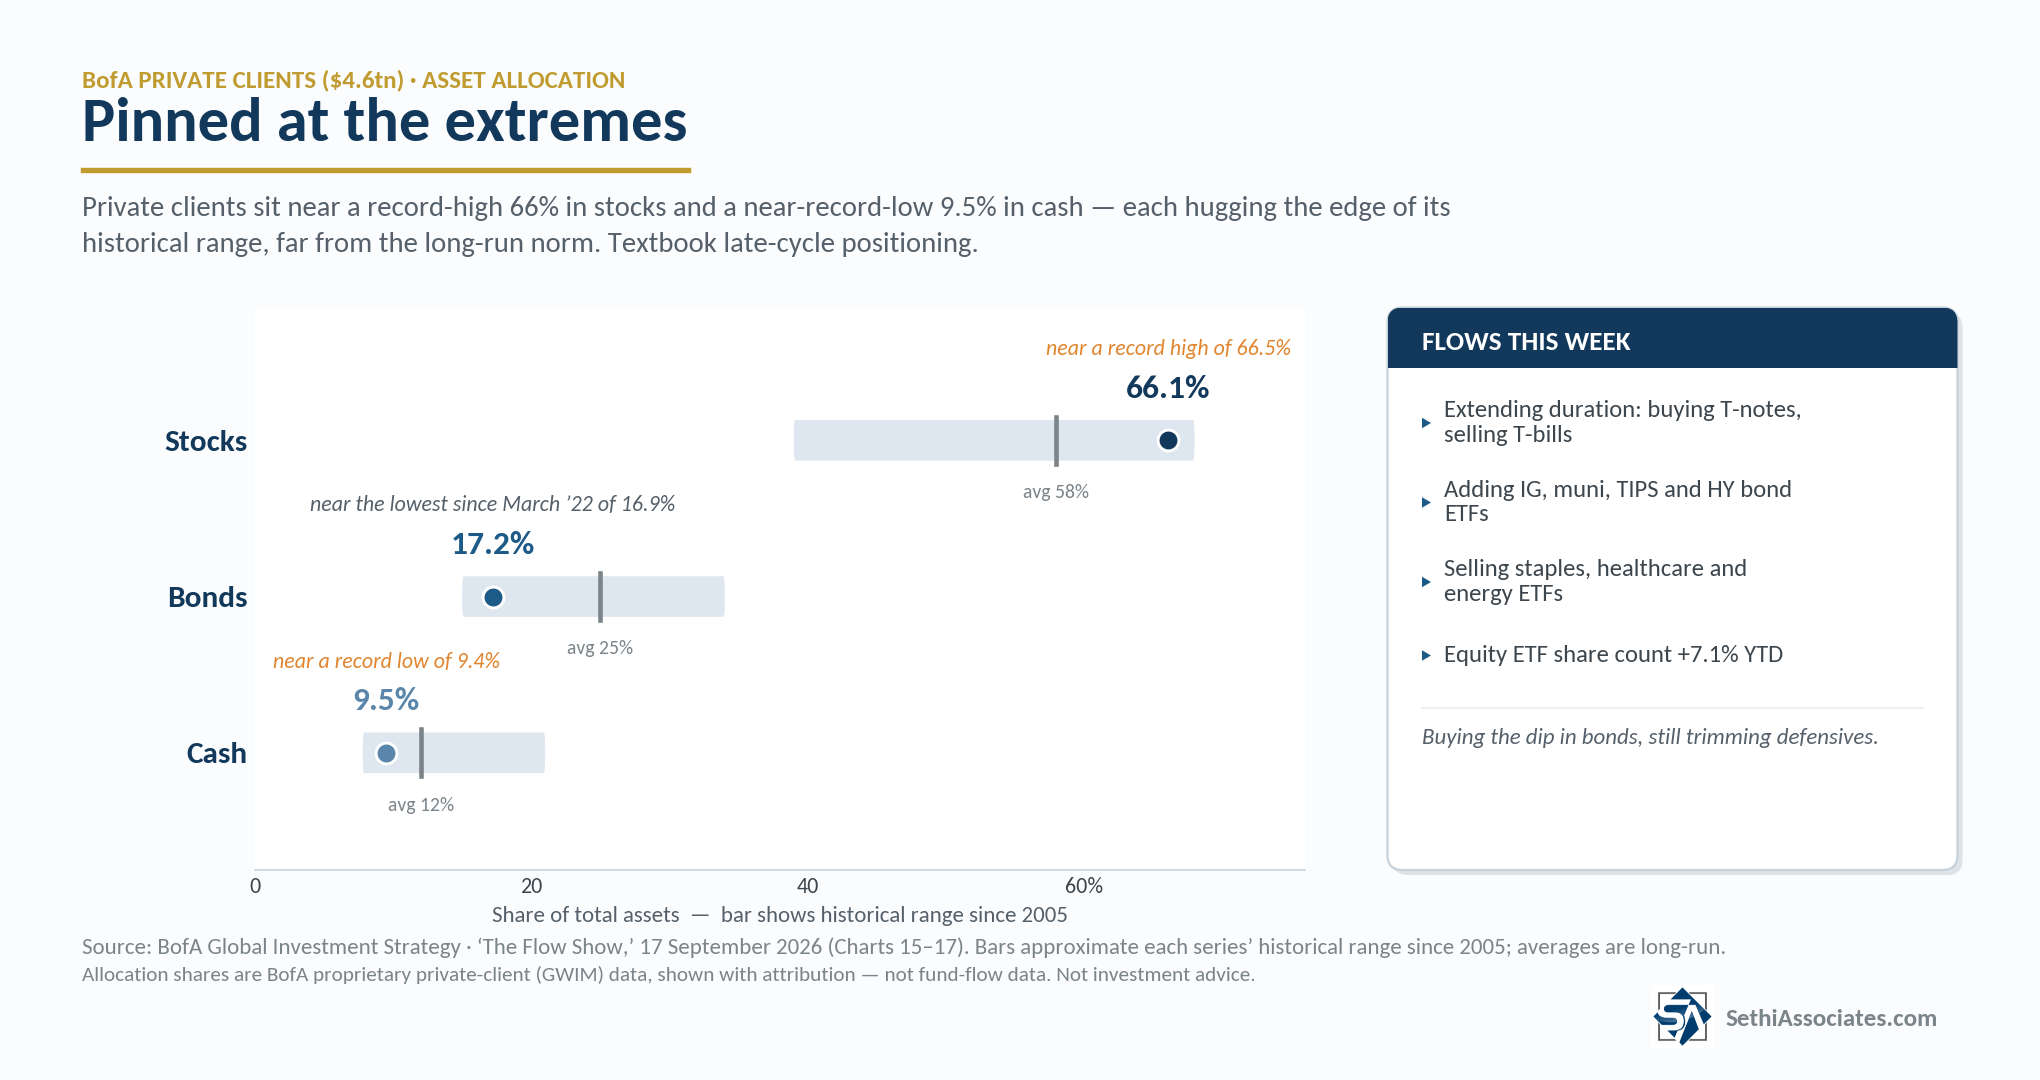
Turning to retail positioning, BofA client retail equity positioning edged back with AUM in stocks falling a tenth to 66.1% (all-time high was 66.5% three weeks ago), remained at 17.2% in bonds (16.9% two weeks ago was the lowest since March 2022), while cash edged up a tenth from the 9.4% record low.
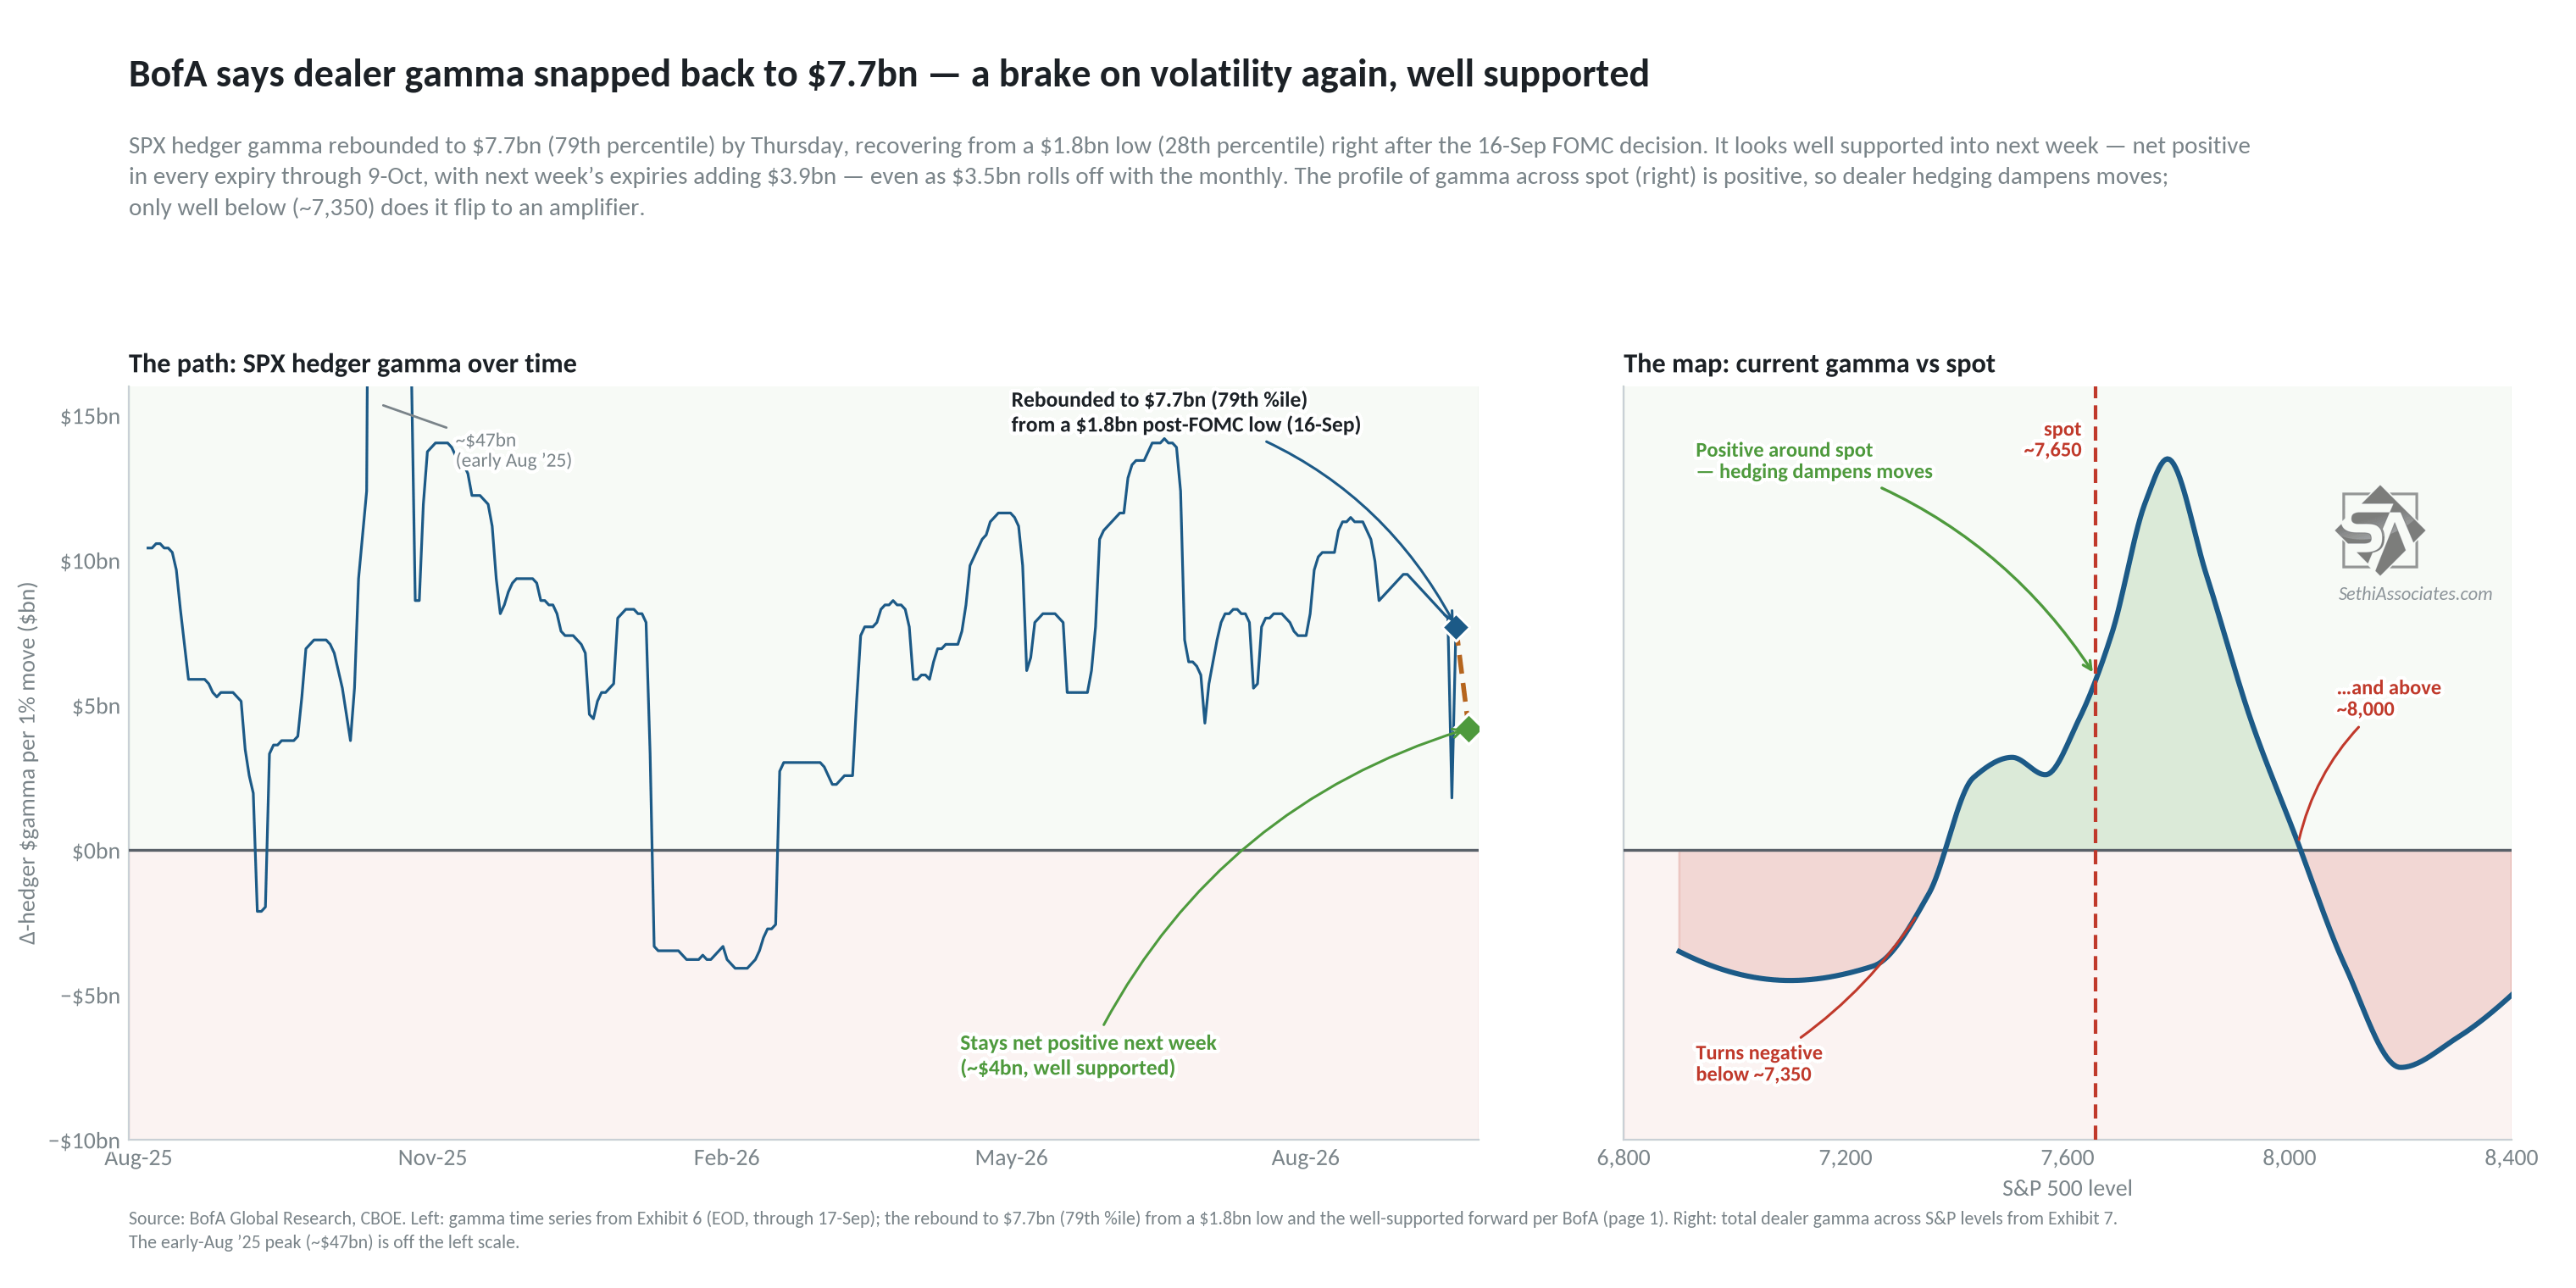
And looking at gamma (which plays an important if nebulous role in market volatility —positive gamma means options market makers will buy/sell in the opposite direction of moves in price dampening volatility, while negative gamma means the inverse and market makers accelerate rallies/sell-offs adding to volatility):
BofA saw SPX gamma last week rebounding to “$7.7bn (79th %ile) as of 17-Sep, recovering from a mid-week low of $1.8bn (28th %ile) following the FOMC decision on 16-Sep…. Looking ahead, $3.5bn of gamma rolls off with the monthly expiry but positioning remains well supported; hedger gamma is currently net positive in every single expiry through 9-Oct, with next week’s expiries contributing $3.9bn.”
That “well supported” gamma builds on rallies, and on declines stays positive in their modeling until SPX 7,350, so it should dampen volatility next week despite Friday’s options expiration.
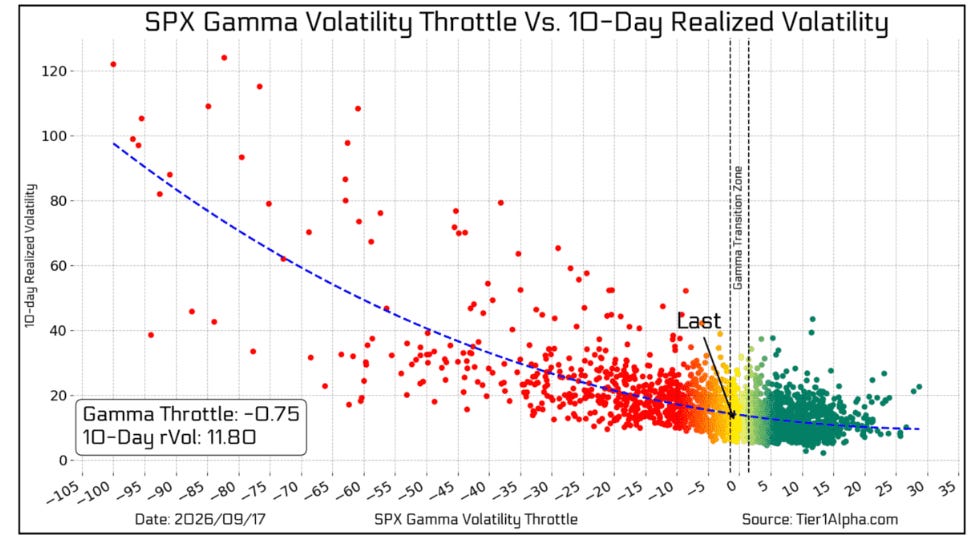
Tier1Alpha’s update was also as of Thursday night and they saw the SPX in “neutral” territory:
Just like that, we’re right back to where we started. SPX pushed back into neutral Gamma, while the broader consolidation range remains intact. Our GVT index now sits 75 basis points below the zero boundary, while yesterdays 1% gain pushed the 10-day realized volatility right back in line with the historical average at these levels, hitting 11.08.
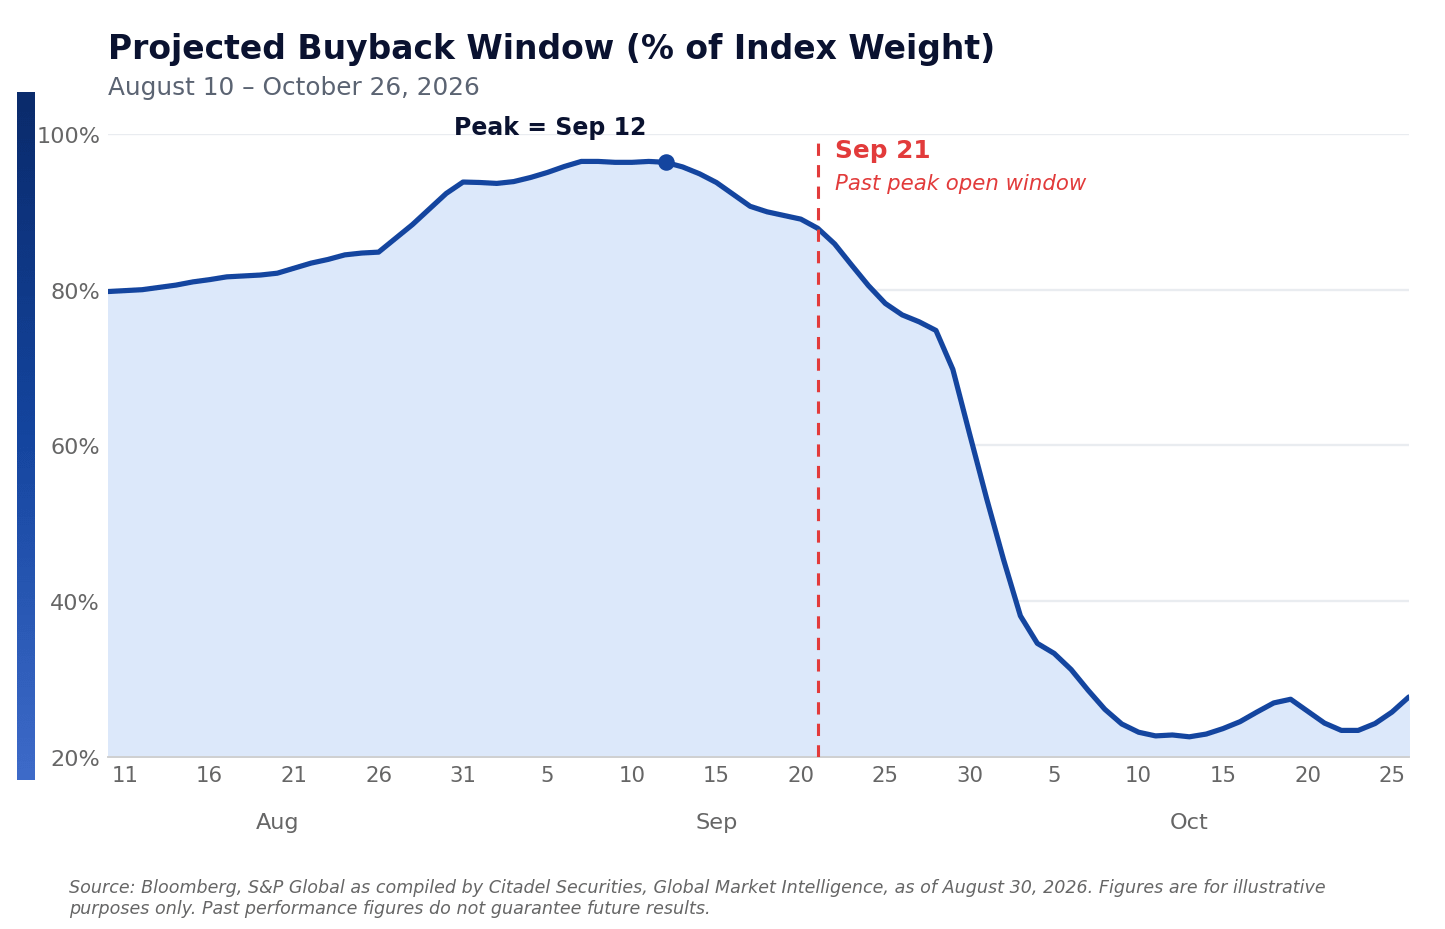
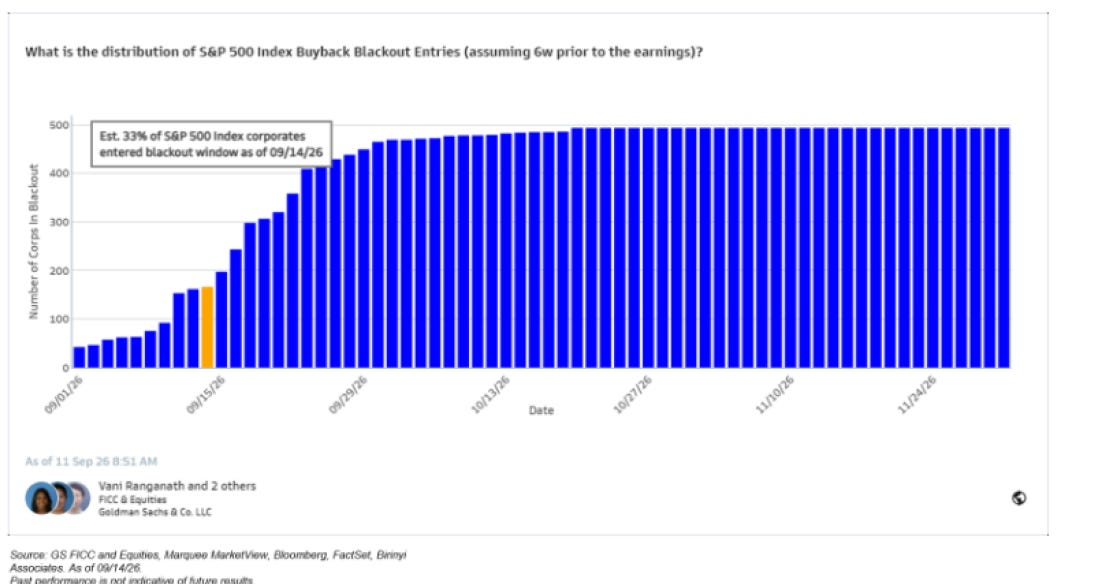
Turning to corporate buybacks (an important source of underlying demand), we have now passed the peak of the open buyback window but still will have around 85% of discretionary buybacks by index weight for S&P 500 companies active this week on average (discretionary buybacks represent ~30% of all buybacks), but it now starts to fall sharplyas we move through the month with just over 20% active by October 10th.
Goldman: “Despite the looming blackout, our desk activity last week remained steady. Volumes finished at 1.5x versus 2025 YTD ADTV and 1.3x versus 2024 YTD ADTV, with flows primarily skewed toward the Tech, Financials, and Consumer Discretionary sectors.”
They see though more like 40% of buybacks in the blackout starting this week.
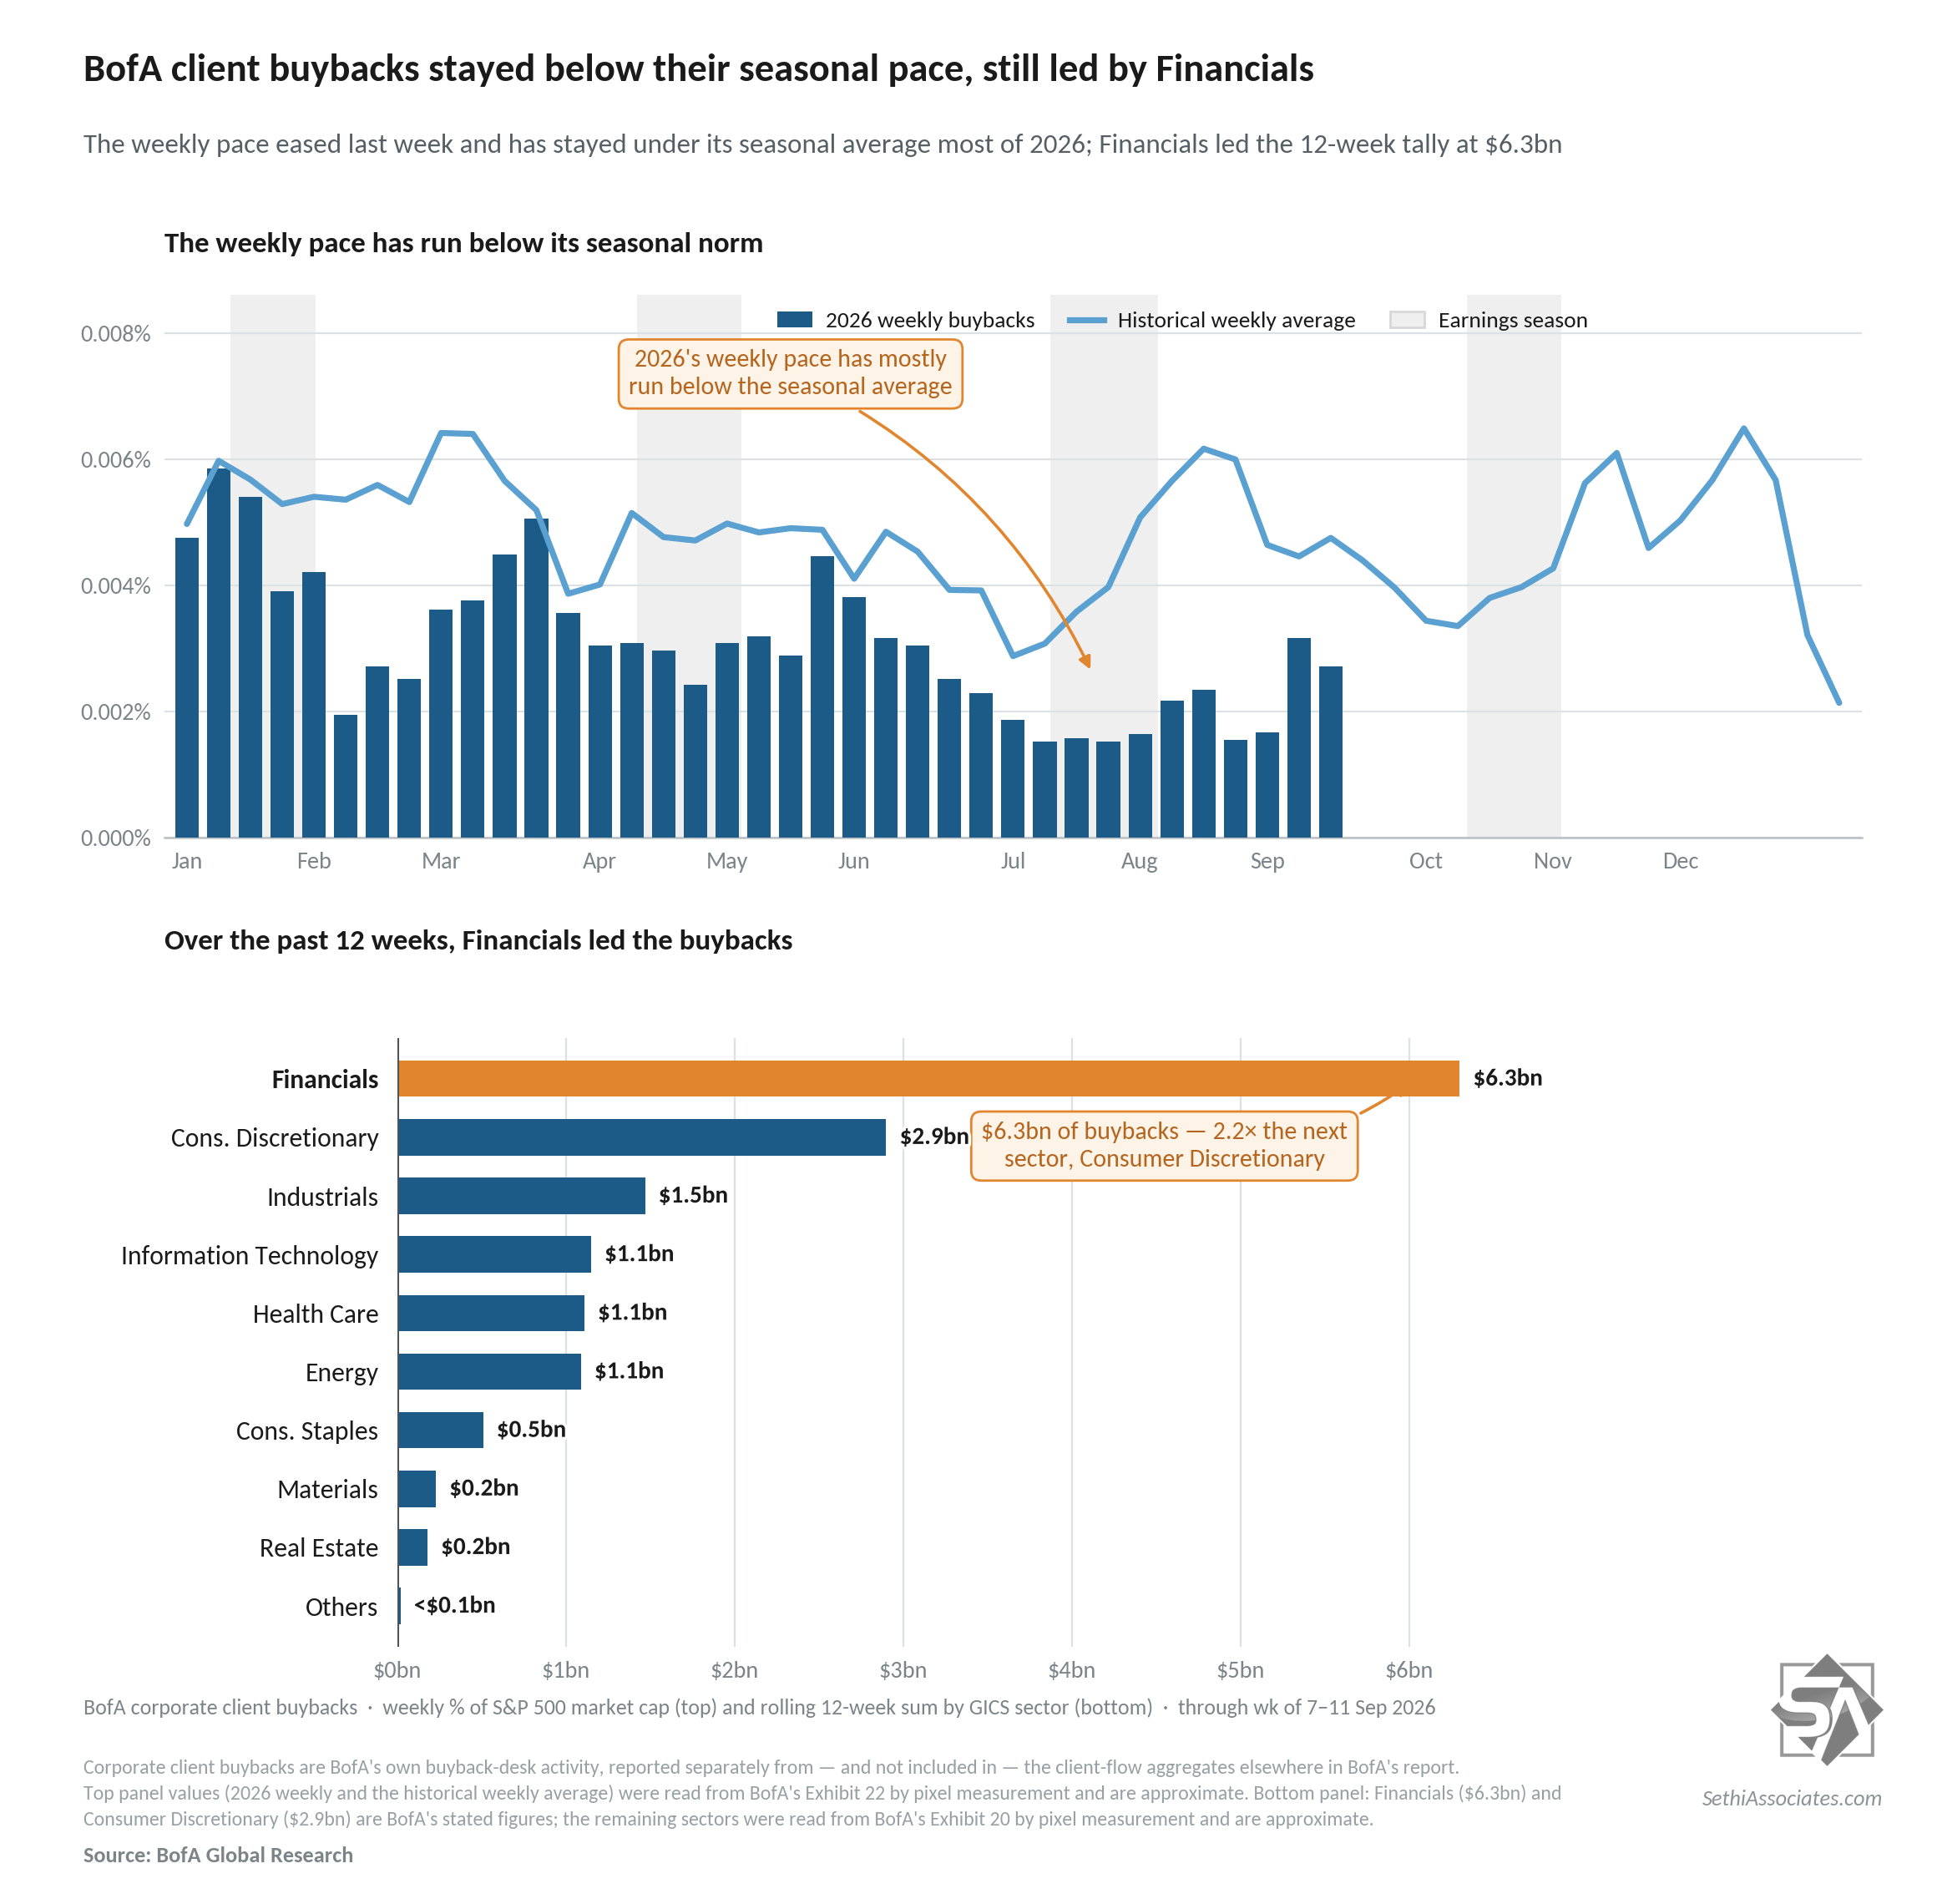
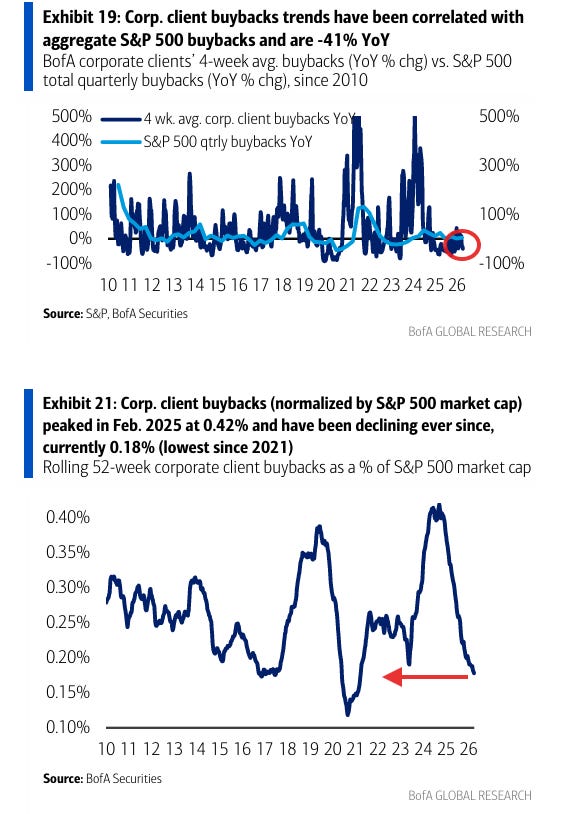
BofA in contrast says buybacks “decelerated wk/wk,” after having accelerated five of the previous six weeks (consistent with the reopening of the buyback window) to the strongest since early June, although they have since June remained well under the historic average normalized by market cap and on a 4-week average basis they fell to -41% y/y from +5% four weeks ago.
YTD they say and annualized cumulative buybacks YTD are tracking ~25% below 2025 levels and more than 40% below 2024 levels, though above 2010-23 annual levels. Rolling 52-wk buybacks as a % of S&P 500 market cap are currently the lowest since Aug. 2021.”
Sentiment Remains Mixed, A Good Thing
Sentiment (which I treat separately from positioning) is one of those things that is generally positive for equities when it’s above average but not extreme (“it takes bulls to have a bull market”, etc.), although it can stay at extreme levels for longer than people think, so really it’s most helpful when it’s at extreme lows (“washed out”).
Currently we are not near either extreme:
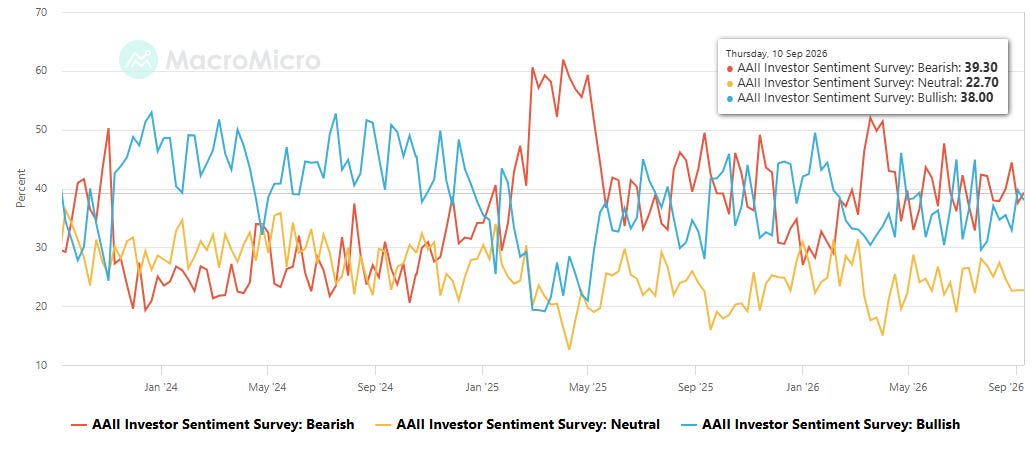
American Association of Individual Investors (AAII) sees bears shoot to the highest since May 2025 and bulls to the least since September:
AAII bulls (those who see higher stock prices in 6 mths, blue line) dropped to 28.8% from 38.0% the prior week, the least since September 2025 and back below the long-term historic average of 37.5%.
Bulls also fell further under the level of the bears (who see lower stock prices in 6 mths, red line) with the bears shooting up to 53.3%, the highest since May 2025 from 39.3%. That is the 8th week in 9 (and 23rd in 29) Bulls have been below the Bears. Bears also remain above the long-term average of 31.0% for a 31st straight week (and they’ve only been below it 9 weeks since Dec 12, 2024).
The Neutral camp (yellow line) dropped to 17.9% from 22.7%. It remains under the long-run average of 31.5% and has been over that only twice since July 2024.
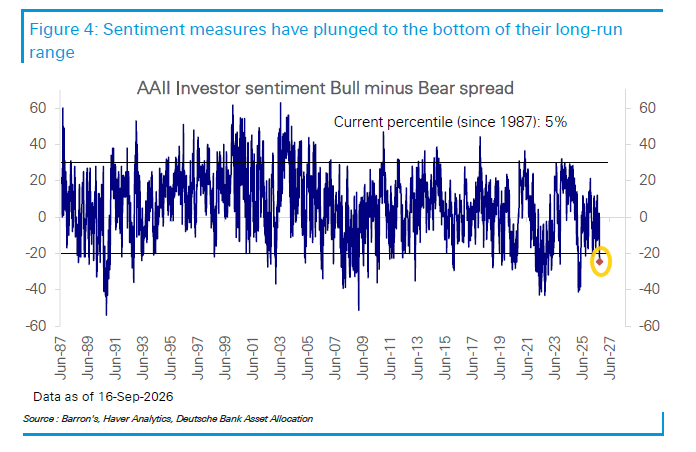
DB notes the bull-bear spread is at the bottom of its long-run range, at the 5th percentile.
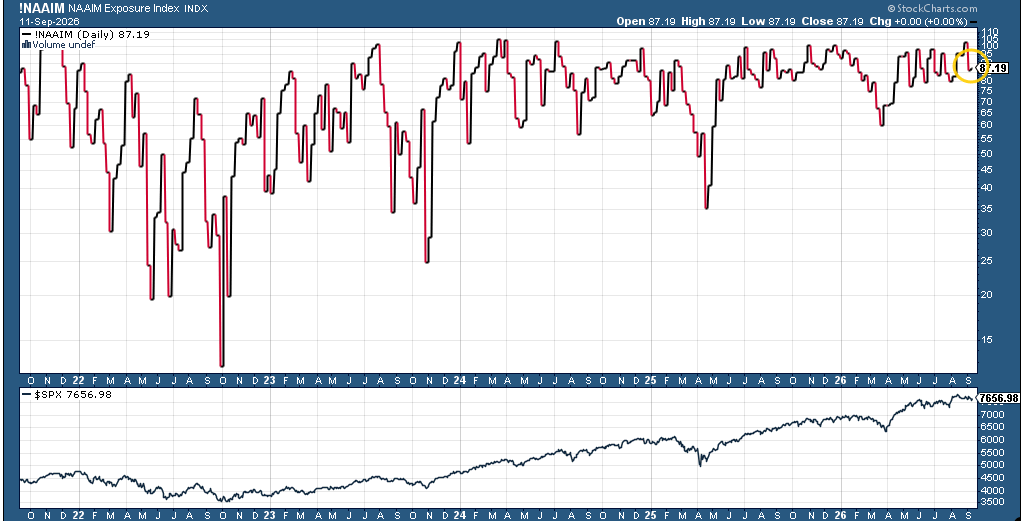
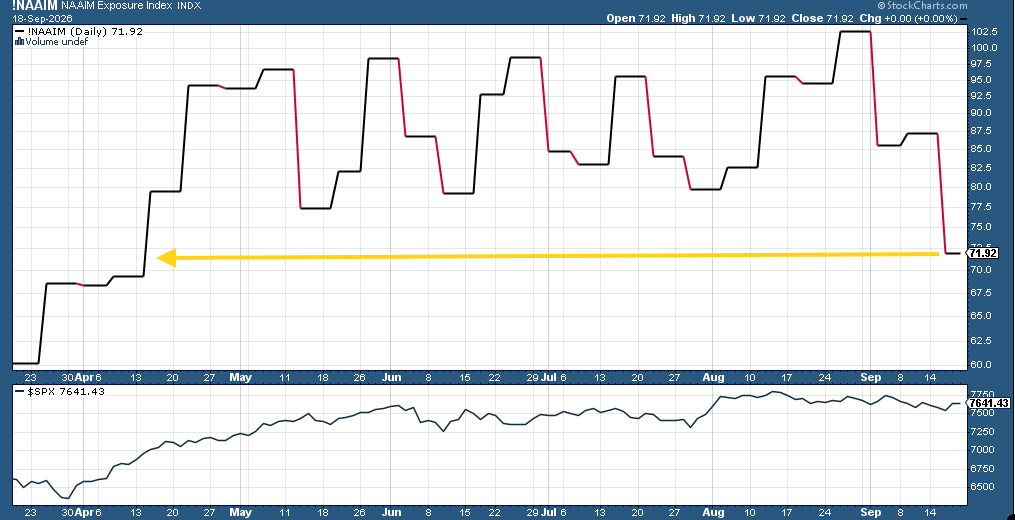
NAAIM’s survey of investment professionals* fell back to 71.9, the least since April 14th, from 87.2 the prior week. That’s after it hit 102.66 at the end of August (meaning they were on margin) which was the highest since July of 2024. *The index according to NAAIM “represents the average exposure to US Equity markets reported by our members” and which ranges from -200% (2x short) to +200% (2x long).
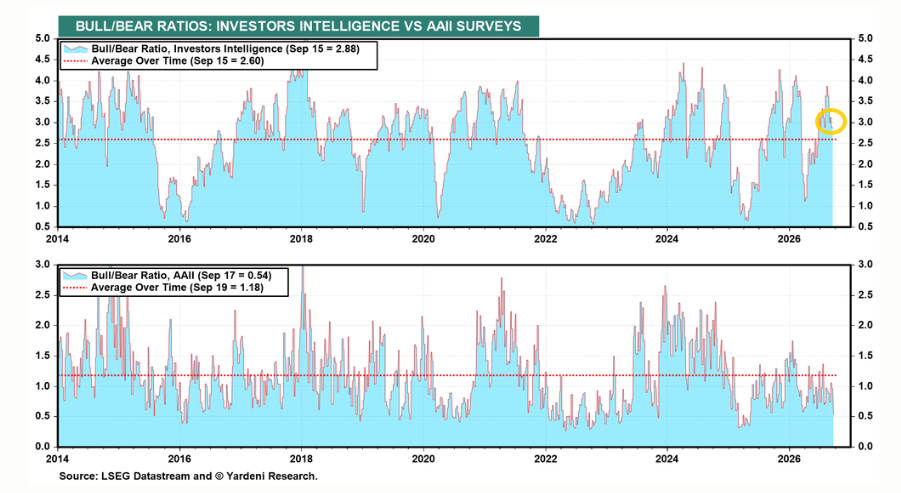
While the Investors Intelligence (independent investment-newsletter writers) survey saw the bull/bear ratio little changed at 2.88 still above its average since 2008.
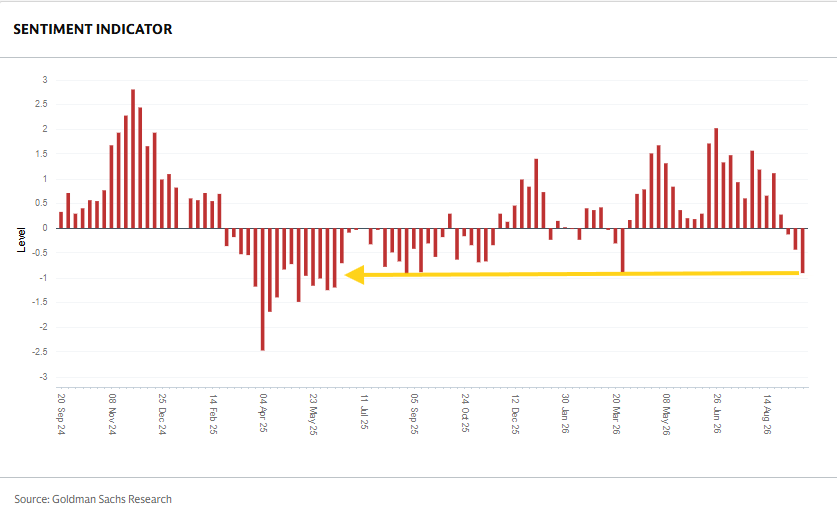
And Goldman’s US Equity Sentiment Indicator*, fell for the sixth week in seven moving further into negative territory at -0.92, the least since June 2025.
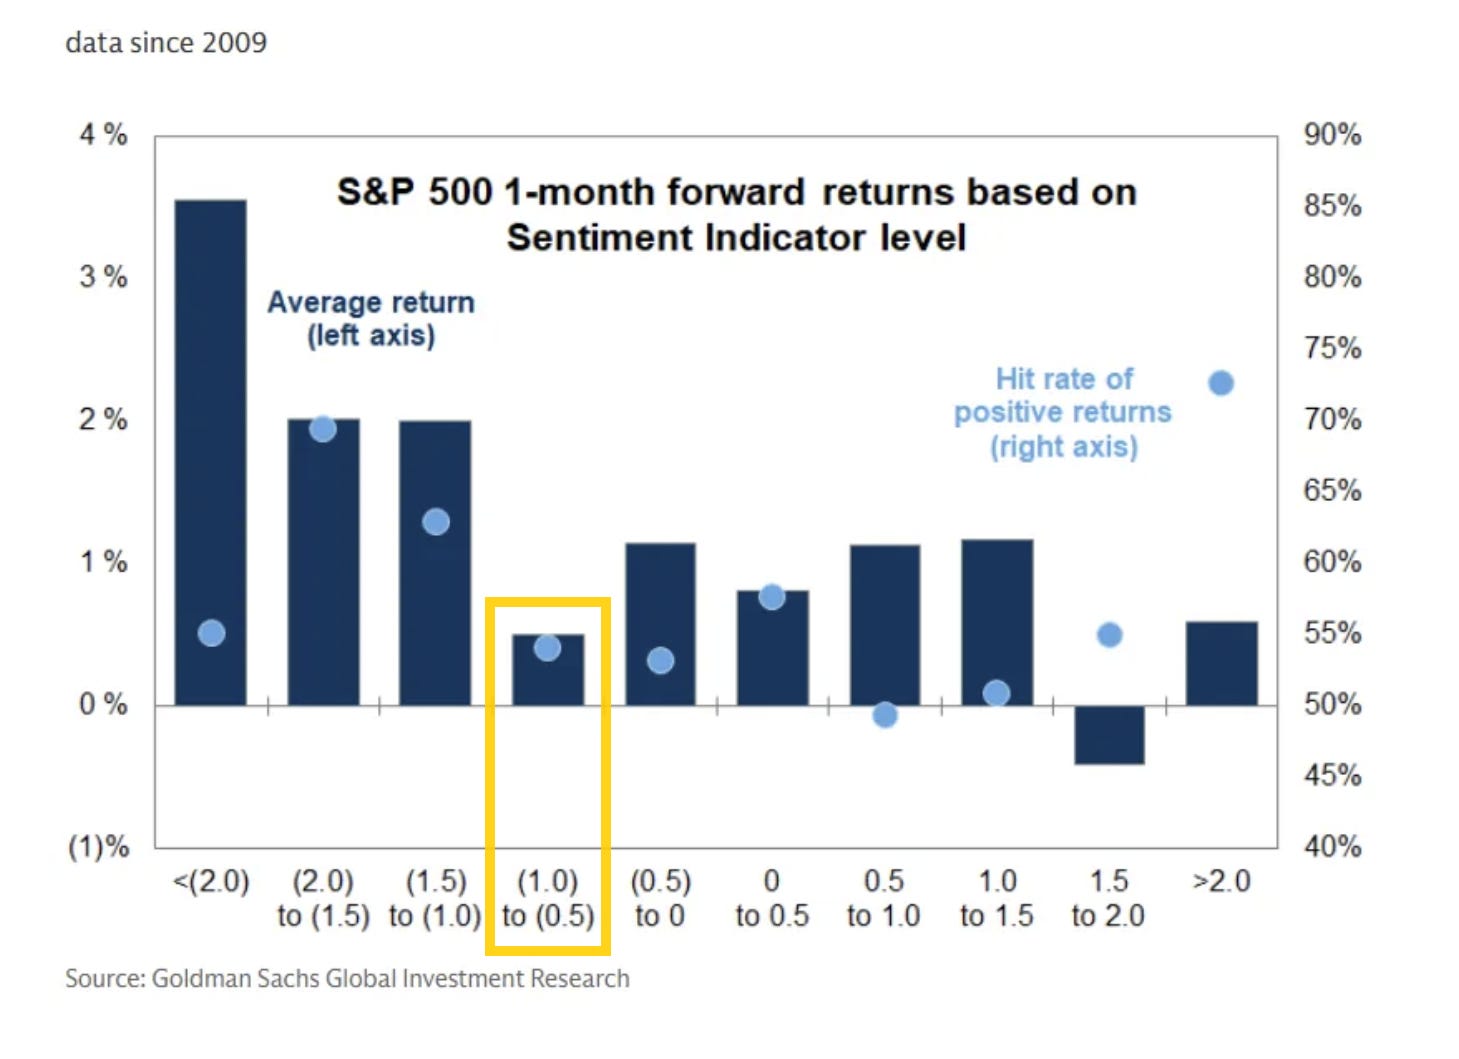
The current reading is the second worst bucket consistent with a 1-month average return of around 0.3% since 2009 with a positive rate around 53%.
*The indicator combines “six weekly and three monthly indicators that span [across the more than 80% of the US equity market that is owned by institutional, retail and foreign investors]. Readings of +1.0 or higher have historically signaled stretched equity positioning. Readings of -1.0 or lower have signaled very light positioning and have historically been a statistically significant signal for subsequent S&P 500 performance”.
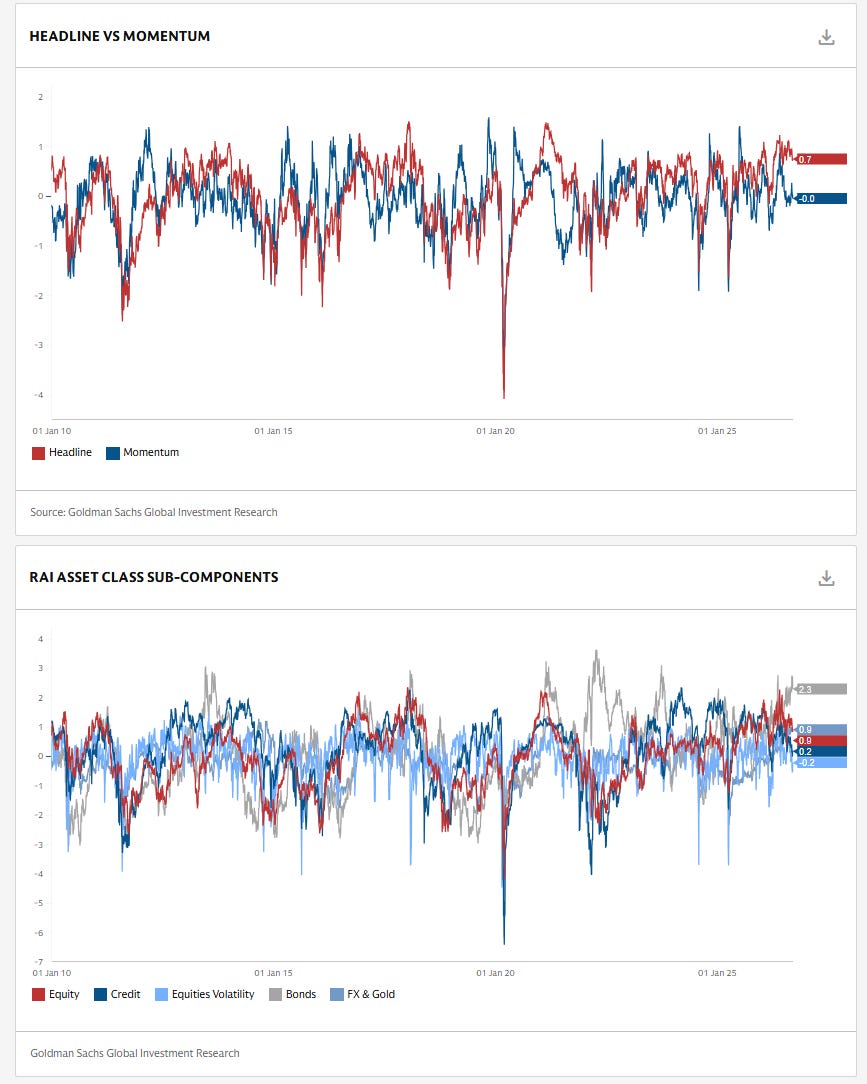
But Goldman’s Risk Appetite Indicator* remains more elevated at 0.7, although down from 0.9 the prior week, associated with returns over the next 1, 3, 6, and 12 months of +0.6%, +2.4%, +4.7%, and +8.3%, positive 64, 73, 82, and 74% of the time respectively.
*”Goldman Sachs Risk Appetite Indicator (RAI) aims to track the level of global market risk appetite and risk aversion based on various market variables. A sharp rise in the index can send a warning signal that investors have more risk appetite and are potentially exposed to a correction if consensus views are tested. Similarly, a sharp decline indicates a reduction in risk appetite, and at extreme levels it can indicate that markets may have overshot. RAI signals are most powerful when the level of risk appetite is very low below -1.5, with levels closer to -2.0 giving the clearest signal over longer time horizons, as at such levels the asymmetry of subsequent medium term equity return becomes very positively skewed. RAI momentum is designed to track short term shifts of market risk appetite, and subcomponents of the RAI.”
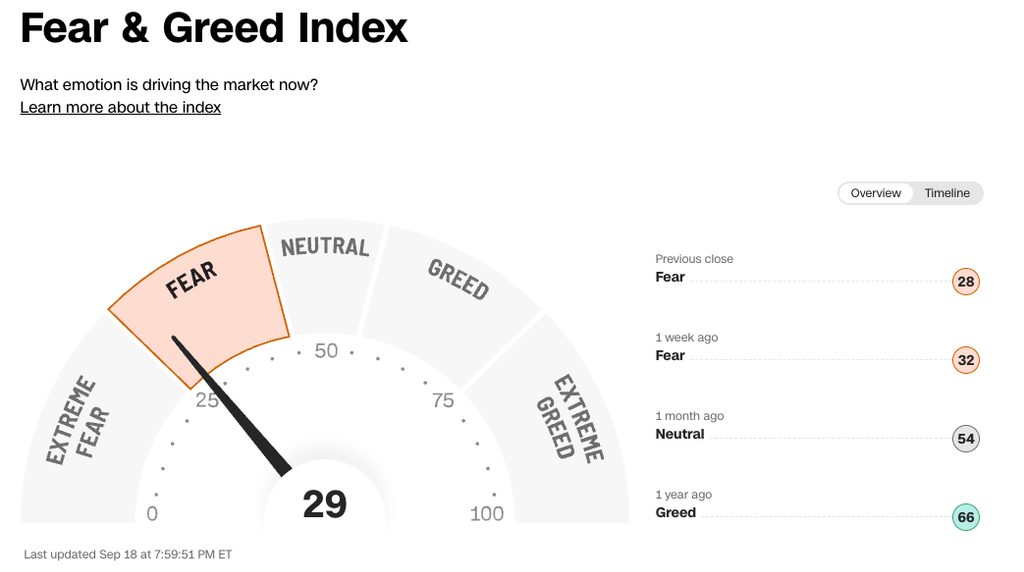
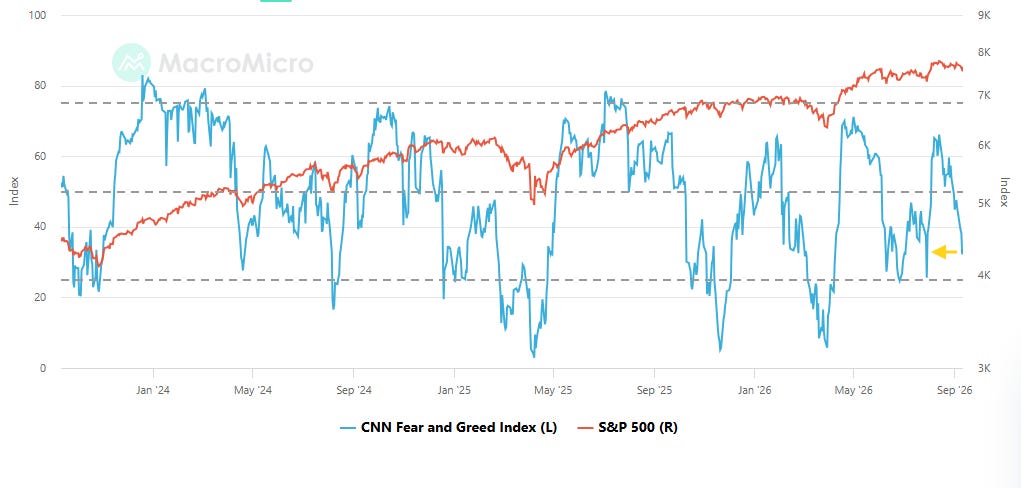
The CNN Fear & Greed Index (blue line) continued to drop down to 29.1, in the area it bottomed in June and July and remaining in “Fear”.
Now no indicators above Neutral (from one) and still five below.
As a side note, if you have any questions on the indicator, TheStreet Pro’s own Jason Meshnick is your guy, as he helped create it.
Extreme Greed = None
Greed = None
Neutral = market volatility (VIX & its 50-DMA); junk bond demand (vs investment grade) (from Greed)
Fear = market momentum (SPX vs 125-DMA); put/call options (5-day put/call ratio); safe haven demand (20-day difference in stock/bond returns)
Extreme Fear = stock price strength (net new 52-week highs); stock price breadth (McClellan Volume Summation Index)
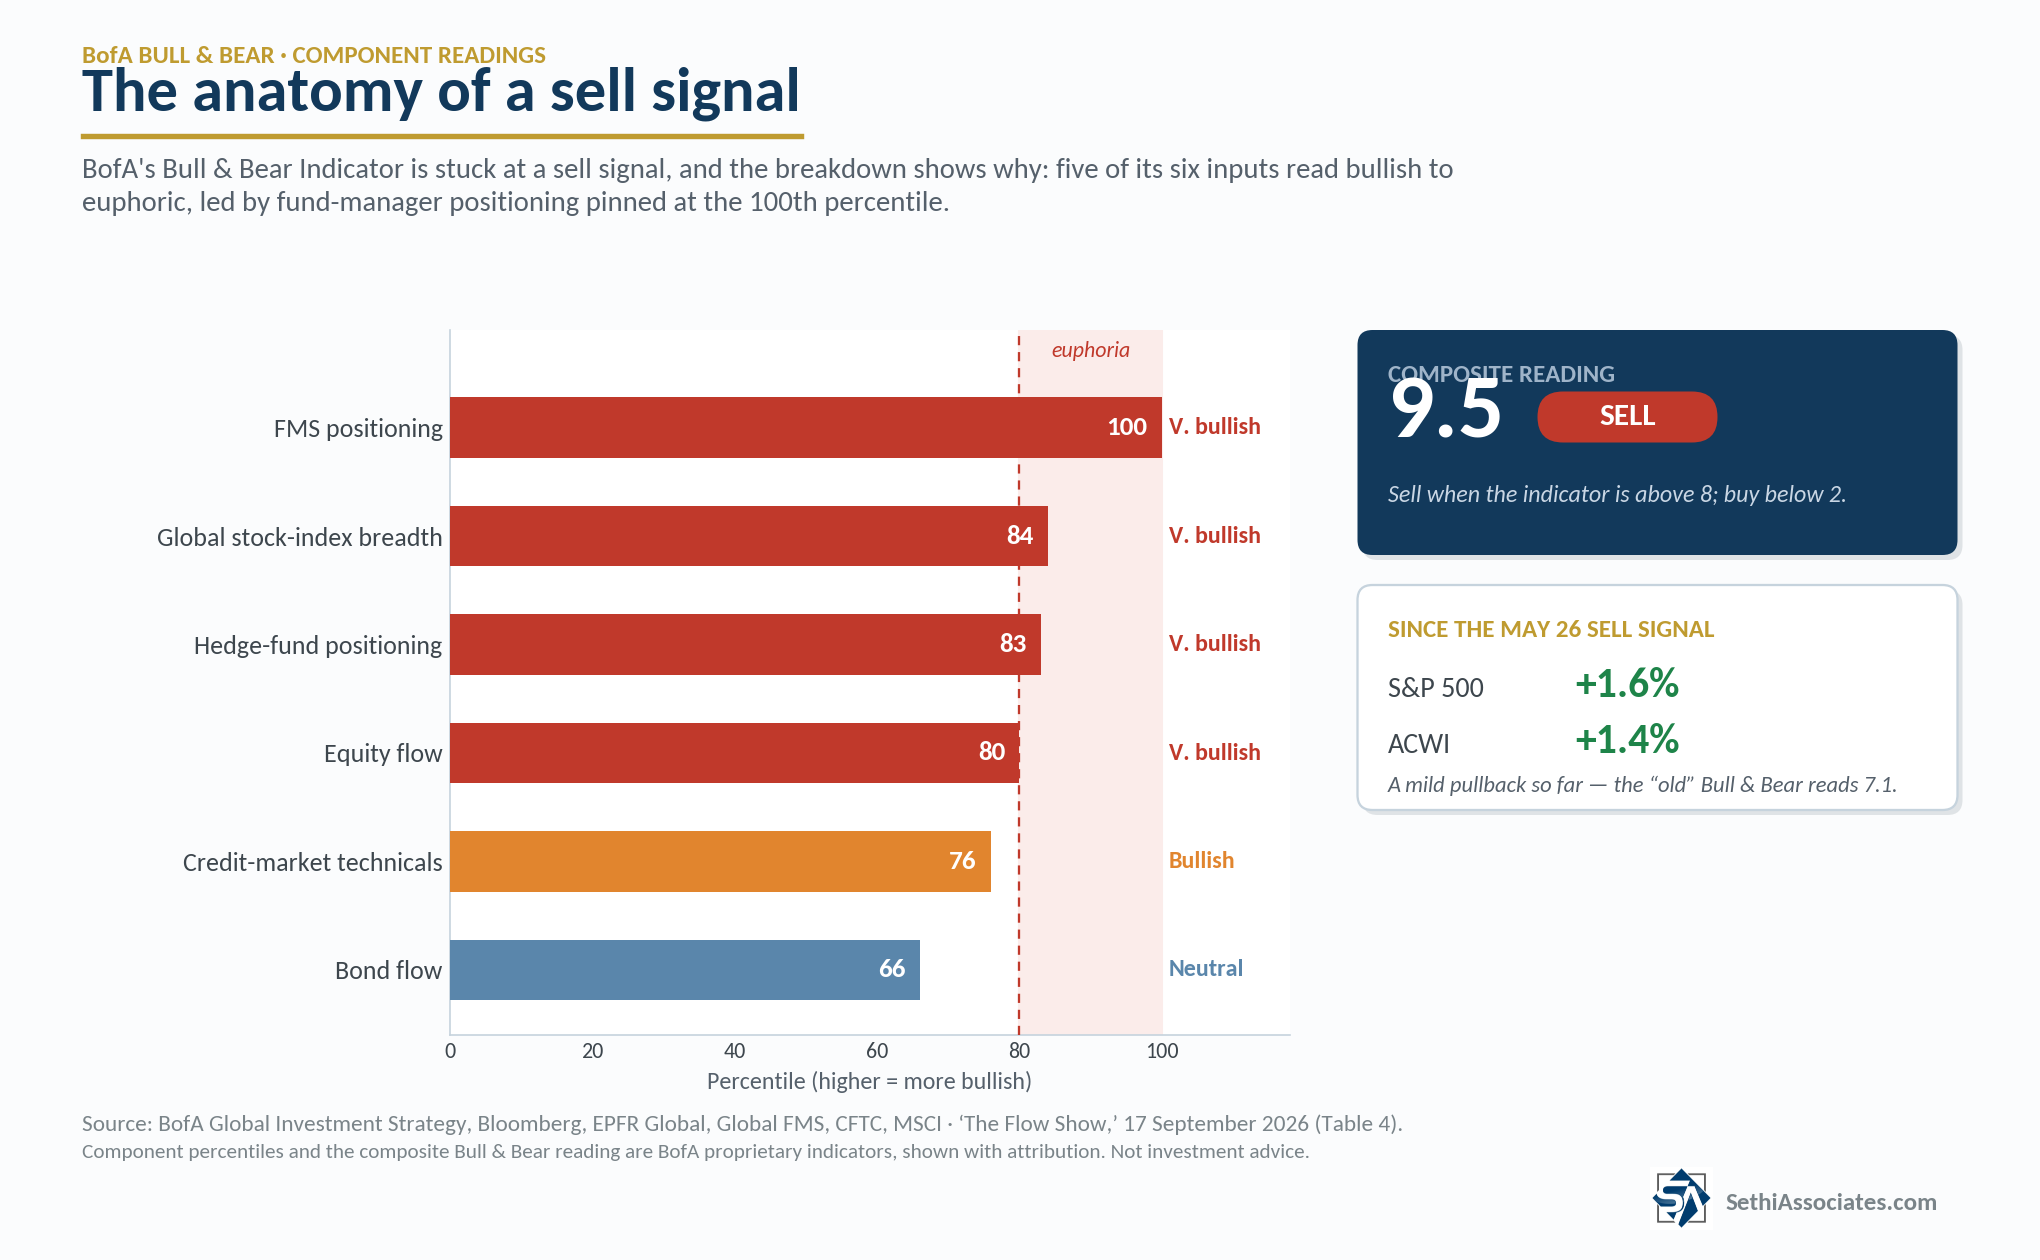
And BofA’s Bull & Bear Indicator remained at 9.5 two tenths from the joint highest since 2021 and remaining well above its sell signal (8.0) which it crossed back above the week of May 26th:
stays at 9.5 as strong inflows to global equities are offset by HY bond outflows and wider AT1 credit spreads; “sell signal” triggered May 26th; since then, SPX +1.6%, ACWI +1.4%; “old” Bull & Bear Indicator at 7.1
[From prior weeks]:
BofA Bull & Bear “sell signal” remains in place,extreme bull positioning says markets “toppy”, reduce equity exposure, retreat or rotate much smarter summer tactic for risk assets than reload.
17 “sell signals” since ‘02, average loss for global stocks over 2-3 months is 2-3% (hit ratio of ~60%), with max drawdowns of 15-20%(caveats always “tops are a process, lows are a moment”, i.e. greed harder to reverse than fear).
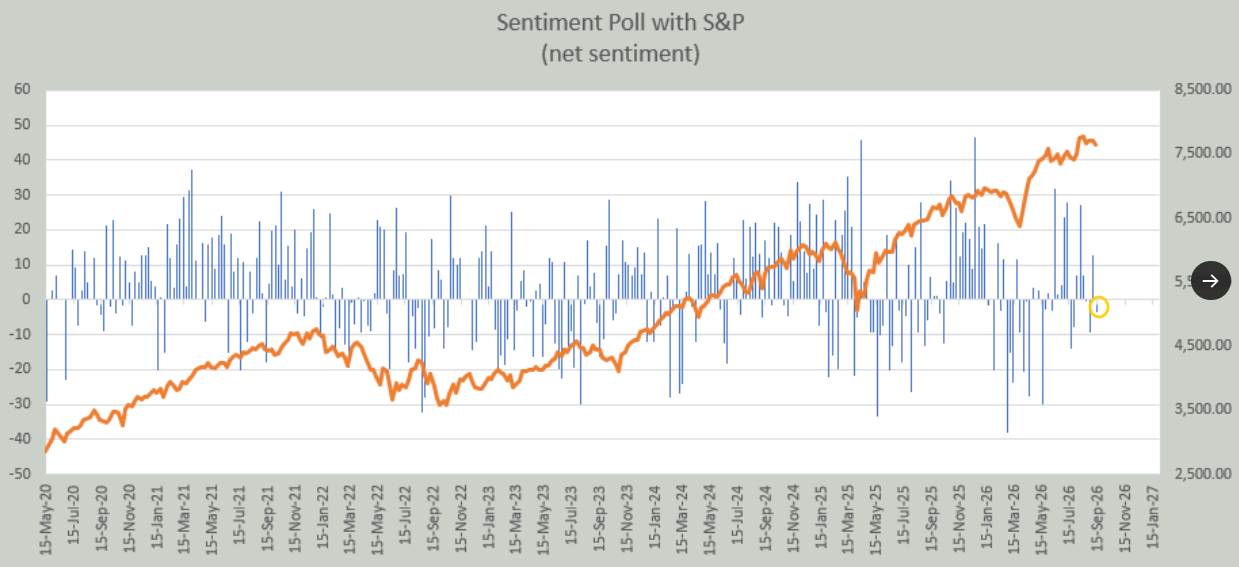
AndHelene Meisler’sX followers flipped back to bearish after being the most bullish in a month. It’s the third bearish week in four.
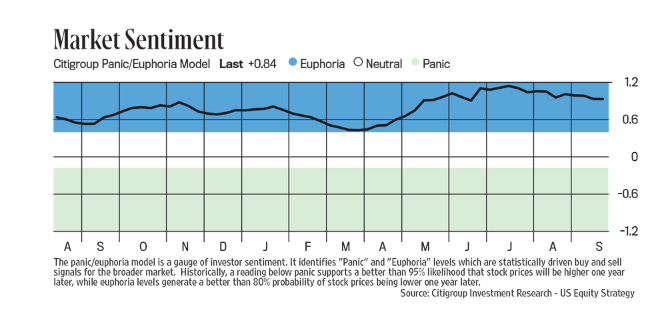
While the Citi panic/euphoria index (which Helene includesin her great weekly Substack) remains squarely in Euphoria a little off the highs.
As I mentioned previously, it has had a fairly poor track record over the past couple of years:
While the fine print says “[h]istorically…euphoria levels generate a better than 80% probability of stock prices being lower one year later,” it has seen a mixed track since the start of 2024:
-It entered euphoria in late March 2024 (when the SPX was around 5200). We didn’t get to 5200 by the end of March 2025, but we got closer than I would have thought at 5500 (and we did fall under for one day in April 2025).
-The next entry into Euphoria was in late October 2024 w/the SPX around 5800. The closest we got in October 2025 was 6550.
-The most recent entry was in July (2025) w/SPX at 6200. The lowest we got in July 2026 was 7316 (again failing the lower in one-year test). It’s been in Euphoria ever since.
As a side note, Helene’s takeaway from her ChartFest is:
It was another sloppy week in the market but at least now everyone loves the SOX again. All that broadening out talk is forgotten. And energy? Oil itself may be up ten bucks in September but XLE is flat and OIH is actually down. Rates are still hovering at 5%.
No Let-Up in the Poor Seasonality, For Now
For overall September seasonality (and the positive flip in October and November) seelast week’s post.
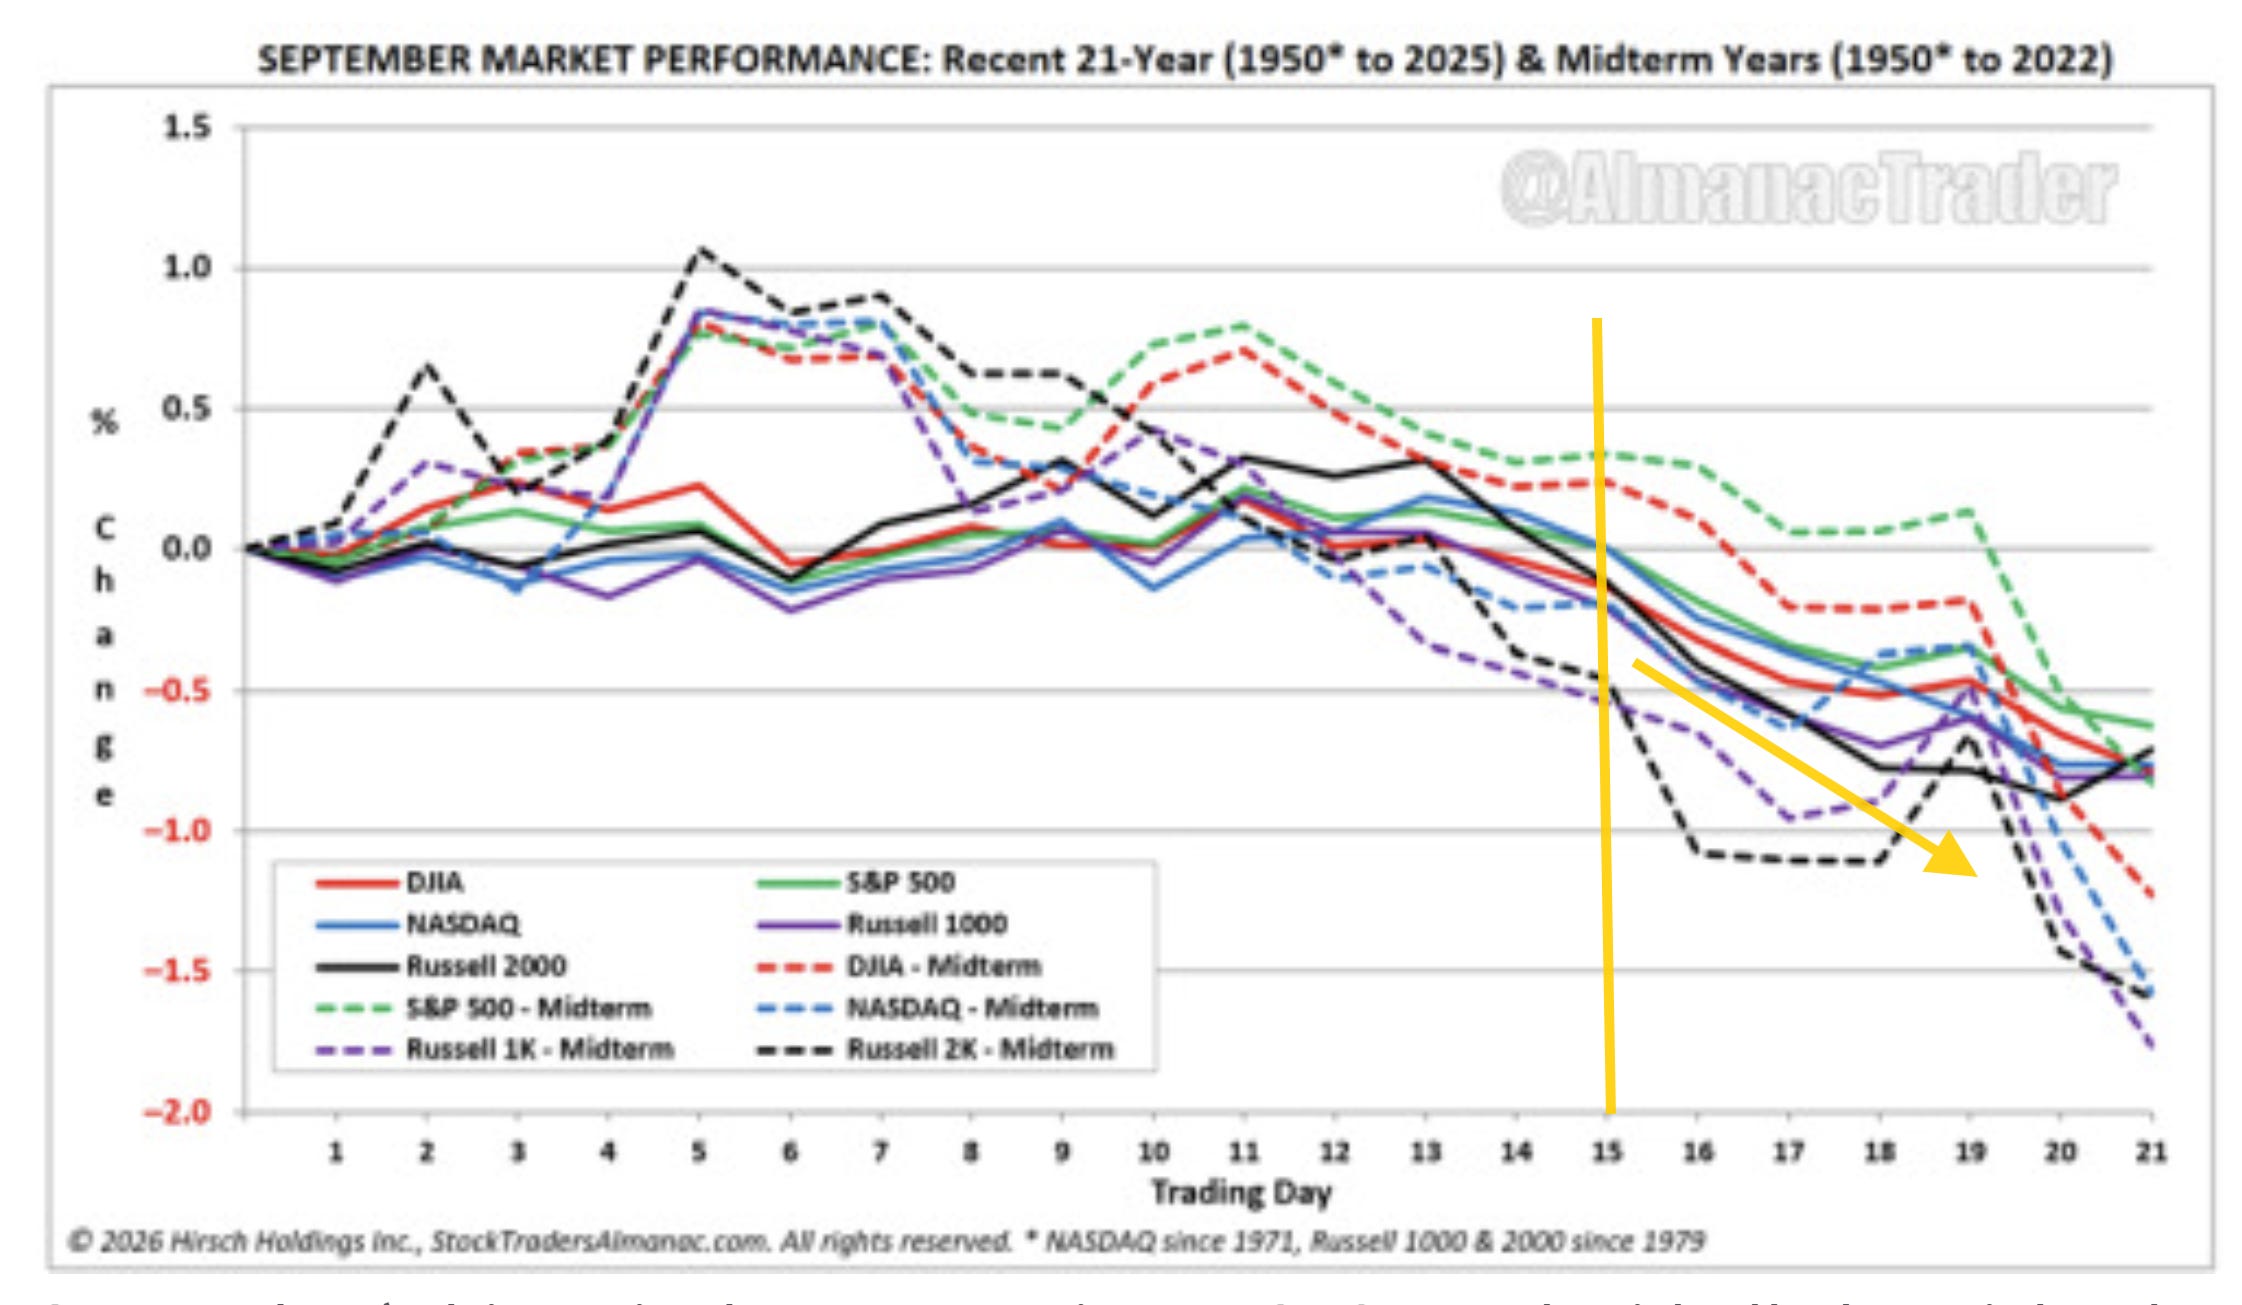
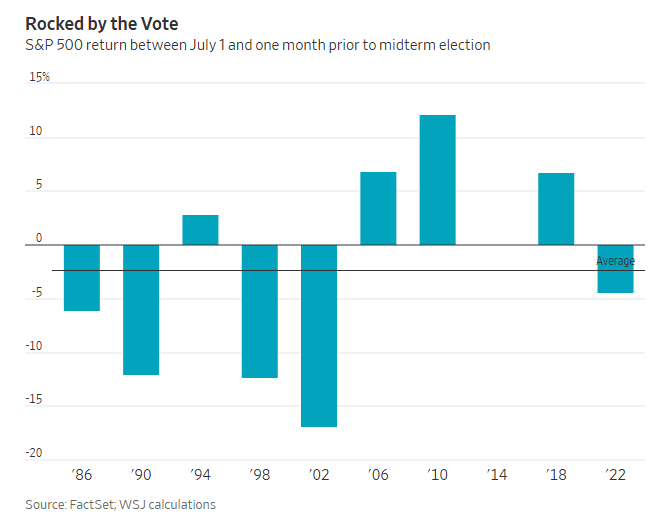
And I noted last week Jeffrey Hirsch editor of the Stock Trader’s Almanac finds September seasonally is even worse in midterm years and there’s no letup through the end of the month (Monday marks the 15th trading day):
WSJ: Between the beginning of July and a month before election day (in this case October 3rd), the S&P 500 has posted a loss half of the time with an average return of negative 2.4% over the past 40 years.
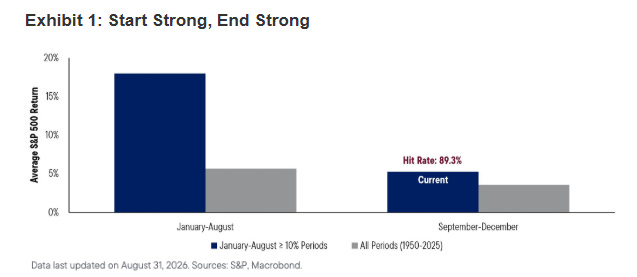
But as noted previously we can expect things to turnaround once we get past the next couple of weeks.
Jeffrey Schulze, Josh Jamner of ClearBridge Advisors:
“when the S&P 500 has gained more than 10% through August it has advanced from September through December in 25 of 28 instances, an 89% positive hit rate. These periods produced an average rest-of-year return of approximately 5.3%, well above the 3.6% average for all observations since 1950.”
Wrap-Up – Can Tech Lead the Market Higher?
I entered the post-Labor Day period with my caution levels at the highest since late July.
At that time I mentioned Citadel’s highly regarded Scott Rubner gave a detailed look at why he was looking for a September pullback:
And I mentioned last week, “perhaps my largest concern is with systematic positioning which is by any measure overweight and by some measures quite extended, leaving that positioning vulnerable”.
And, if anything, that concern has amplified this week with positioning remaining extended and selling now modeled as the “base case,” although with the caveat that there’s a relatively large difference between the SPX, which is more extended and closer to sell triggers, and the Nasdaq, which is less extended and further.
In terms of my concerns last week I also mentioned:
-negative gamma (meaning market makers are destabilizing, particularly on any moves to the downside), -a Fed chair that so far has proven to be a bit of a wildcard, a poor history for equities following both Fed rate hikes as well as sharp upward moves in longer-term interest rates as well as the 10-year hitting 5%, -tightening financial conditions, -increasingly weak breadth, -increasingly poor seasonality, and -an increasingly unfavorable macro picture of increasingly tight oil and products markets, rising food prices, rising interest rates, sticky inflation, new tariffs, and a growing AI backlash threatening that key economic boost.
The good news is some of those have faded. We’re back to a more stable positive gamma environment and we’re past the Fed meeting. While the latter was perhaps more hawkish than investors were expecting, the more important point is it is now a known quantity (we’re most likely getting one or two more hikes) and markets can (and probably have by now) incorporate it and move on.
Unfortunately, the other headwinds remain. Financial conditions continue to tighten, breadth is increasingly weak, seasonality remains poor, the macro backdrop remains challenging, and you can add decreasing buybacks to the list.
But that’s set against my list of reasons to remain bullish:
-The economy continues to look resilient, if uneven, with GDP trackers pointing to increasingly strong growth. -Earnings have been extraordinary, and while expectations are for growth to slow, it holds at double-digit levels through 2027. -Valuations have continued to ease. -Discretionary positioning is underweight leaving plenty of room for buying. -While weak both breadth and sentiment are near levels arguing for a bounce. -Retail continues to keep allocations high and has bought every dip since October 2022.
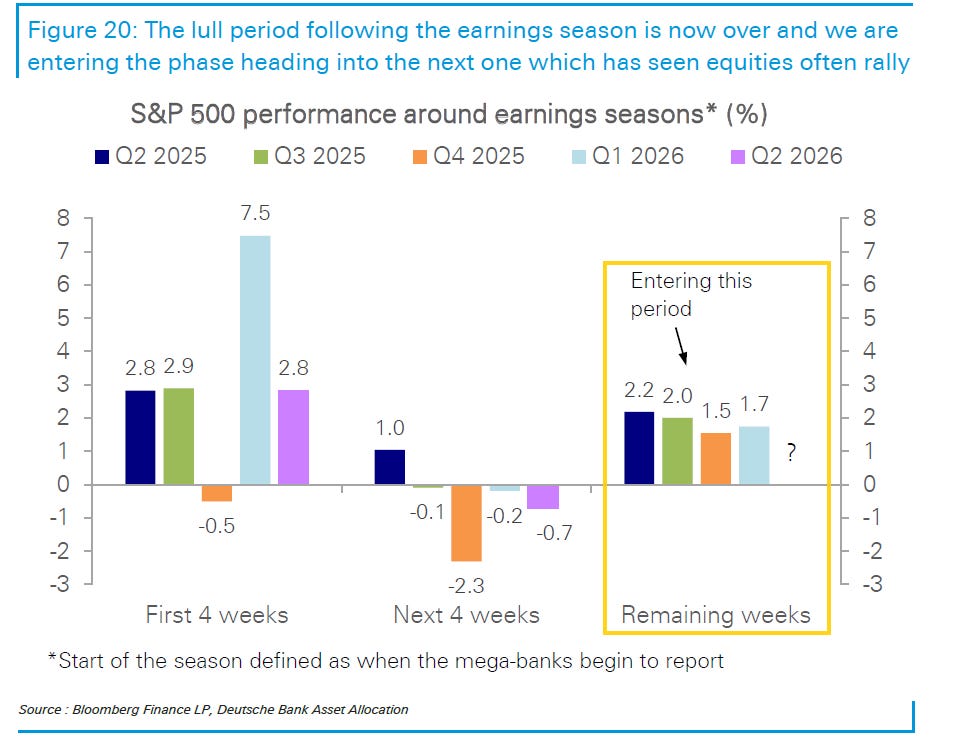
And as I mentioned last week DB says we should be entering the strong pre-earnings period for stocks. I only bring this up for a second week because I don’t know anyone who has called the twists and turns of the market this year better than them.
the period leading into the next earnings season has, in recent quarters, produced an average equity-market rally of about 2%, as attention shifts back to corporate guidance, which has been extremely robust.The question is whether that pattern repeats through September.
Equities have already absorbed a range of negative catalysts in recent weeks. In the absence of additional negative shocks, this could create an opening for equities to rally as robust earnings return to focus—before midterm-election noise intensifies.
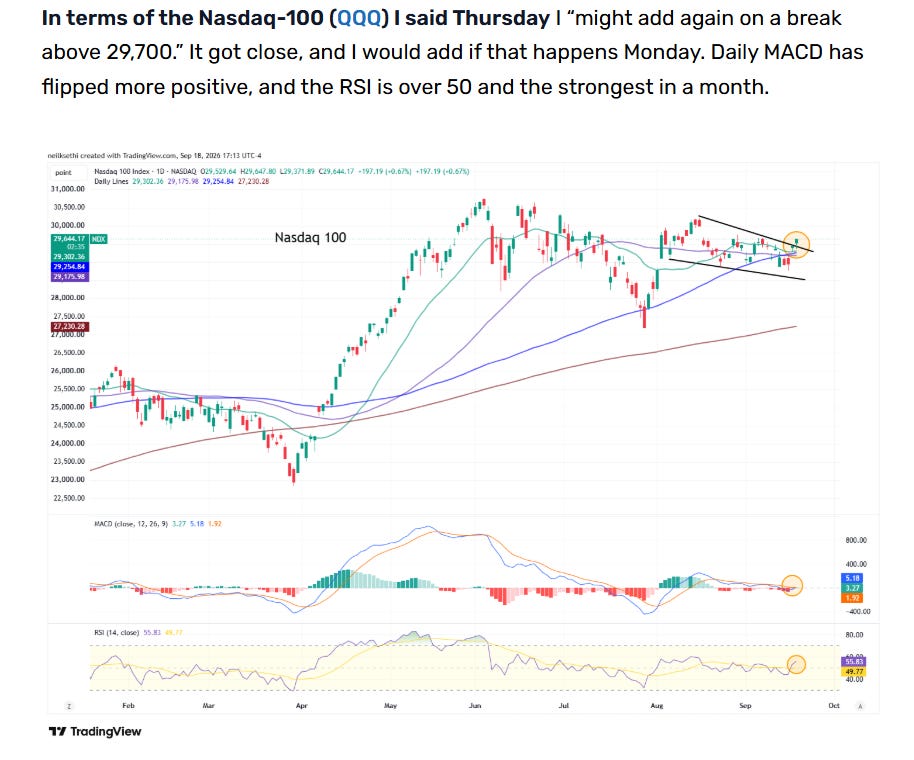
So for the first time this month it is starting to feel like the balance of risks has at least stopped deteriorating, if not improved. You can add to that an improving technical situation in the Nasdaq-100 as mentioned on Friday (and which as noted above also has a more favorable systematic set-up).
And investors have been buying Tech as discussed in the Flows section, while it’s led the market the past three sessions. I asked Friday “Is the Tech trade back?”, and it seems to have the best set-up for the week. Maybe continued buying there can bring the rest of the market along with it.
With the 10-year yield approaching 5%, a reminder that the last time we touched those levels (October 2023) we got a quick 6% pullback saved by Janet Yellen's November 2023 Treasury refunding announcement.
Oil and Yields Drive Equity Losses for a Fourth Session
Another leg higher in oil, on top of a firm inflation backdrop, lifted Treasury yields to multi-year highs, hardening Fed rate-hike bets into next week’s meeting, and driving a fourth straight day of equity losses.
Goldman: Additional hikes beyond October are possible but not our base case. One reason is that our forecast for core PCE inflation remains below the median FOMC participant’s forecast at 3.2% (vs. 3.4% for the FOMC) in 2026 Q4/Q4 and 2.2% (vs. 2.5% for the FOMC) in 2027 Q4/Q4.Show more
Goldman also notes that "the median funds rate projection remained quite elevated through 2029", and that "the median neutral rate dot rose from 3.06% to 3.25%" (the average to 3.31% from 3.21%) one of three reasons they have moved their call up from one and done to a second hike
Citadel's Rubner looks for "tactical reset" in September:
"I have remained constructive through the summer, and much of that view has played out. Earnings were exceptional. The July reset cleaned up leverage and positioning. Retail returned. Volatility collapsed. SystematicShow more