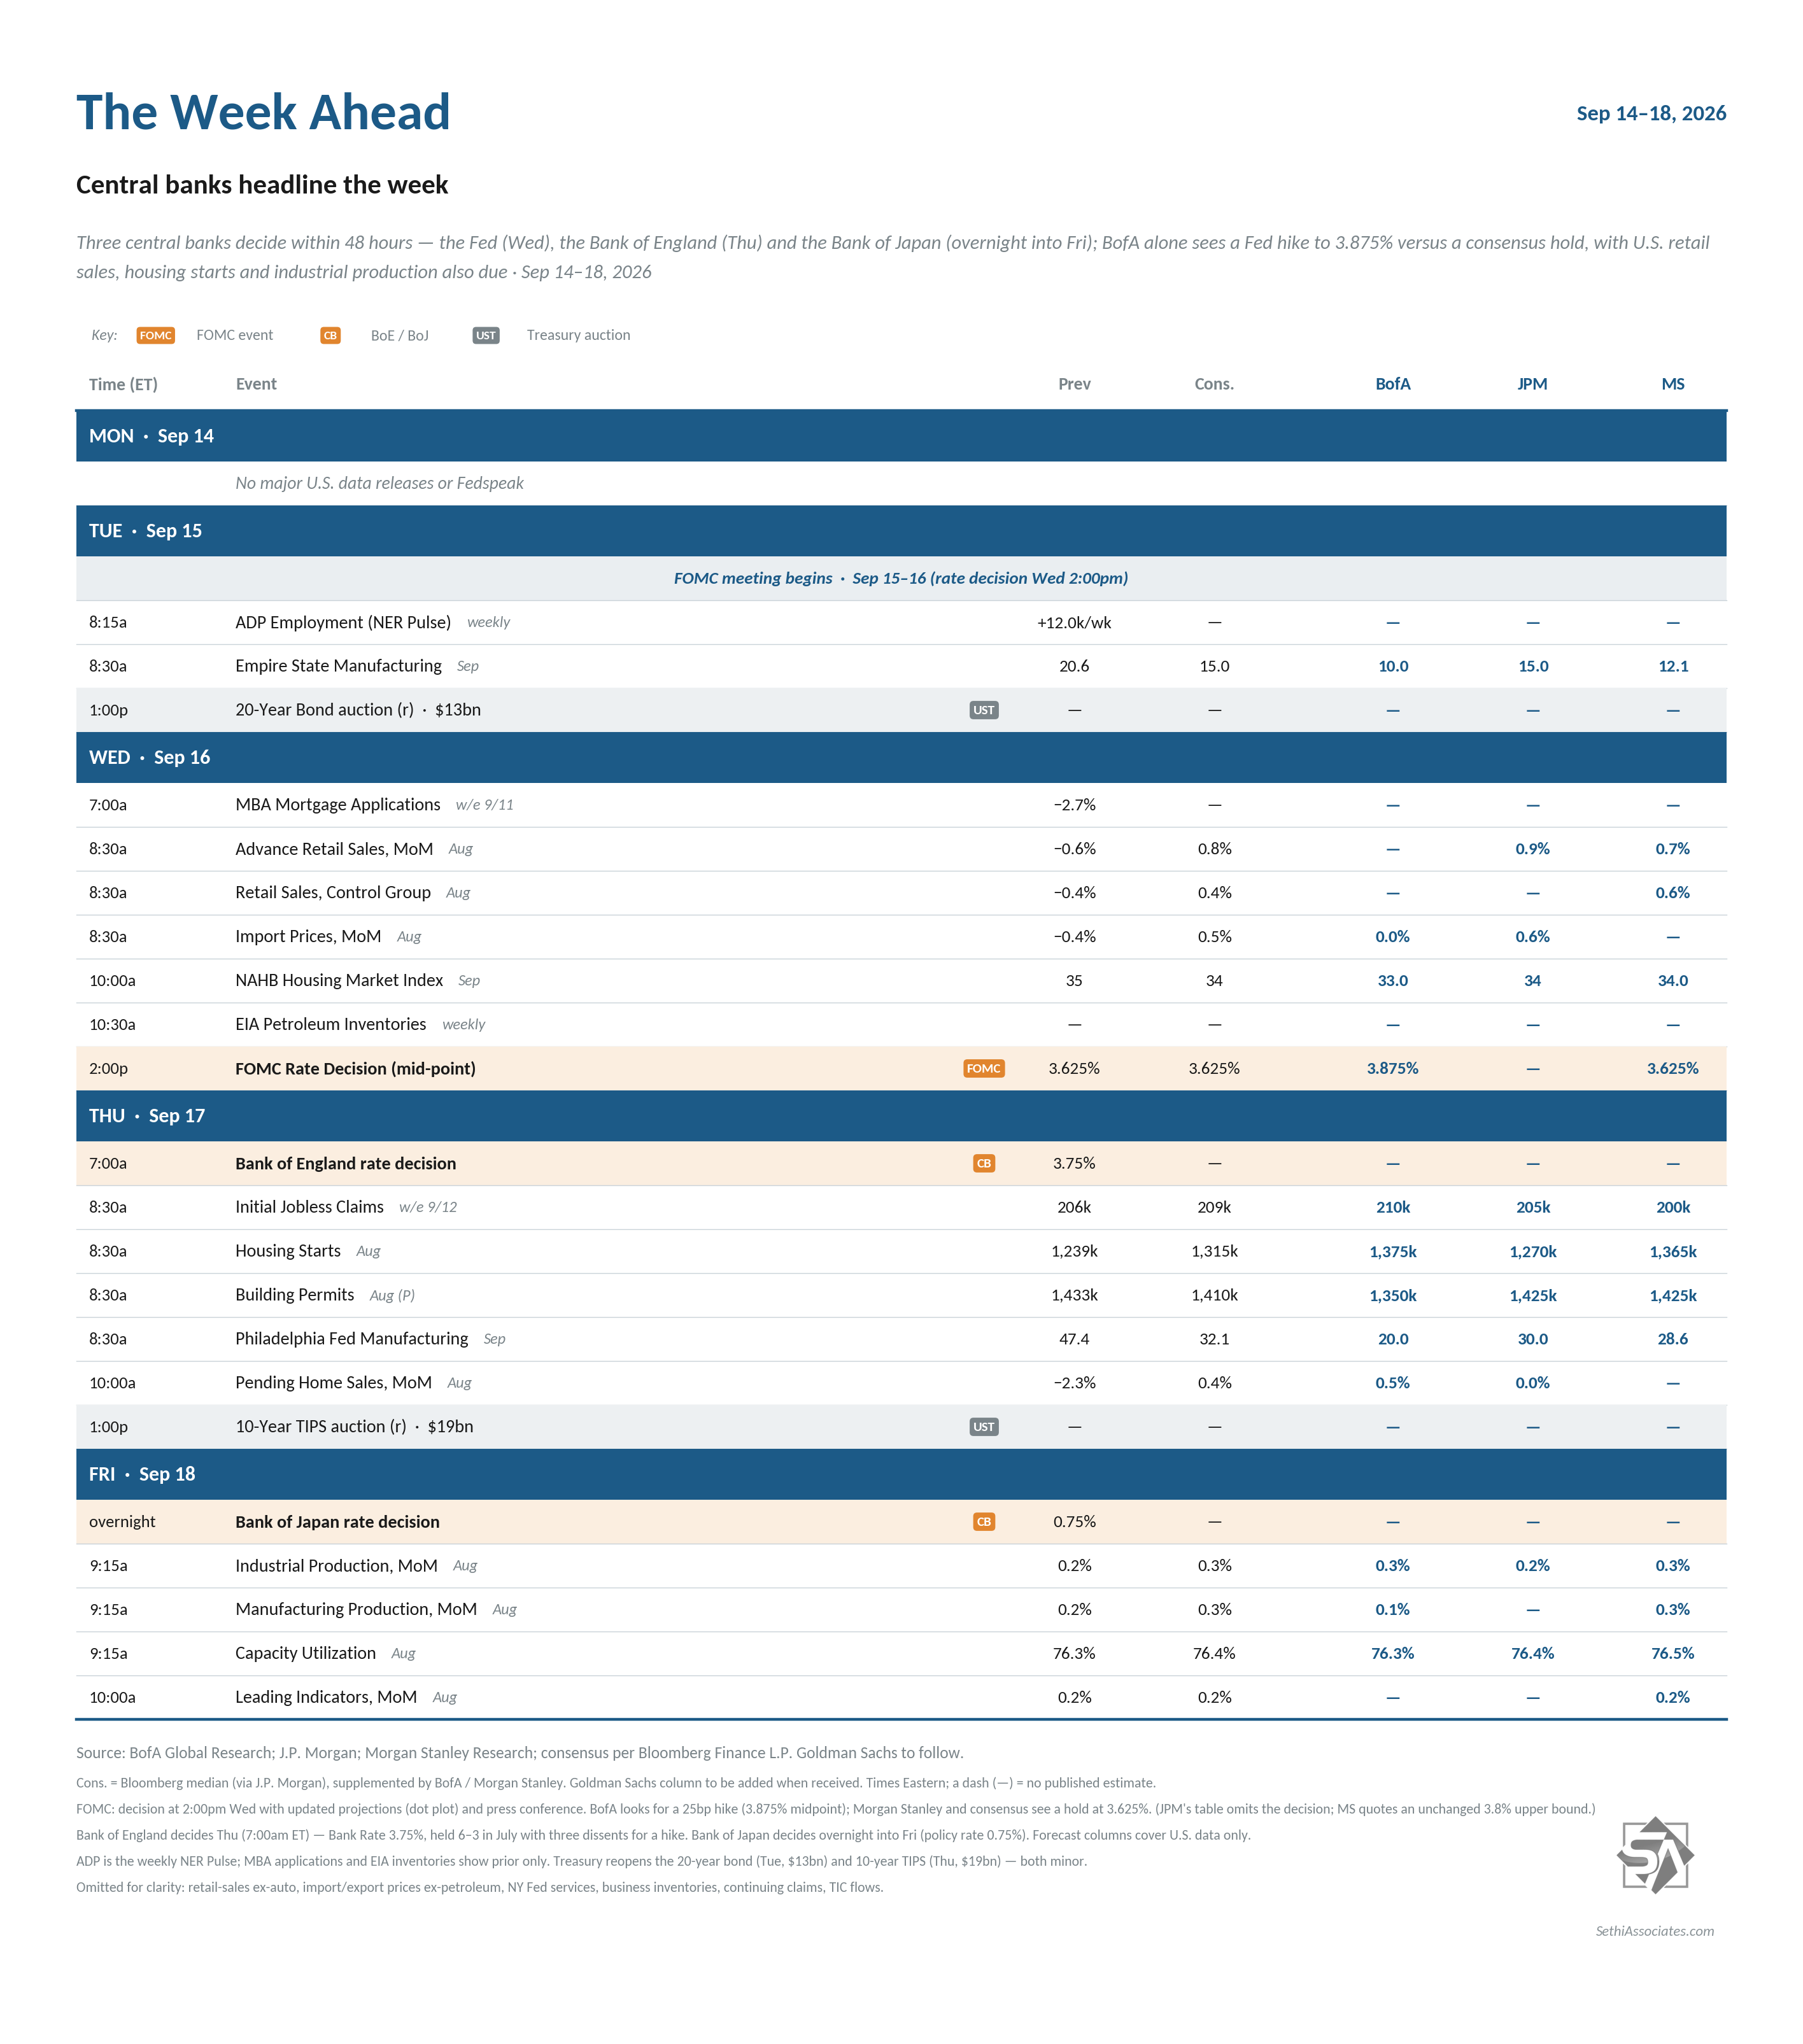
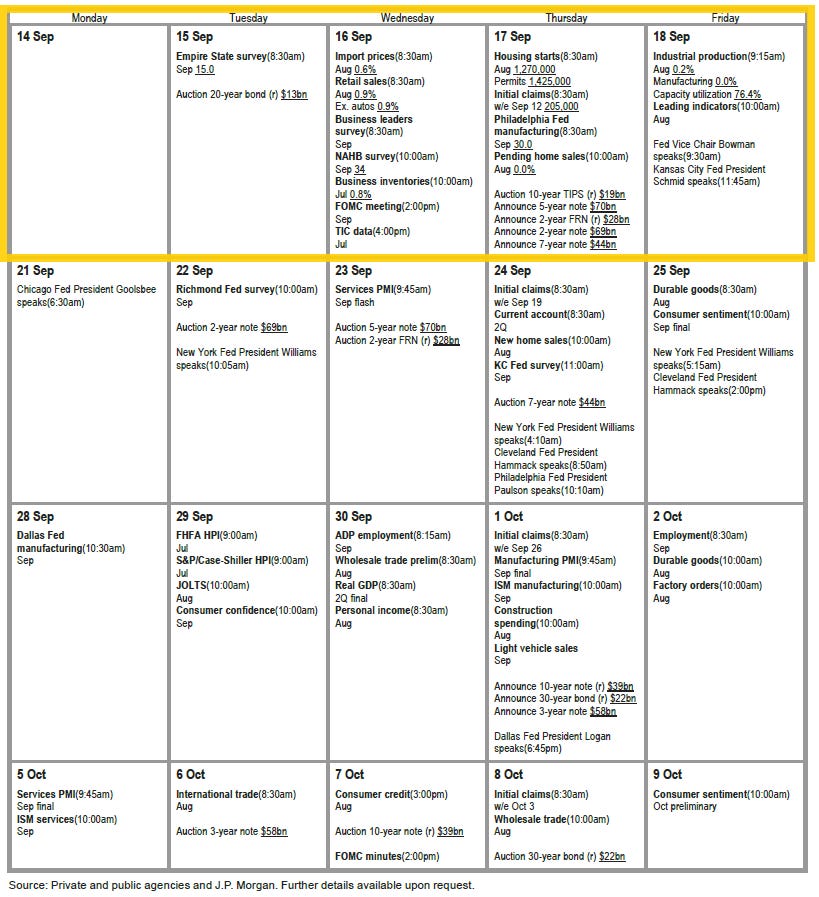
Next week brings us (finally) the September rate decision Wednesday. Endless digital ink has been spilled in the lead-up, but it appears that, like it or not, Chair Warsh is boxed in to delivering the hike the market has now almost fully priced in (he did say he wanted the markets to lead not follow, and lead they are). Absent what would be a very surprising decision to hold (or raise by 50 basis points), attention will quickly turn to the future path (how many more hikes). Importantly, we’ll be getting an updated Summary of Economic Projections (SEP), which will have a new dot plot that will tell us a lot based on where the dots are aligned for 2026 (and give us a look at 2028). More on this in the Fed section.
In US economic data, the week is full of important second-tier reports, including August retail sales, industrial production, import prices, and housing starts/permits. We’ll also get the September NAHB home builder sentiment index, some regional Fed reports, and the normal weekly reports (including ADP).
Non-Bill (>1yr in maturity) USTreasury auctionsare light with just a 20-year and a 10-year TIPS (both re-openings).
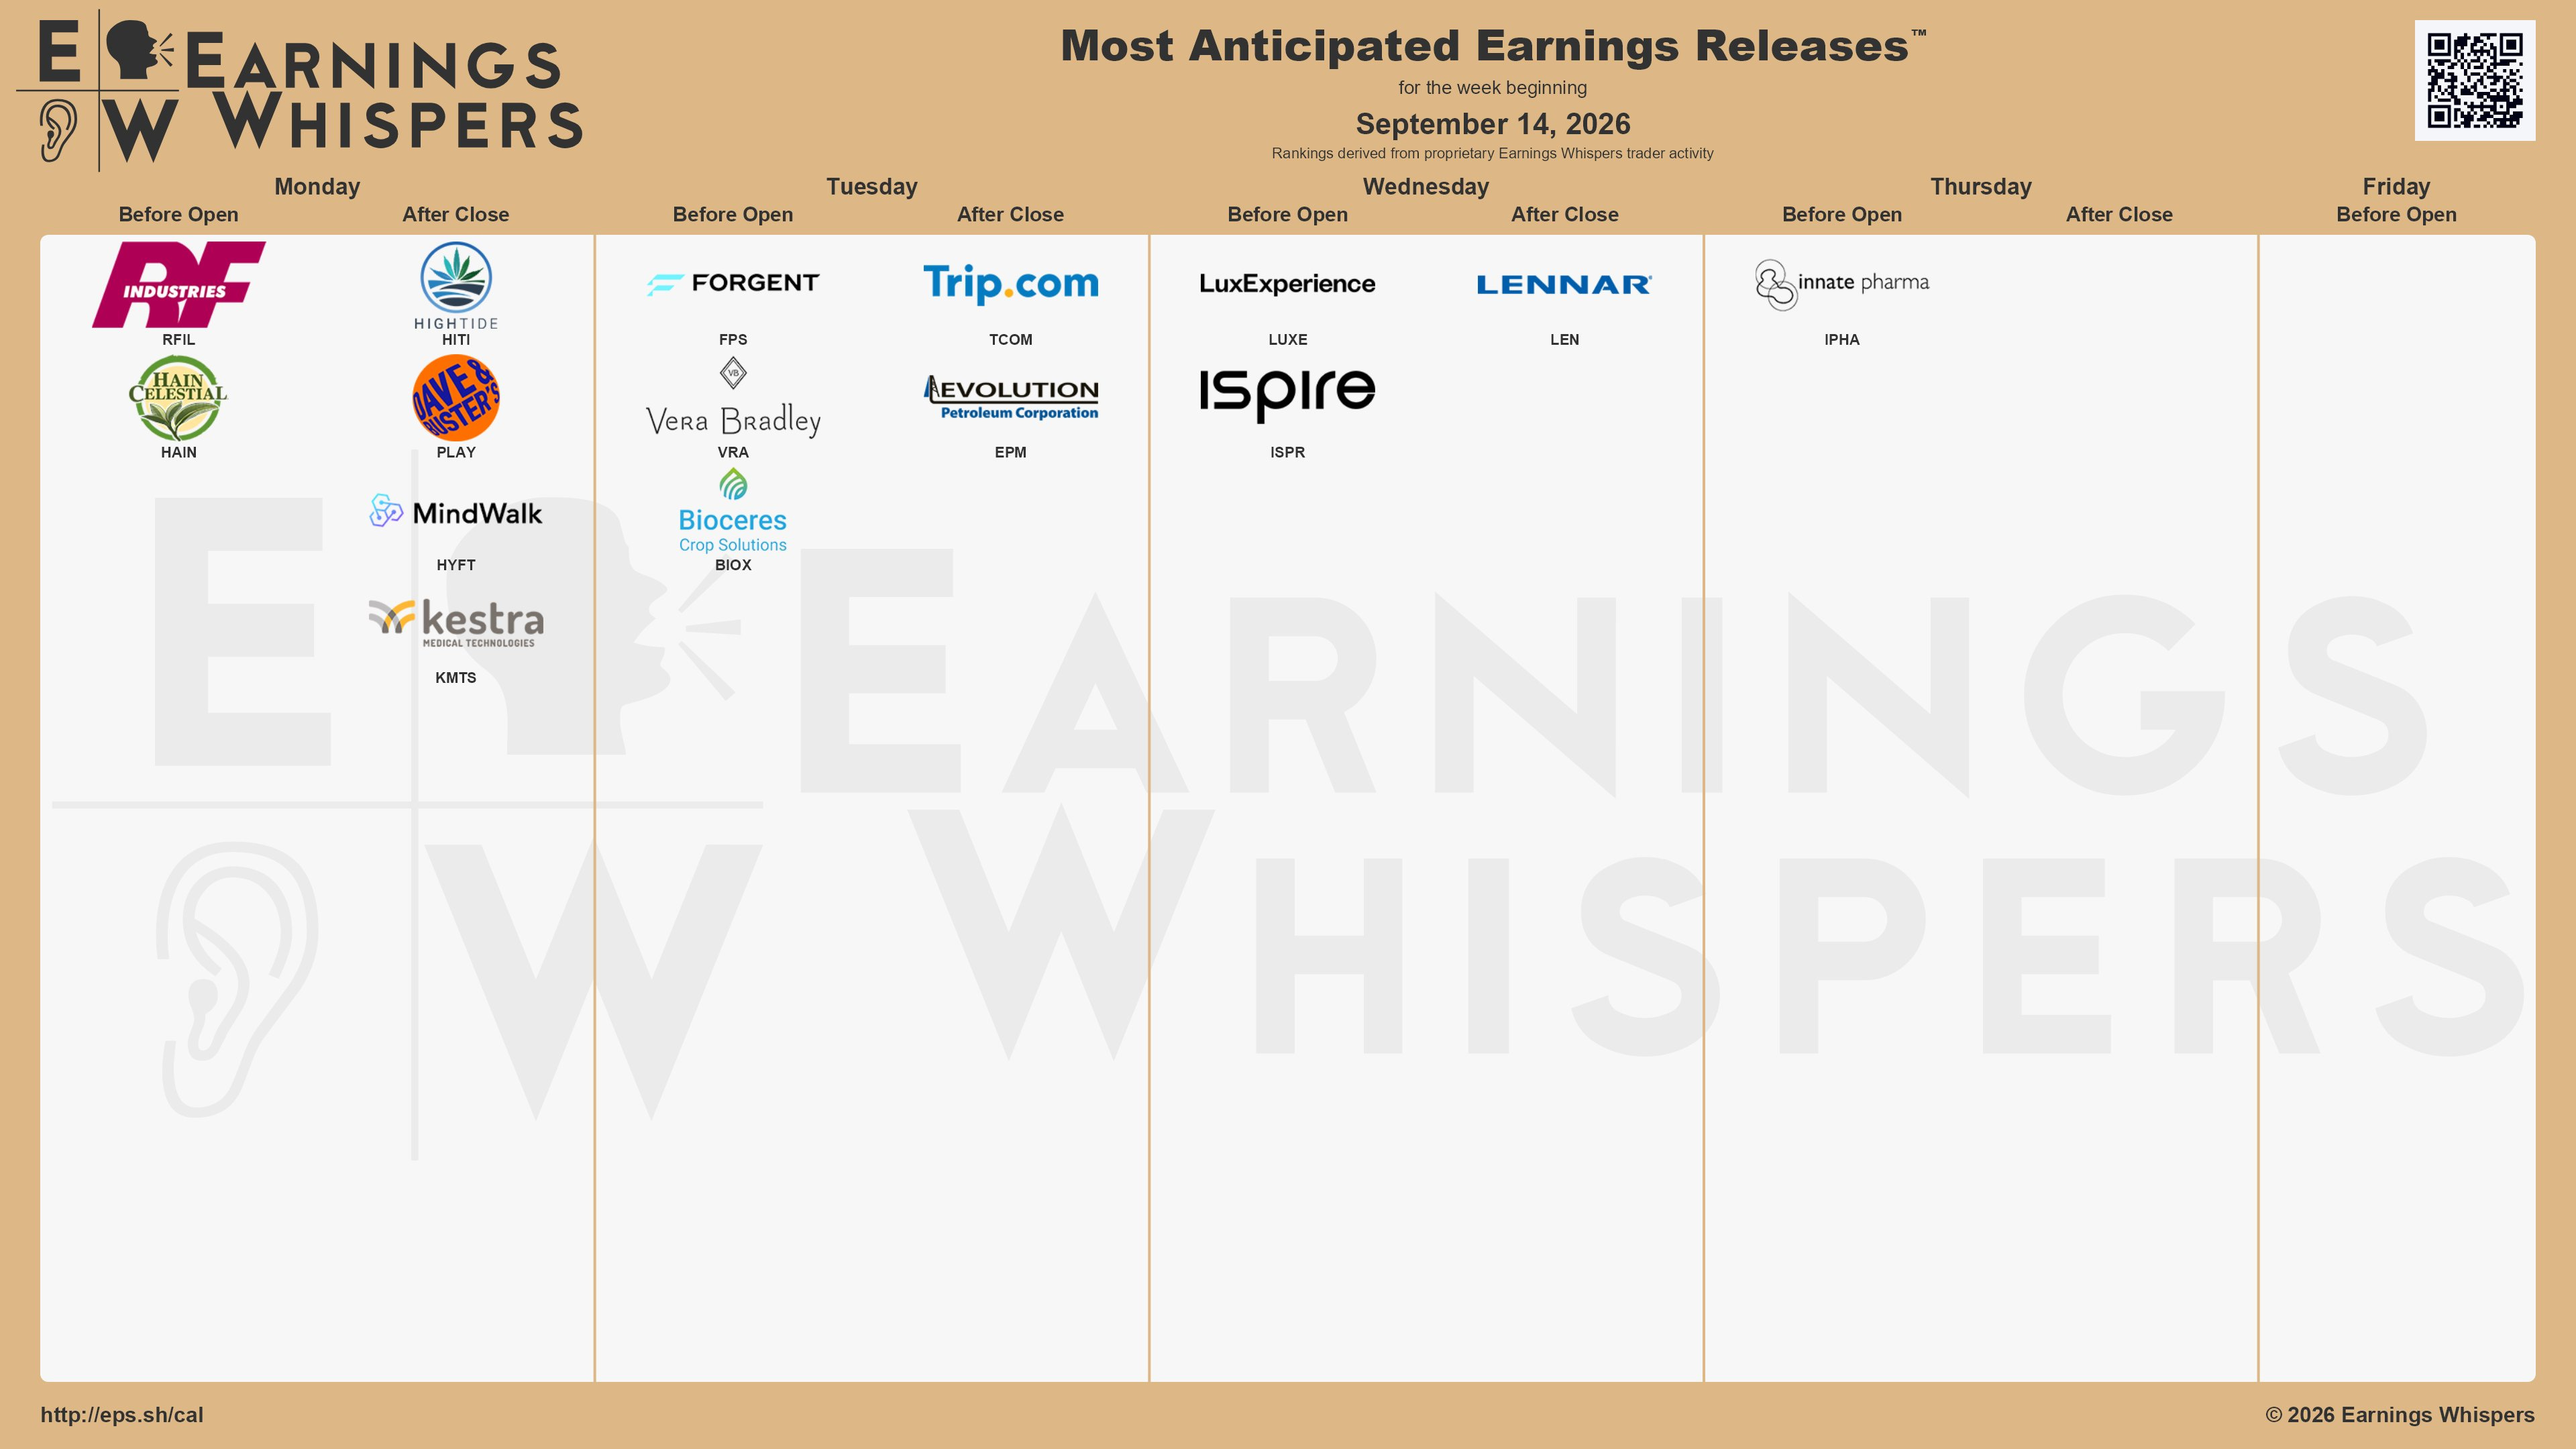
In terms of corporate events, just one SPX component reporting next week in Lennar (LEN).
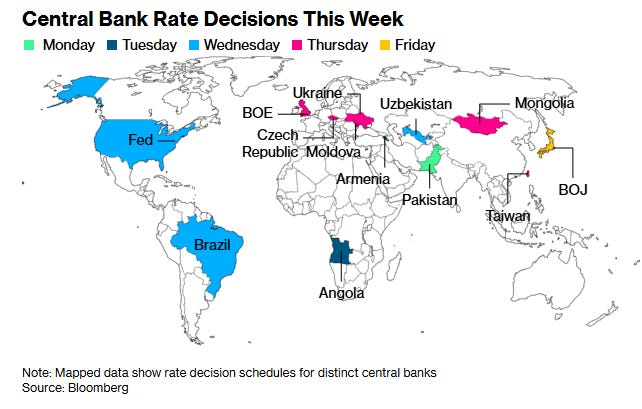
Ex-US highlights from Deutsche Bank:
Moving on to Europe, the BoE’s decision will be the main event on Thursday. Our UK economists do not expect any change to Bank Rate, currently at 3.75%, with a 6–3 vote tally. They expect the MPC to remain on the sidelines relative to other central banks.
Rounding out the key central-bank events, the BoJ’s decision is due Friday. Our Chief Japan economist expects a 25bp hike and believes the primary motivation will come from external factors—such as pressure from the US government for foreign-exchange market stability—rather than a robust improvement in domestic economic fundamentals.
Back to economic data, August CPI is due in the UK on Wednesday. Our UK economists expect price momentum to increase again in August, forecasting headline CPI to rise to 3.04% year over year and core CPI to edge lower to 2.53%. Other UK releases include labor-market data on Tuesday, followed by retail sales and the GfK consumer-confidence index on Friday.
Elsewhere in Europe, Germany’s September ZEW survey is due Tuesday, and the ECB will release its consumer-expectations survey on Friday.
In European politics, European Commission President von der Leyen will deliver the State of the Union address to the European Parliament on Wednesday, outlining priorities for the year ahead. Canada’s Prime Minister Carney will address the European Parliament the following day. Other highlights include Sweden’s general election this Sunday.
In Asia, Japan releases August national CPI on Friday, with trade data and core machinery orders due Wednesday. Our Chief Japan economist expects core CPI excluding fresh food to remain at 1.8% year over year, while core-core CPI excluding fresh food and energy is expected to rise to 2.0% from 1.9%.
In China, August activity indicators are due Tuesday. Our economists expect industrial-production growth to accelerate from 4.5% year over year to 5.0%, while retail sales and fixed-asset investment are expected to improve to 0.8% year over year and -6.5% year to date, respectively.
Rounding out geopolitics, the BRICS summit in New Delhi takes place September 12–13, with the presidents of China and Russia expected to attend. In Europe, US President Trump will visit Ireland this weekend, and NATO’s Military Committee Conference will take place in Copenhagen on September 18–19.
Looking first at the economy, my intro has remained the same since the start of the Iran conflict (and longer term more or less all of the past five years): “we continue to see it weathering the various storms remarkably well due in large part to continued resilient consumption (fueled by huge increases in wealth over the past few years despite slowing incomes) and AI-spending… with data of late showing a stable (and perhaps accelerating) economy, but one that is also boosting inflation.”
As noted previously, while things tailed off in July into the start of August, the past five weeks have seeneconomic momentum rebound outside of the housing sector (which remains sluggish). Last week outside of a weak existing home sales report we didn’t get much economic data, but the ADP weekly job growth figure continued its rebound while jobless claims remained very subdued historically. Consumer credit grew well over expectations but almost all due to student (and auto) loans.
The soft data was mixed with theNFIB small business index cooling slightly but holding above its 52-year average (see post below), the NY Fed consumer survey seeing expectations for earnings and spending growth rising even as job finding and financial situation expectations deteriorated, and the University of Michigan consumer survey falling back on a plunge in future expectations to just off record lows even as current conditions were more stable (post on that coming Monday).
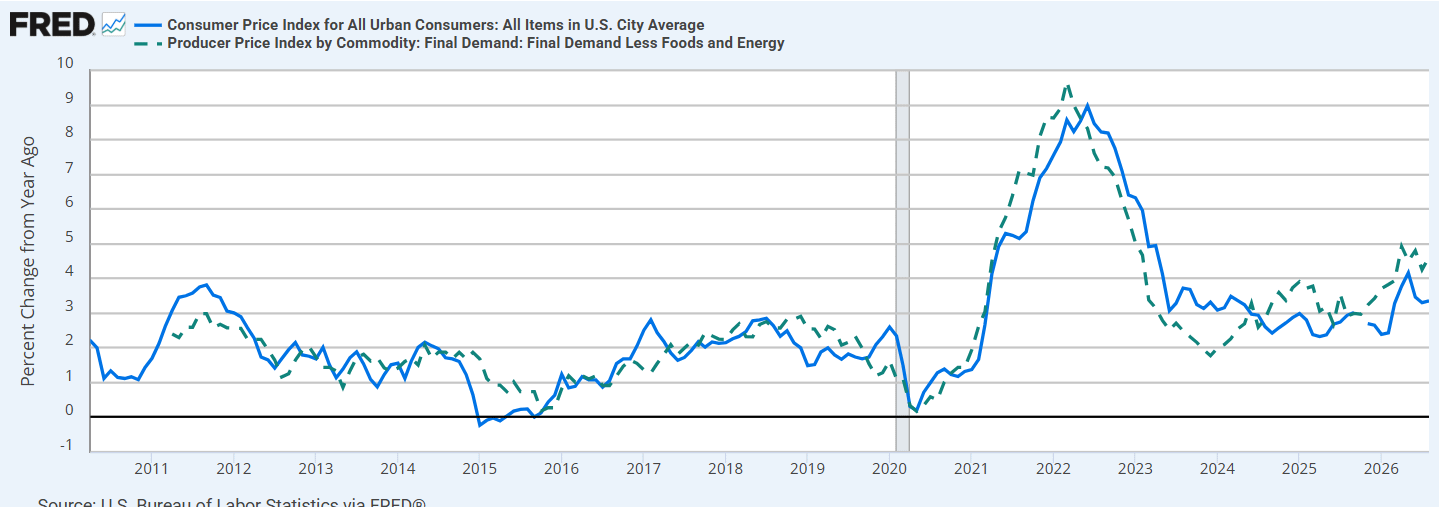
Last week, though, the focus was on inflation, and there the story was also mixed. Producer prices were hot on the headline in a rebound in energy, but core was more subdued, although at 4.63% from a year ago, it’s hard to square that with a 2% inflation target. Core CPI and PPI tend to travel together, so hopefully this is a case where PPI will move lower versus the opposite.
Which brings us to consumer prices (CPI) which came in as expected at an elevated +0.4% month-over-month due to energy (gasoline). But a hot core read (+0.29% vs +0.20% expected) catalyzed rate hike expectations (along with the unfavorable read-through of CPI and PPI components that are incorporated into core PCE). That miss on core can be chalked up to record jump in education and communication services driven by a 5.94% surge in wireless telephone services (also a record). Without that, core comes in as estimated. But such is life. And that also elevated core services ex-housing (“supercore”) a metric the Fed focuses on to the hottest m/m since January keeping the annual rate above 3%, also inconsistent with the Fed’s 2% target.
Overall, though, for now, no reason to change my outlook at this point. As I mentioned two weeks ago, “the economy was pretty strong in the first half of the year, so some giveback in July was, if anything, a yellow light and more what we should have expected.” With the recent strength, it seems that we’re back in green light territory, and one or two rate hikes (or 5% Treasury yields) won’t change that.
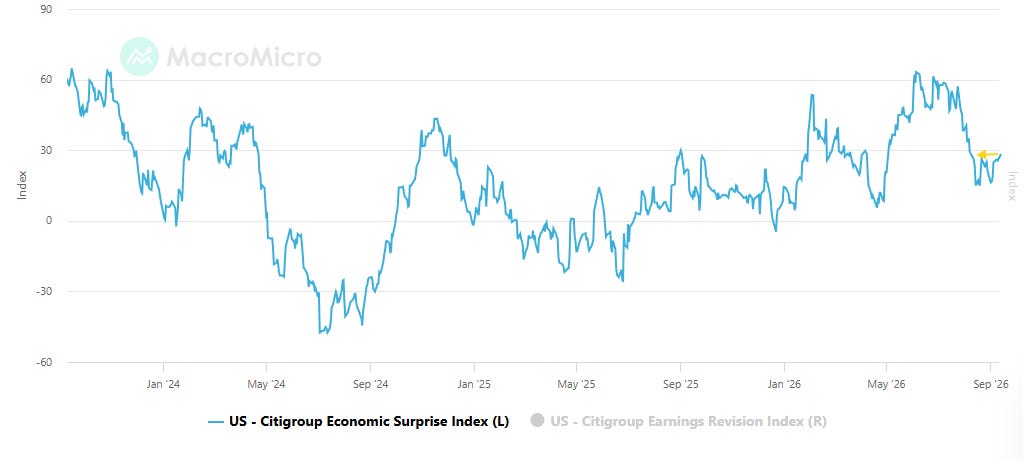
Remembering that inflation prints are included in the Citi economic surprise index (so “hot” prints elevate it), we saw that rise to 27.0, the best in a month, from 24.8, but that compares to the 57.1 July 24th.
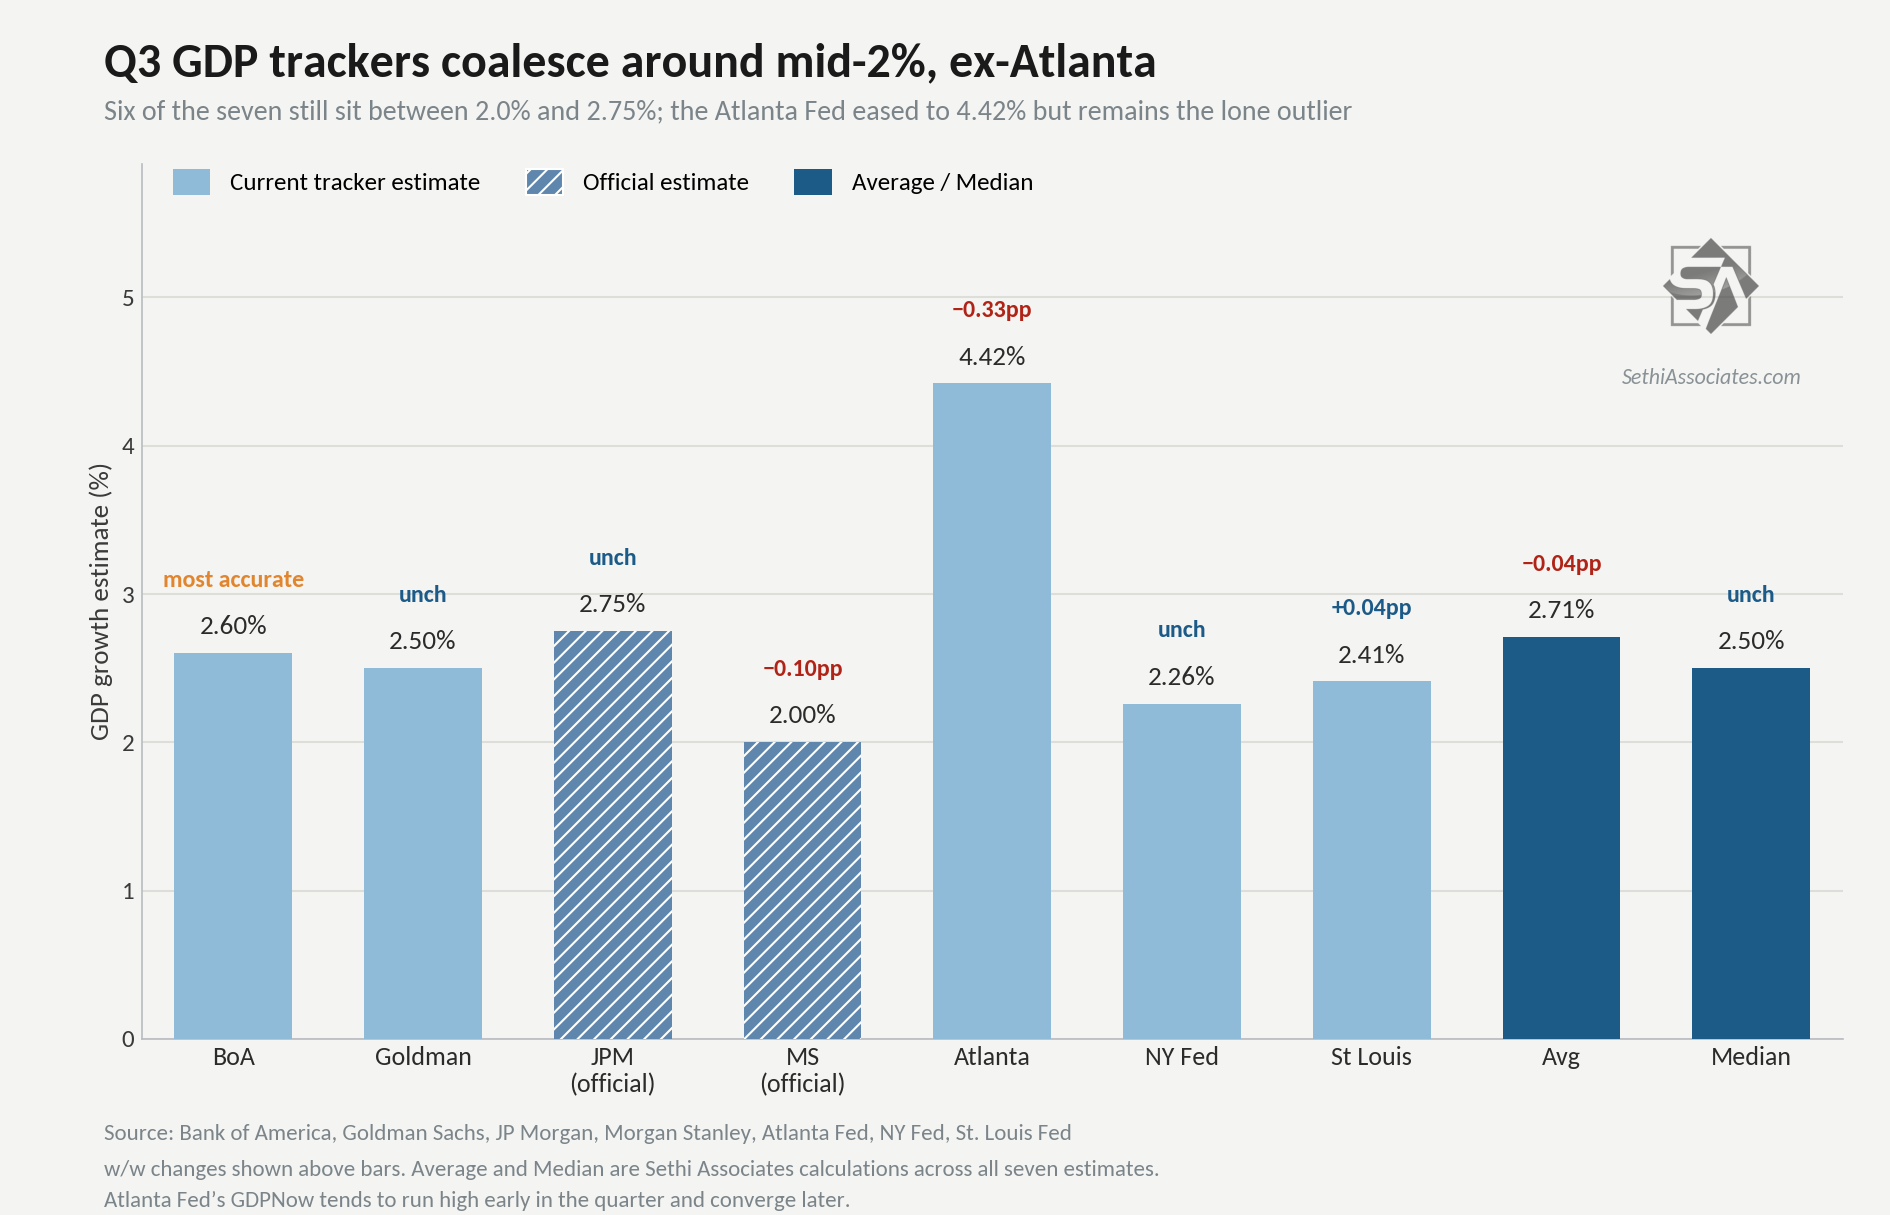
Meanwhile Q3 GDP estimates outside of the Atlanta Fed (who as a reminderhas been very high right up until the end of each of the past two quarters before falling sharply towards the other trackers) have all unusually clustered in the 2.0-2.75% range, consistent with a solid economy (always remembering GDP going into recessions generally doesn’t look like one is coming (it was up around 2% in Q2 & Q3 2008 well after the recession had started)).
BofA (who has been the most accurate over the past year) +2.6% (from +2.5% the prior week). Goldman +2.5% (+2.5%) JPM +2.75% (+2.75%) Morgan Stanley +2.0% (+2.1%) Atlanta Fed +4.42% (from +4.75%) NY Fed +2.26% (+2.26%) St Louis Fed +2.41% (+2.37%) Avg = +2.71% (from +2.75%) Median = +2.5% (from +2.50%)
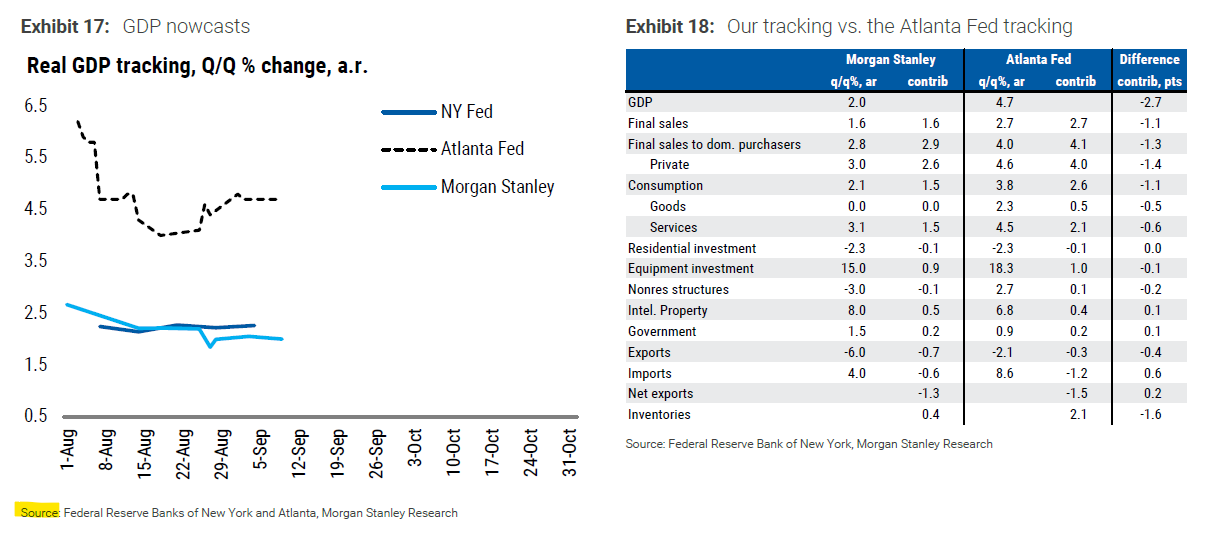
Here was MS on their GDP change and continued discrepancy with the Atlanta Fed:
Our 3Q GDP tracking fell a tenth to 2.0% in the latest week after existing home sales lowered our residential investment estimate. The Atlanta Fed’s estimate, much higher than ours, was unchanged at 4.7% [note this was before the latest update]. Its goods consumption estimate, at 2.3%, is 2¼ points above ours; its services estimate, at 4.5%, is 1½ point above ours. It also allows for much faster inventory investment than we do. The New York Fed nowcast moved up a tenth to 2.3%, mostly reflecting strong August payrolls.
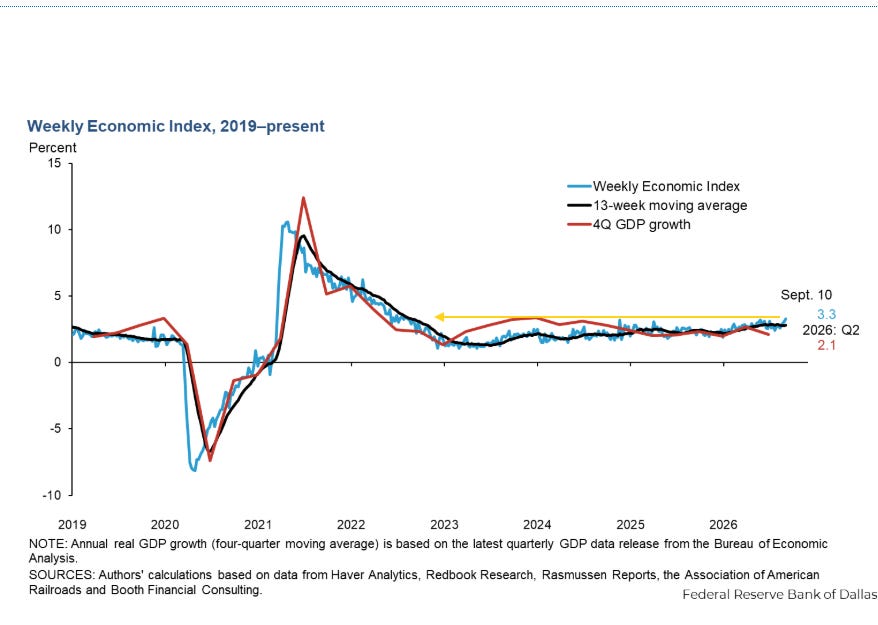
And as you know if you’re a regular reader, one of my favorite GDP trackers is theWeekly Economic Indexfrom the Dallas Fed.*
In the week through August 29th (so doesn’t have last week’s data) jumped to +3.27%, the best since August 2022, from +3.02% the prior week.
The 13-week average reaccelerated to 2.80%, just a little under the 2.87% on July 24th which was also the best since 2022, continuing to evidence economic momentum that is above trend.
*The WEI is scaled as a y/y rise for real GDP(so different than most GDP trackers which are Q/Q SAAR) and uses 10 daily and weekly economic series but runs a week behind other GDP trackers.
It has over time had one of the highest correlations with actual GDP of any tracker(see chart)although for Q2 it came in highpredicting +2.80% y/y GDP growth vs the actual first estimate of +2.10%, while for Q1 it predicted +2.48% vs 2.66%. More importantly, it has consistently indicated no recession and relatively healthy growth since the pandemic (which is what we’ve experienced).
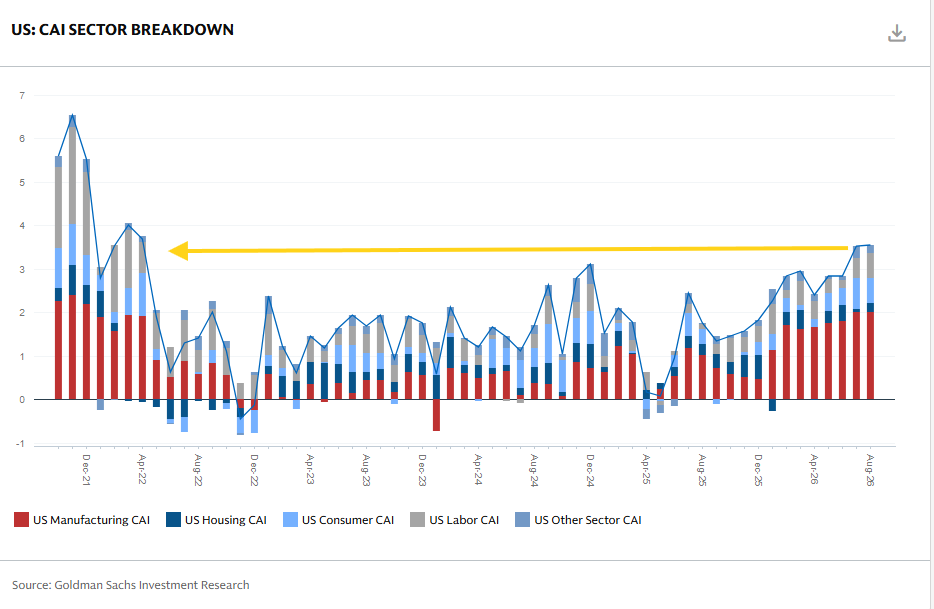
While Goldman’s August US Current Activity Indicator* eased back a tenth to +3.5% but that remains (along with an upgraded July) the best since April 2022. That continues the strongest 8-month period since then as well, as the manufacturing component is getting more help from other sectors, although still represents 2.0% of that 3.5% reading.
*The CAI is their “real-time measure of inflation-adjusted economic momentum using 37 inputs.”
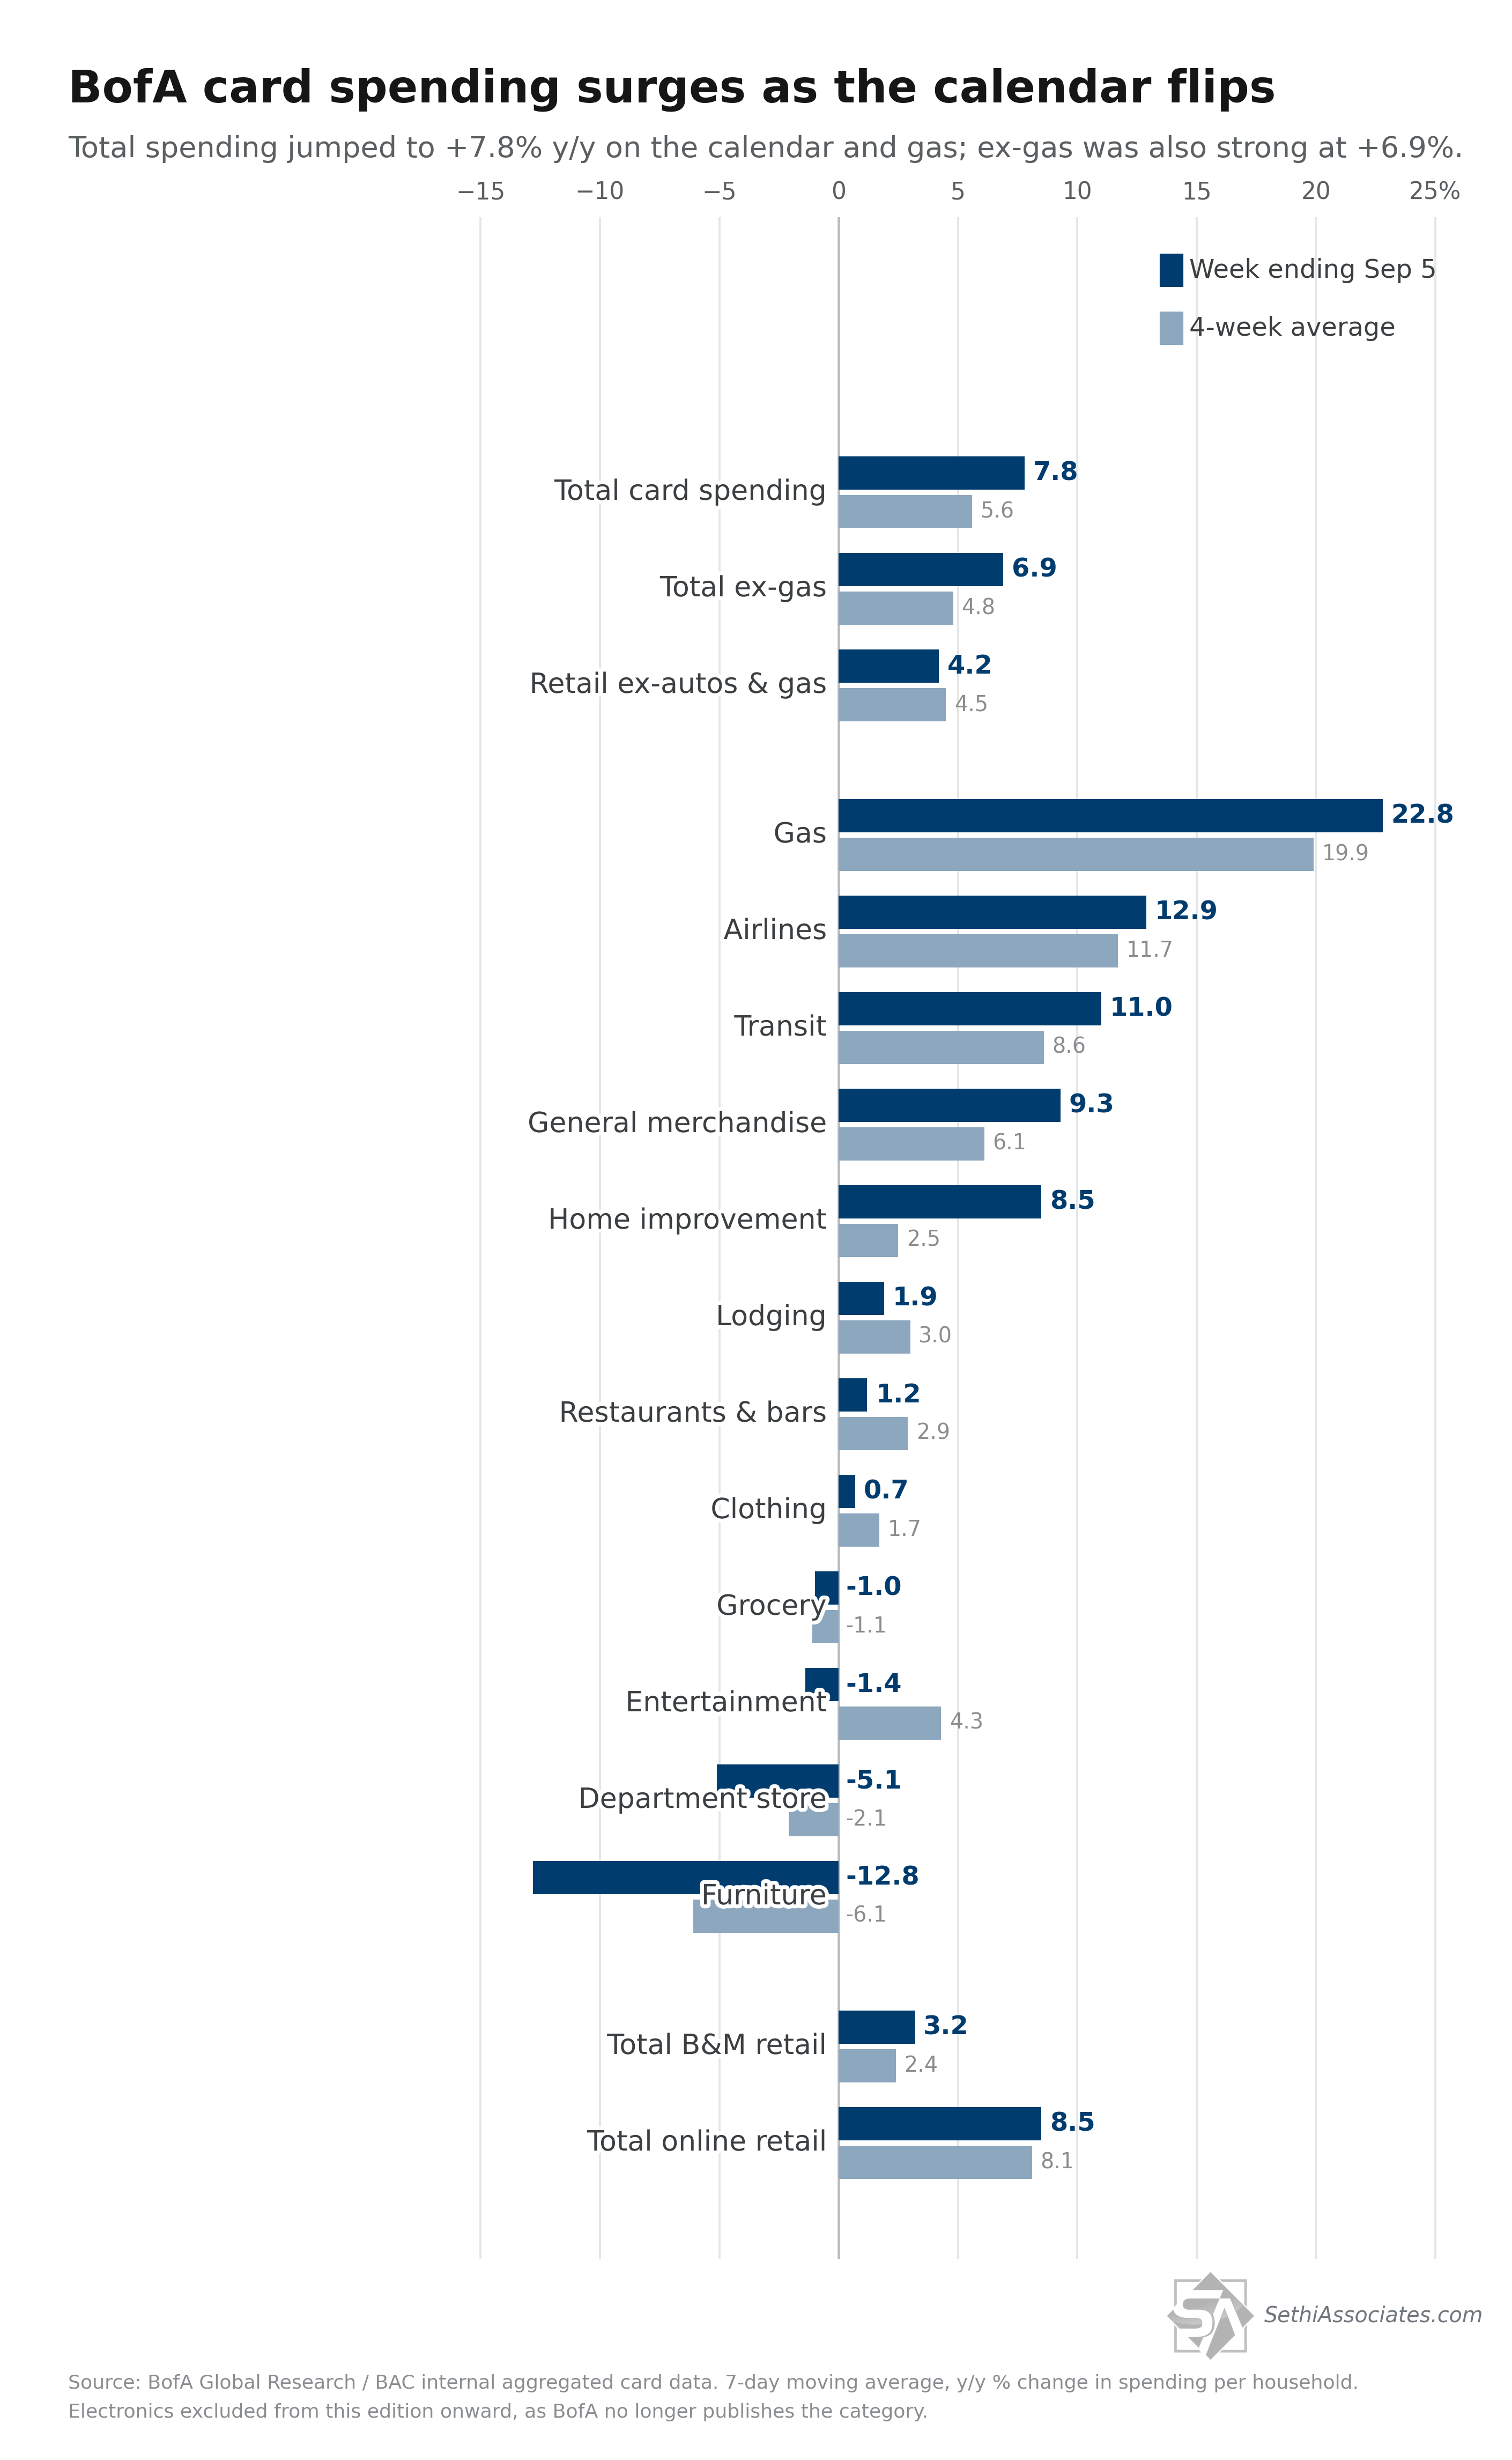
BofA card spending (credit+debit) jumped versus the year ago period in the week ending September 5th, and that is despite Labor Day falling in the August 29th – September 5th window the prior year (it was 9/1 in 2025) and outside the window this year (9/7) although curiously BofA said this week was boosted by the later Labor Day in 2026. Regardless, the results were very strong:
Total +7.8% y/y (+5.6% four-week moving average)
Ex-gasoline +6.9% (+4.8%), while
Ex-autos and gasoline +4.2% (+4.5% four-week moving average).
Gasoline climbed to +22.8% y/y (from +18.1%), its highest reading in months, as pump prices rebounded.
Importantly, though, BofA noted the strength was not solely the calendar or gas — ex-gas spending was also a very healthy +6.9%. On the income split, higher- and lower-income ex-gas growth were once again running roughly in line.
Turning to the category breakdown, a reminder that BofA has discontinued its electronics series — previously among the strongest categories — so it no longer appears here. Among the rest, the gains were led by gas (+22.8%), airlines (+12.9%) and transit (+11.0%), while general merchandise firmed to +9.3% and home improvement jumped to +8.5% from near zero. Online retail also rose to +8.5%.
The surge was far from uniform, however— and here is where the Labor Day effect was most pronounced with categories associated with large Labor Day sales seeing a big y/y drop off: Furniture was -12.8%, its deepest decline of the year and department stores fell to -5.1%. Entertainment (-1.4%) continued to soften, while lodging (+1.9%), restaurants & bars (+1.2%) and clothing (+0.7%) stayed only marginally positive.
Four categories were negative y/y: furniture (-12.8%), department stores (-5.1%), entertainment (-1.4%) and grocery (-1.0%).
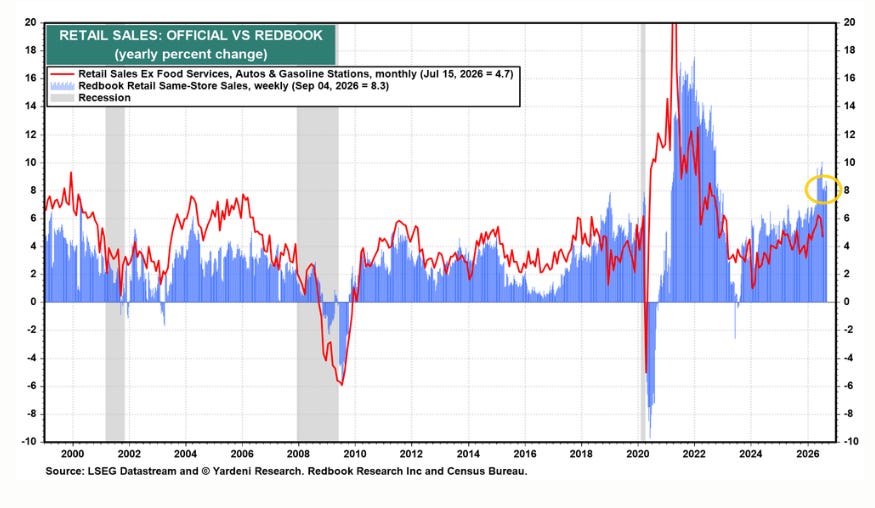
Redbook sales decelerated to 8.3% y/y growth the week of September 4th, but that also remains well above the 2025 average of 5.8% y/y.
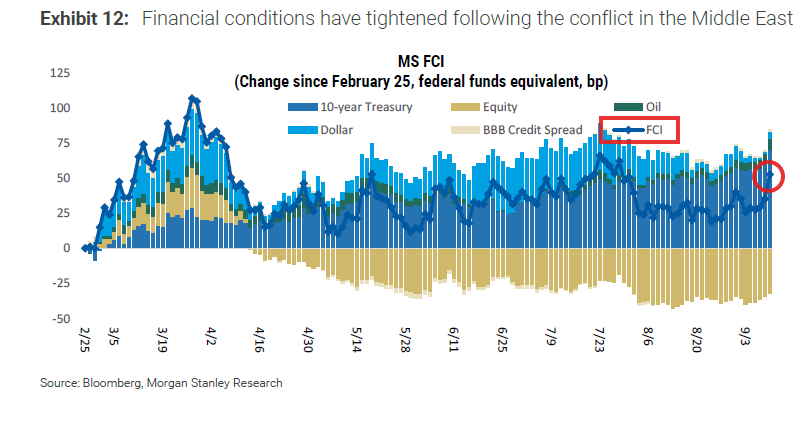
Although one headwind as MS notes is that with the continued rise in bond yields and struggling equities financial conditions have stopped easing (don’t know why they make the chart so hard to read):
As of the September 10 market close, financial conditions remained tighter than before the recent escalation in the Middle East, and no longer easier than at the time before the July FOMC meeting. Since the July FOMC meeting, financial conditions eased and reversed, now broadly unchanged.
I ran out of time this week but a deeper dive into AI’s impact on the economy next week.
Earnings Expectations Remain Very Solid
As mentioned two weeks ago, with 97% of SPX components having reported by earnings weight, we were able to pretty much put a bow on results (there may be very minor changes in some of the numbers) allowing us to turn our attention to the rest of 2026 and into 2027. For a breakdown on Q2 see the August 31st Week Ahead.
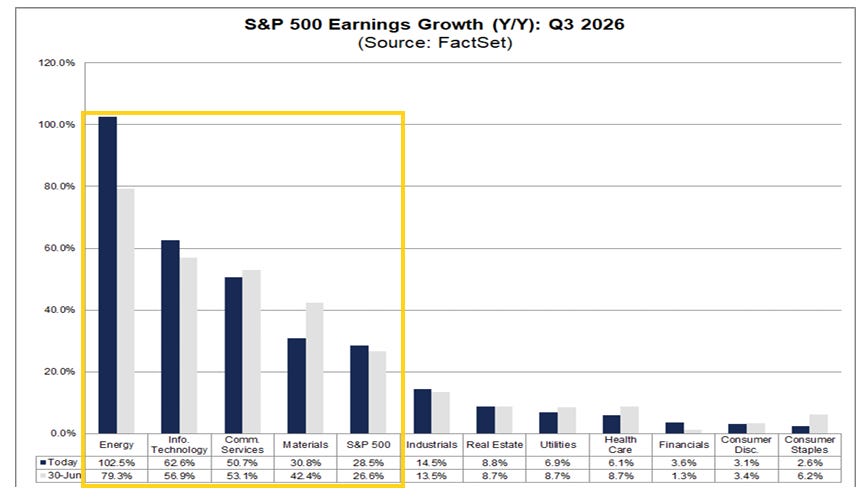
Looking at Q3, at this point analysts are still expecting a third consecutive quarter of 25%+ y/y earnings growth with the Q3 estimate at +28.7% (+0.2% w/w). As in Q2, Energy is expected to lead at +105.7% y/y growth (up from +79.3% at the start of the quarter (July 1st)), followed by Tech +63.0%, Comm Services +50.8%, and Materials +30.9%.
Unlike Q2 no sector is expected to have negative y/y growth with Staples the least at +2.5% (down from +6.2% at the start of the quarter).
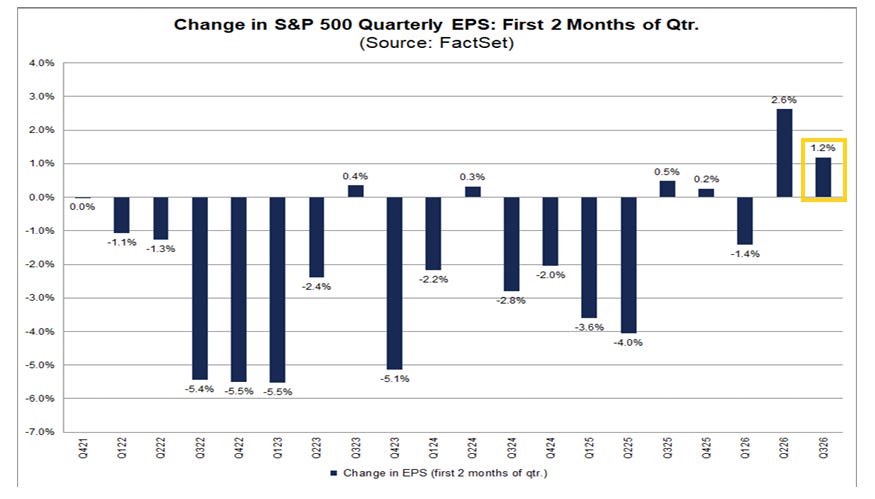
Factset noted last week that earnings expectations for Q3 have risen 1.2% since the start of the quarter (July 1st). That’s now 1.4%. While not as large as we saw for Q2, (+2.6%), it is otherwise the most in over five years and compares to a 5-year average of -1.7% and 10-year average of -1.2%.
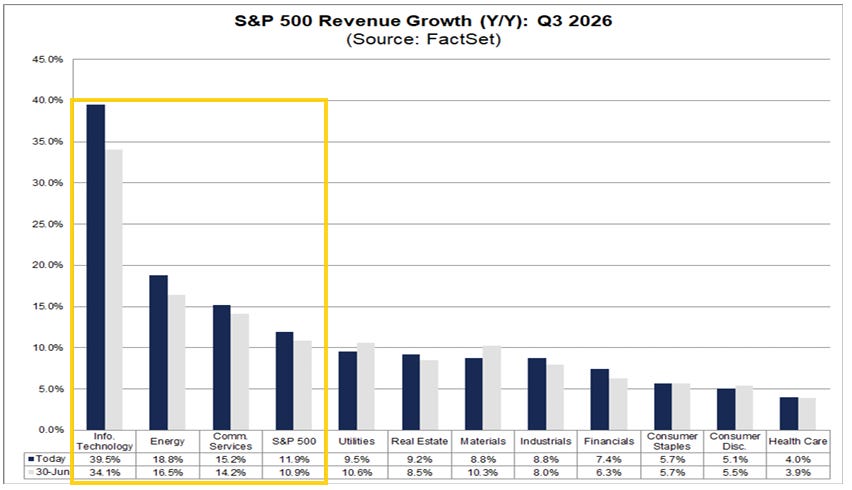
Q3 revenue growth is expected at a likewise stellar +11.9%, down from +15.5% in Q2, which though was the best since Q4 2021 (16.1%). It would mark the third consecutive quarter of double-digit revenue growth for the index.
Expectations are led by Tech (+39.5%, +1.8% w/w), Energy (+18.8%), and Communications (+15.2%).
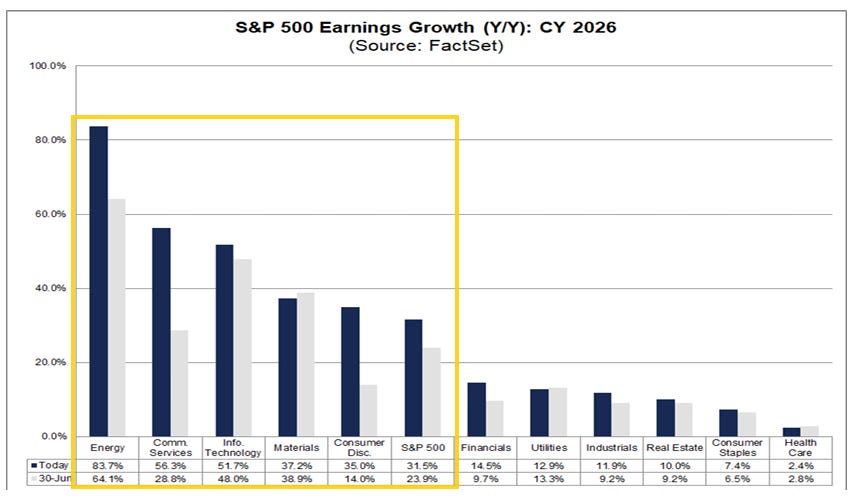
2026 SPX earnings growth expectations also continue to march higher now at +31.6% (+0.1% w/w), up from +25.4% on June 30th, +17.1% on March 31st, and over double the +14.8% at the start of the year.
As in 2025, Tech is a leader with y/y earnings growth of +51.7% (up from +28.6% at the start of the year) but Energy will exceed that (on a percentage basis) at +85.9% (up from +6.4% at the start of the year) along with Communications +56.5%. Those sectors along with Materials (+37.1%) and Consumer Discretionary (+35.4%) represent the five sectors expected to come in above the SPX average.
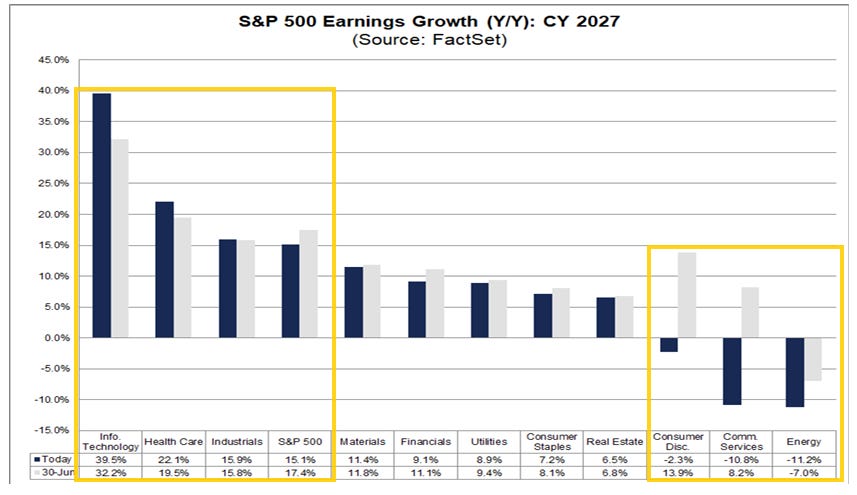
And 2027 earnings are expected to be up another +15.1% (+0.1% w/w) on top of the elevated 2026 results, which is down though from +17.4% as of June 30th as analysts are not carrying over all (but still most of) the boosts in 2026 earnings to next year. That’s also down from +16.5% at the start of the second quarter (Apr 1st). Still it’s a double digit advance on top of what is expected to be a 30%+ gain in 2026. That would also represent a fourth straight year of double-digit earnings growth for the S&P 500, something we’ve rarely seen.
2027 is expected to be led again by Tech (+39.5%, +0.3% w/w, up from 24.6% at the start of the second quarter (April 1st) despite the huge increase in 2026 estimates) followed by Health Care (+22.1%) which is expected to see a big turnaround after lagging in 2026. Industrials (+15.9%) is also above the SPX average.
With hyperscaler investment gains (in Anthropic, OpenAI, etc.) expected to slow, the sectors that have seen the biggest boosts from that are now expected to see negative y/y growth (Comm Services (-10.8% from +8.2% at the start of the third quarter) and Consumer Discretionary (-2.3% from +13.9%)) along with Energy (-11.2%).
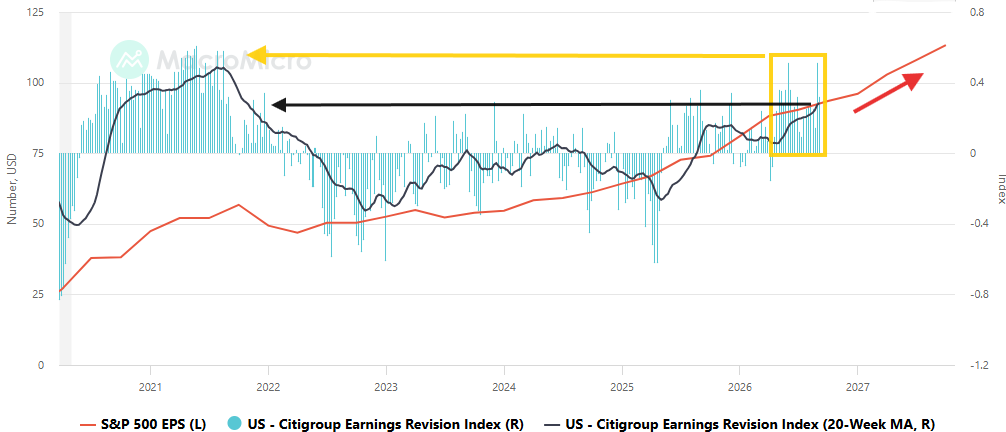
And earnings expectations continue to be supported by very strong earnings revisions which in the week of September 4th eased off from the joint highest (with May 29th) since August 2021 hit in the previous week but remaining elevated. That continues a now 20-week streak of positive revisions, something we also haven’t seen since late 2021 into early 2022.
As a result, the 20-week moving average (black line) lifted to the best since October 2021, as 12-month out EPS estimates (red line) continue to rise to new highs, as they’ve done each week since the turn of the year.
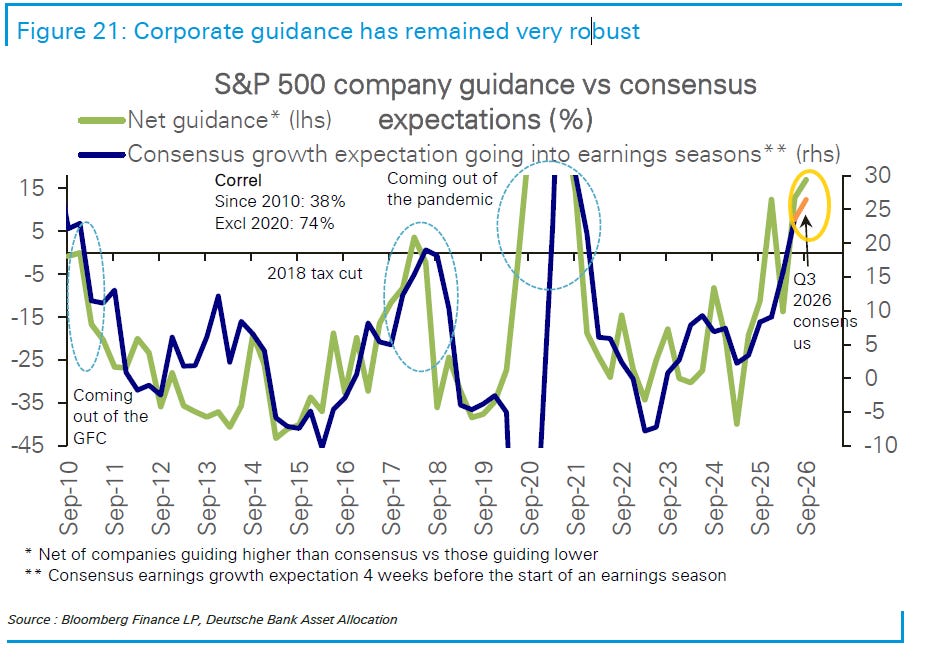
And DB also sees corporate guidance as “very robust”.
And here is Ed Yardeni from this weekend touching on these topics (note though his dubious view of longer term earnings expectations):
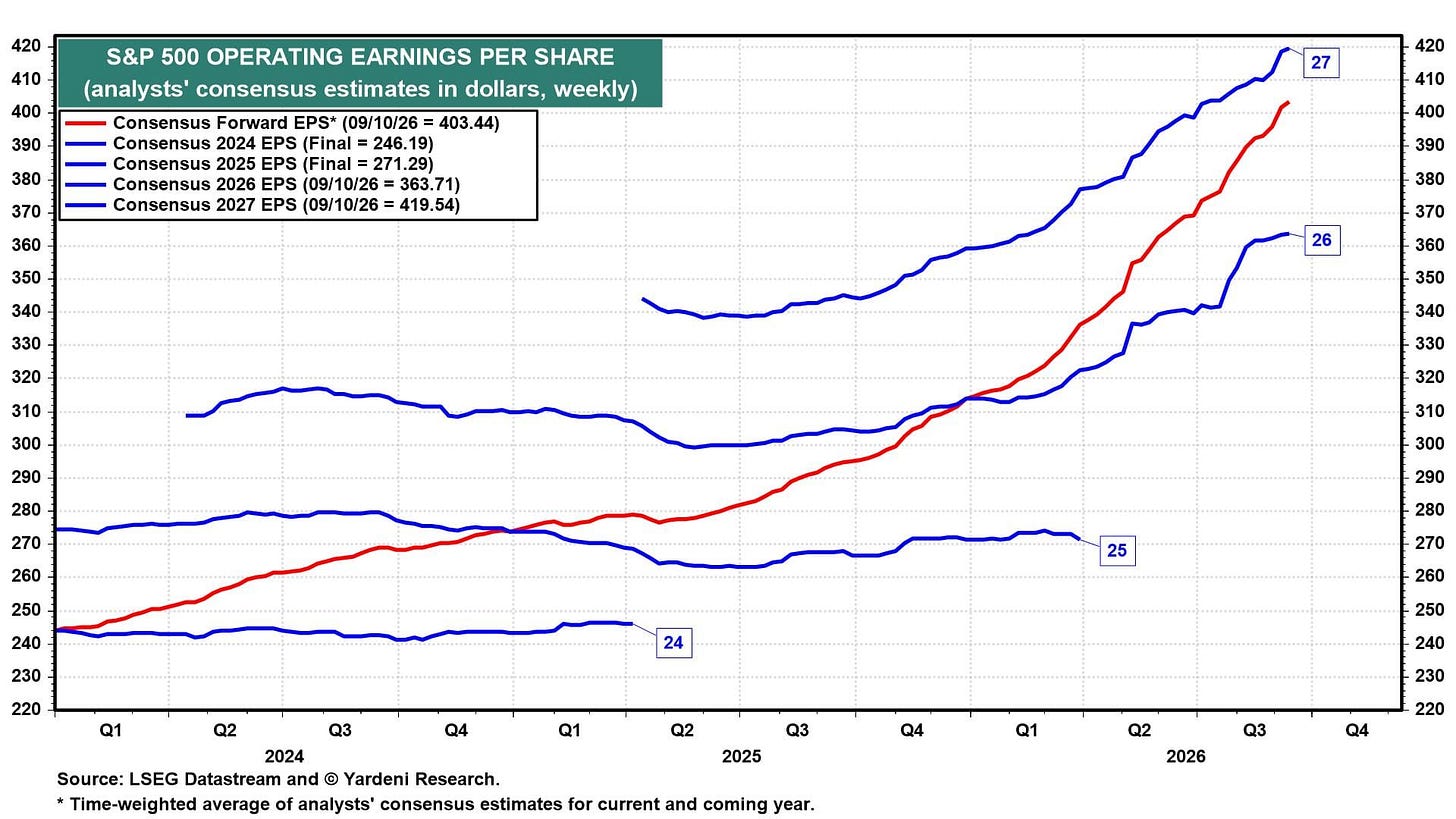
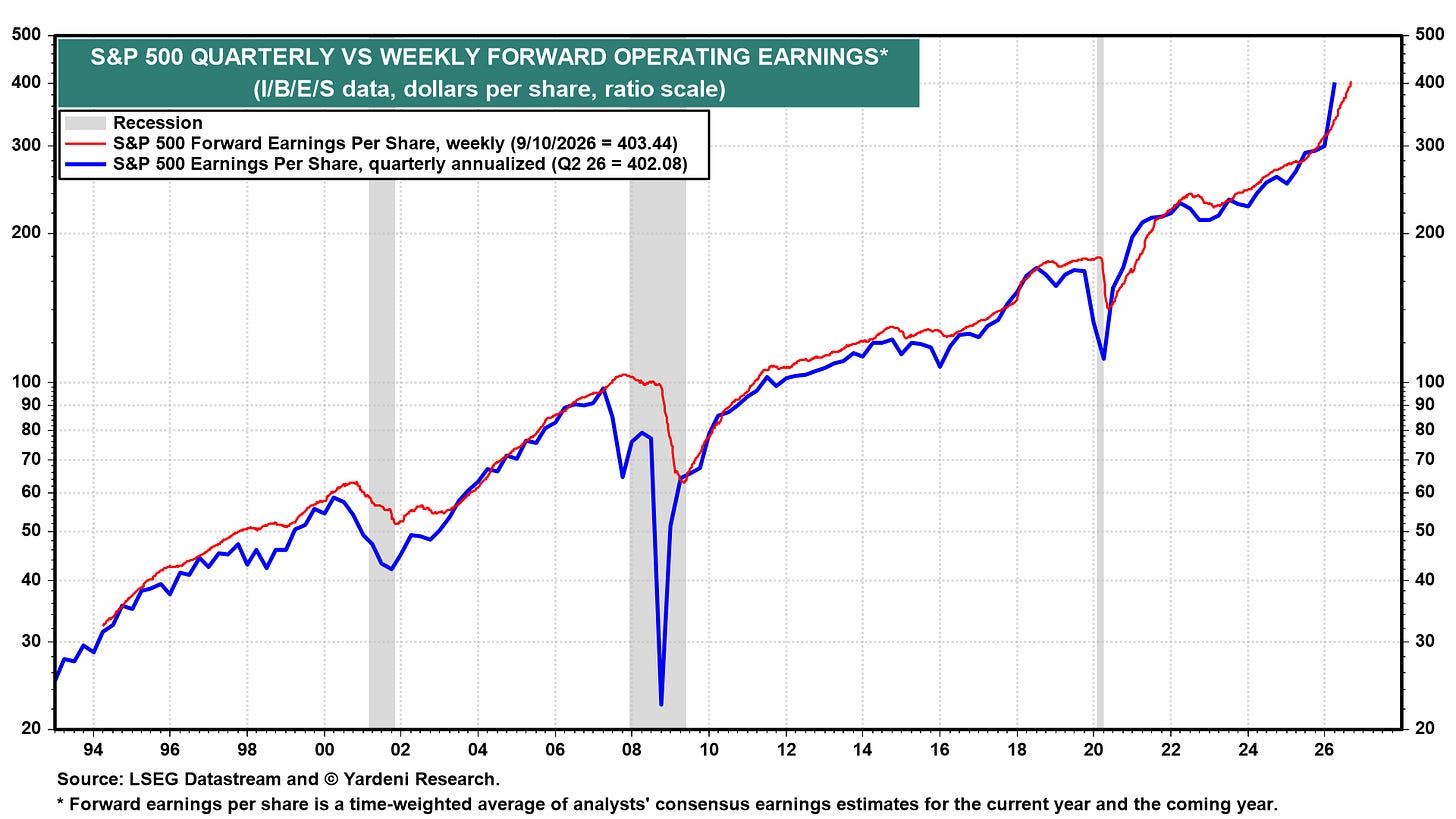
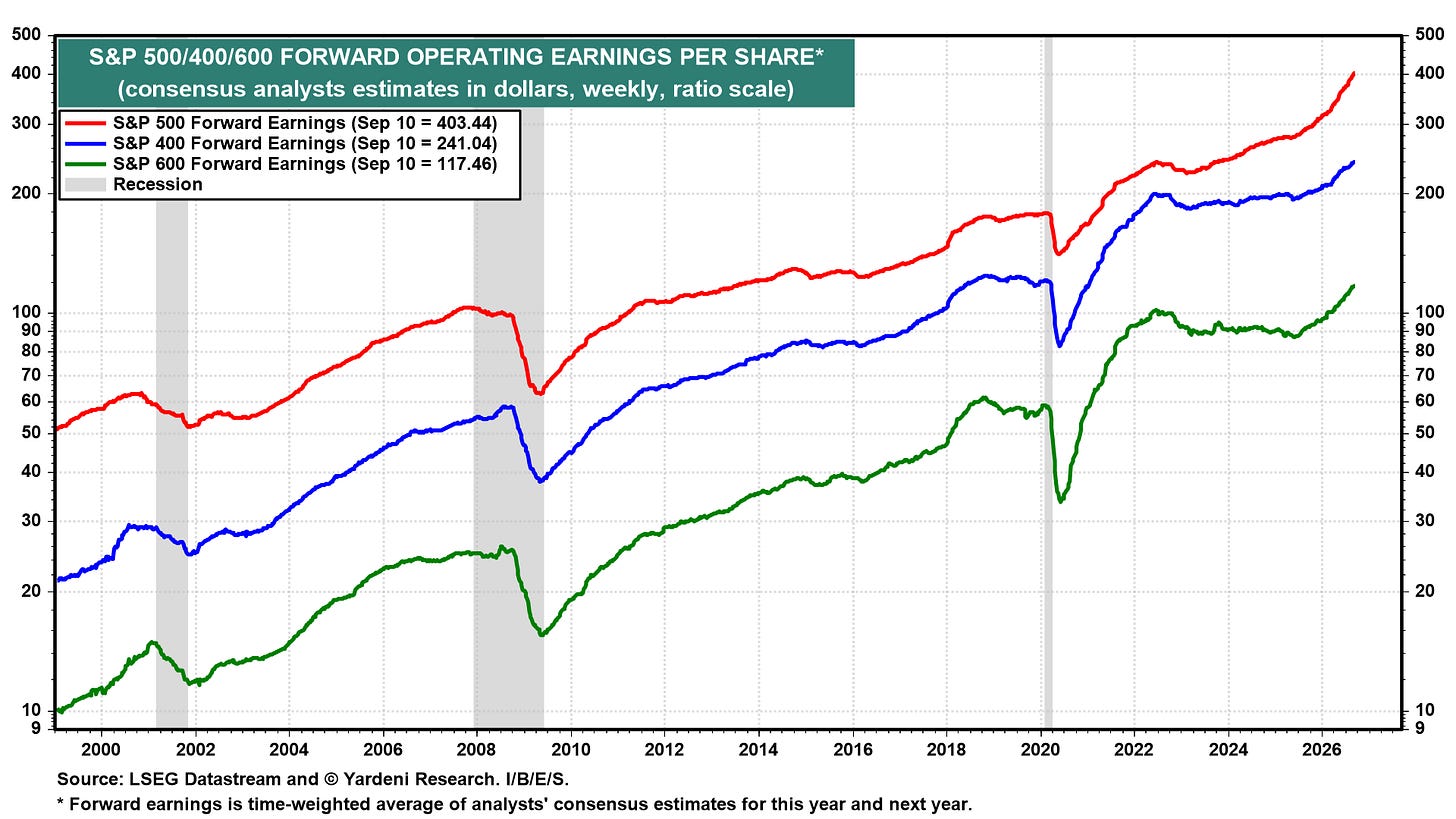
FEMO (Fabulous Earnings Momentum) continues to support stock prices despite the latest troubling developments. The S&P 500 forward earnings has risen to a record $403.44 per share (chart). By definition, it is approaching the analysts’ consensus 2027 EPS estimate and will converge with that estimate by year-end. The consensus has risen to $419.54, and we think it could rise further to $425 by year-end. By the way, the 2027 estimate is not distorted by mark-to-market (MTM) capital gains, as is the 2026 estimate.
S&P 500 forward earnings has been rising at a faster pace in recent weeks (chart). This suggests that the underlying trend in actual earnings (excluding the recent MTM gains) remains very strongly to the upside.
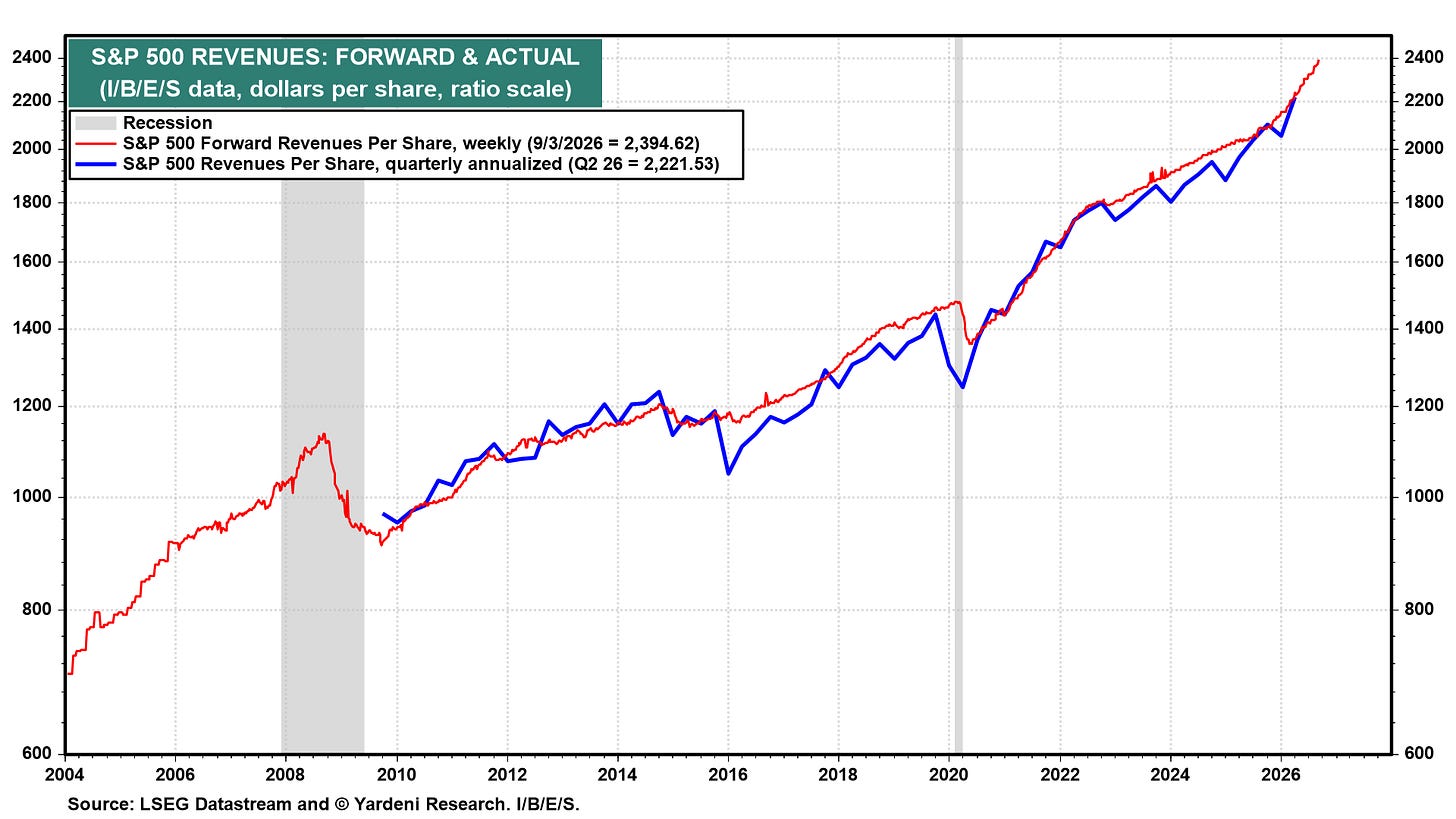
FEMO can be explained by the surprisingly strong pace of S&P 500 revenue growth (chart). It has accelerated this year, notwithstanding rising oil prices and bond yields.
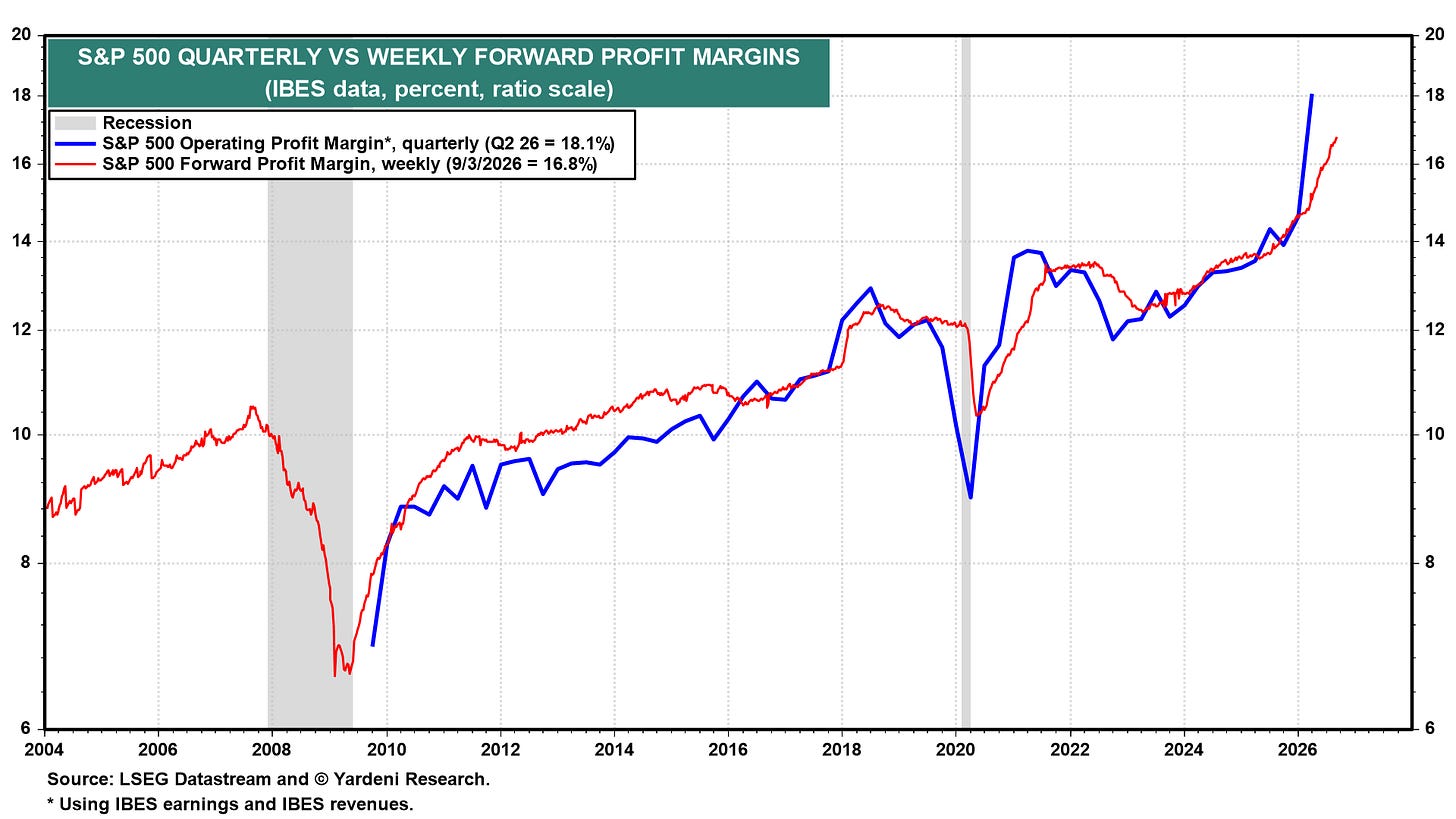
FEMO has also gotten a big boost from a spike in the S&P 500 profit margin (chart). The S&P 500 forward profit margin rose to a record-high 16.8% in early September, confirming that the trend is solidly to the upside even excluding the MTM distortion during the first two quarters of this year.
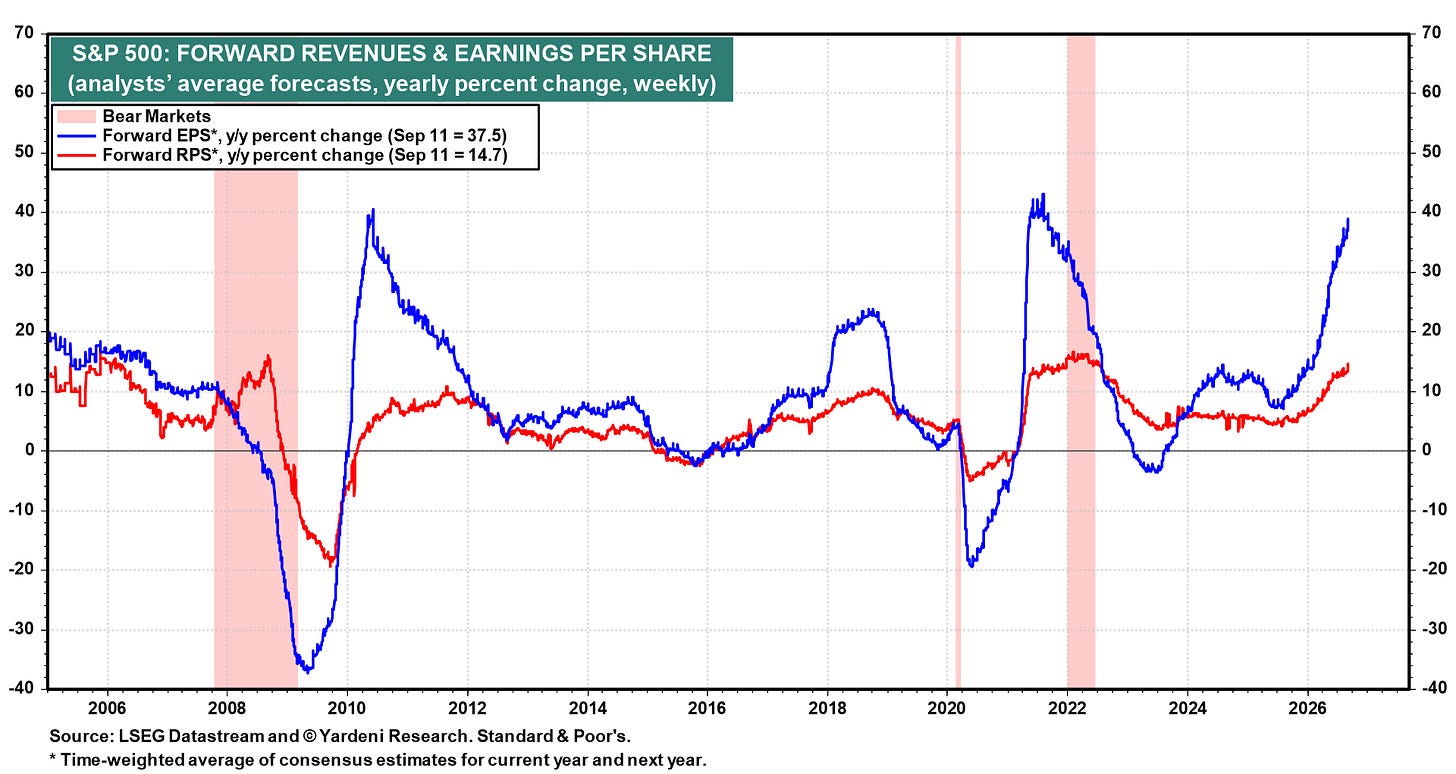
On a y/y basis, there is no sign of any slowdowns in the growth rates of either S&P 500 forward revenues or S&P 500 forward earnings (chart).
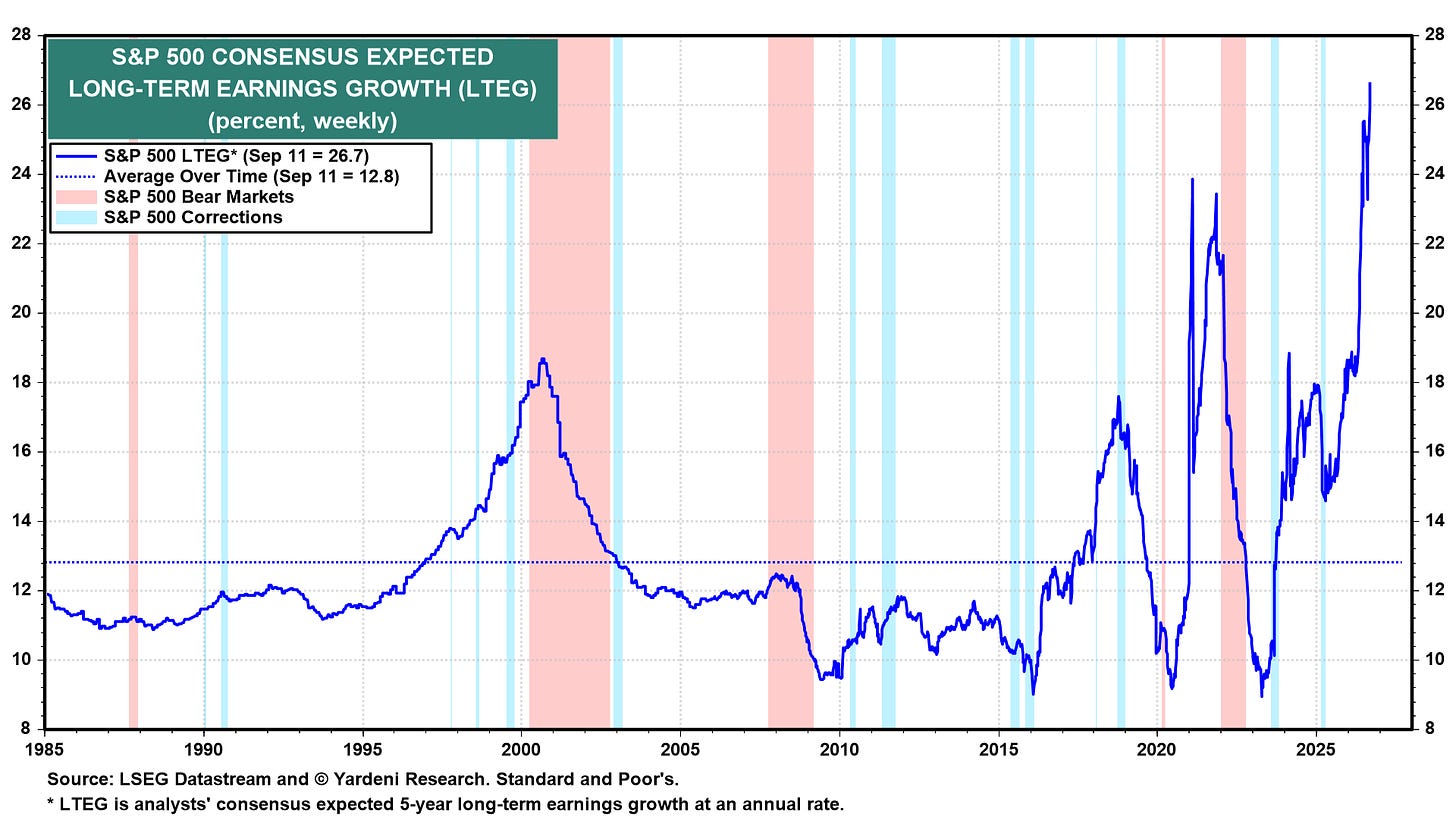
Even more remarkable is that analysts’ consensus long-term earnings growth (LTEG) expectation continues to rise to record highs (chart). Last week, LTEG rose to 26.7%. Of course, such a rate of growth would be impossible given that nominal GDP growth is well below that. However, it reflects analysts’ collective exuberance about the earnings prospects of the companies they follow.
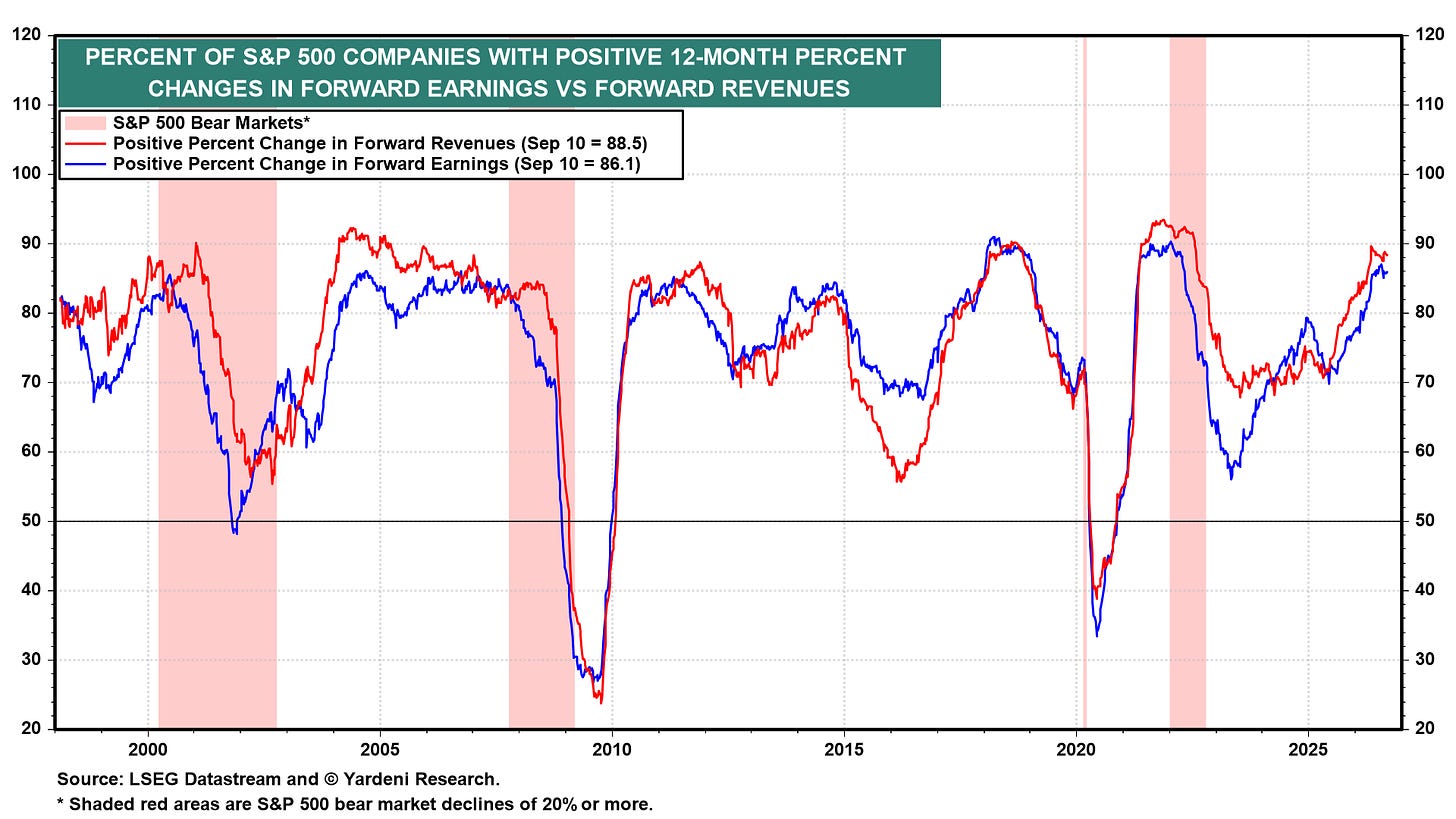
The dispersion of positive y/y percentage changes in S&P 500 forward revenues and forward earnings remains very high (chart).
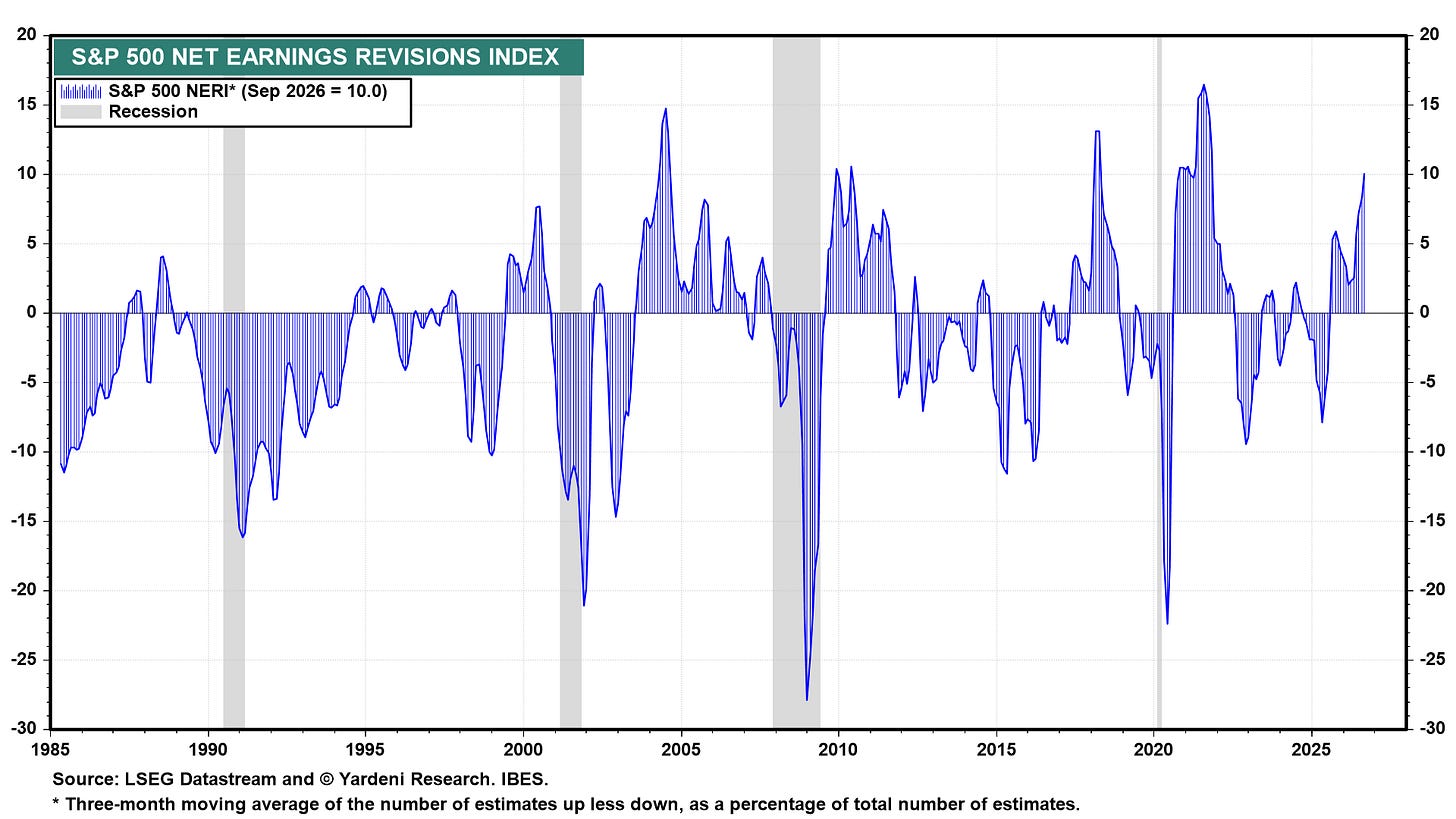
The S&P 500 Net Earnings Revisions Index also rose to a cyclical high in September (chart).
The forward earnings of the S&P 500, S&P 400, and S&P 600 all rose to record highs last week (chart).
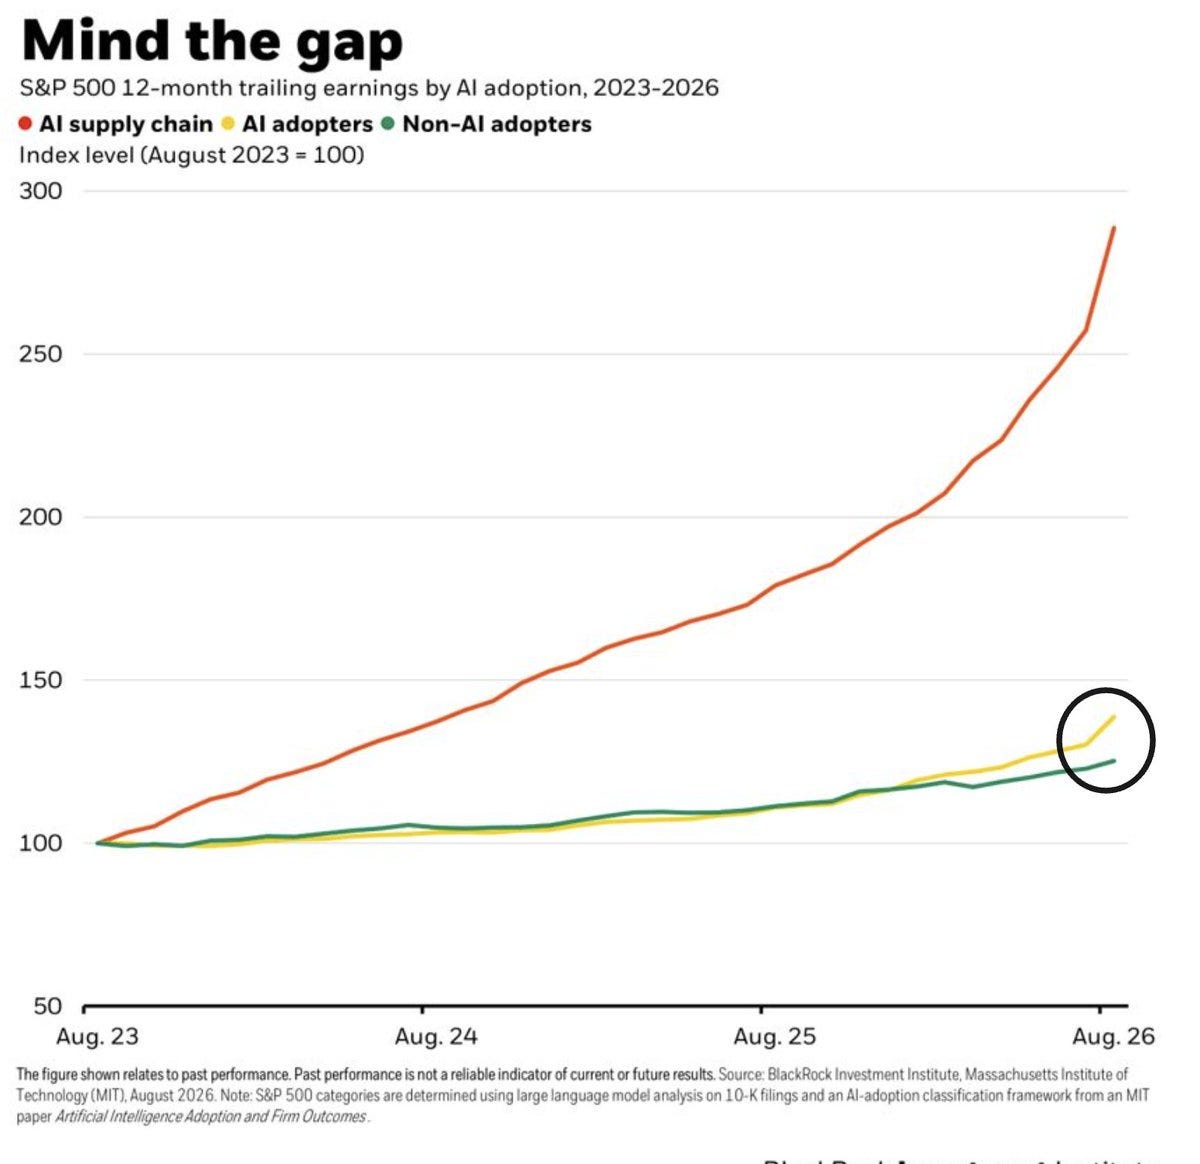
While Blackrock’s Wei Li notes that earnings growth for AI adopters is starting to separate from non-adopters:
“The supply chain remains in a league of its own. But more recently, earnings at S&P 500 companies adopting AI have begun to pull away from non-adopters (chart). Commoditization risk doesn’t equal destruction of economics. It means a potential transfer of rents.”
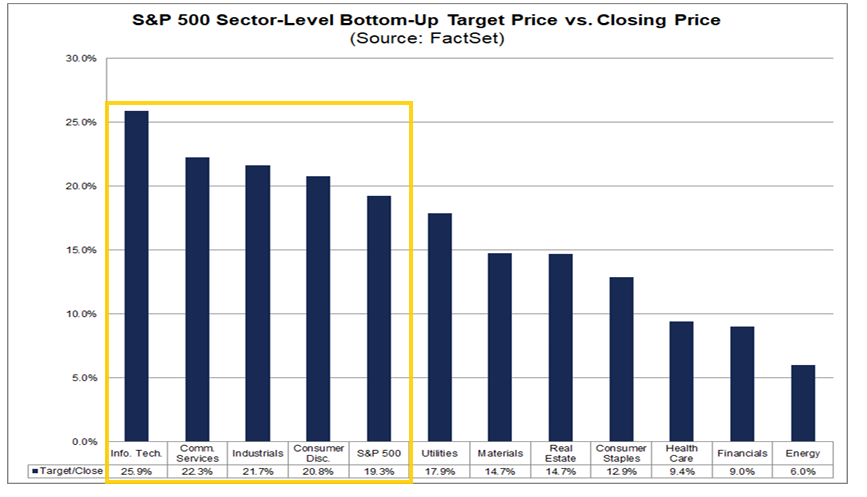
Analysts also collectively continue to think that the S&P 500 has a lot of upsidewith FactSet’s compilation of analyst bottom-up SPX 12-month price targets up to 9,251 (+10pts w/w, ~955 pts since March 31st, ~+2,130 pts since Thanksgiving, and ~+3,080 pts since July 1, 2025). That would be +21.9% from Thursday’s close.
Tech (+27.5%, up from +25.9% the prior week) remains the sector seen with the biggest upside, followed by Consumer Discretionary (+24.9%), Industrials (+24.6%), and Communications (+23.9%). On the other side Energy (+5.9%) remains the sector with the least upside.
As a reminder we started the year with a 12-month bottom-up price target of 8,000 and according to FactSet the last 20 yrs (through 2024) analysts have been on avg +5.9% too high from where they start the year, but they have underestimated it five of the past six years (including 2025 when they saw 6,755 at the start of the year and we ended at 6,845). Currently we’re about 5% away.
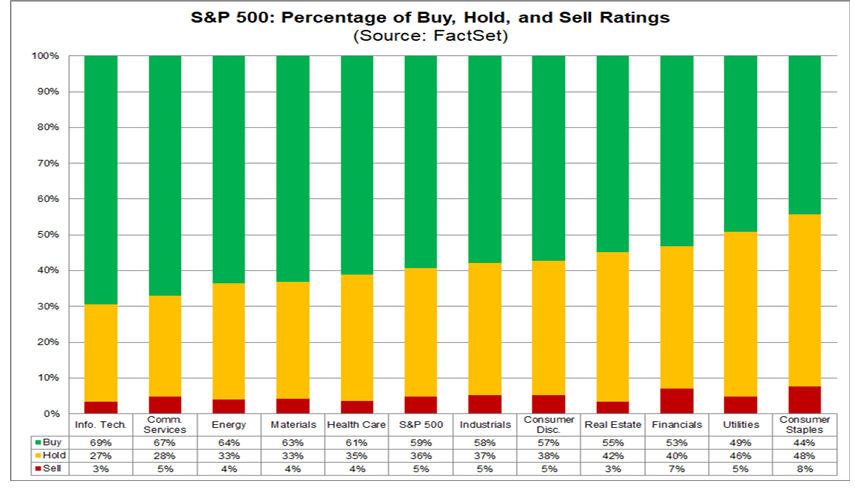
In terms of analyst ratings, buy and hold ratings continue to dominate with buy ratings at 59.2% seven tenths below the record high of 59.9% the last week of April. The 5-year month-end average though is 55.8% according to FactSet, so we’re well above that.
Hold ratings are at 35.9%, off the 35.4% record low (to 2009), but well below the 5-year month-end average of 38.7%, with sell ratings at 4.9%, remaining in their narrow range since 2009 but below the 5-year month end average of 5.6%.
Tech leads in buy ratings (69%) while Staples leads in sell ratings (8%).
These numbers have not changed much since the end of July.
Valuations Remain Relatively Attractive
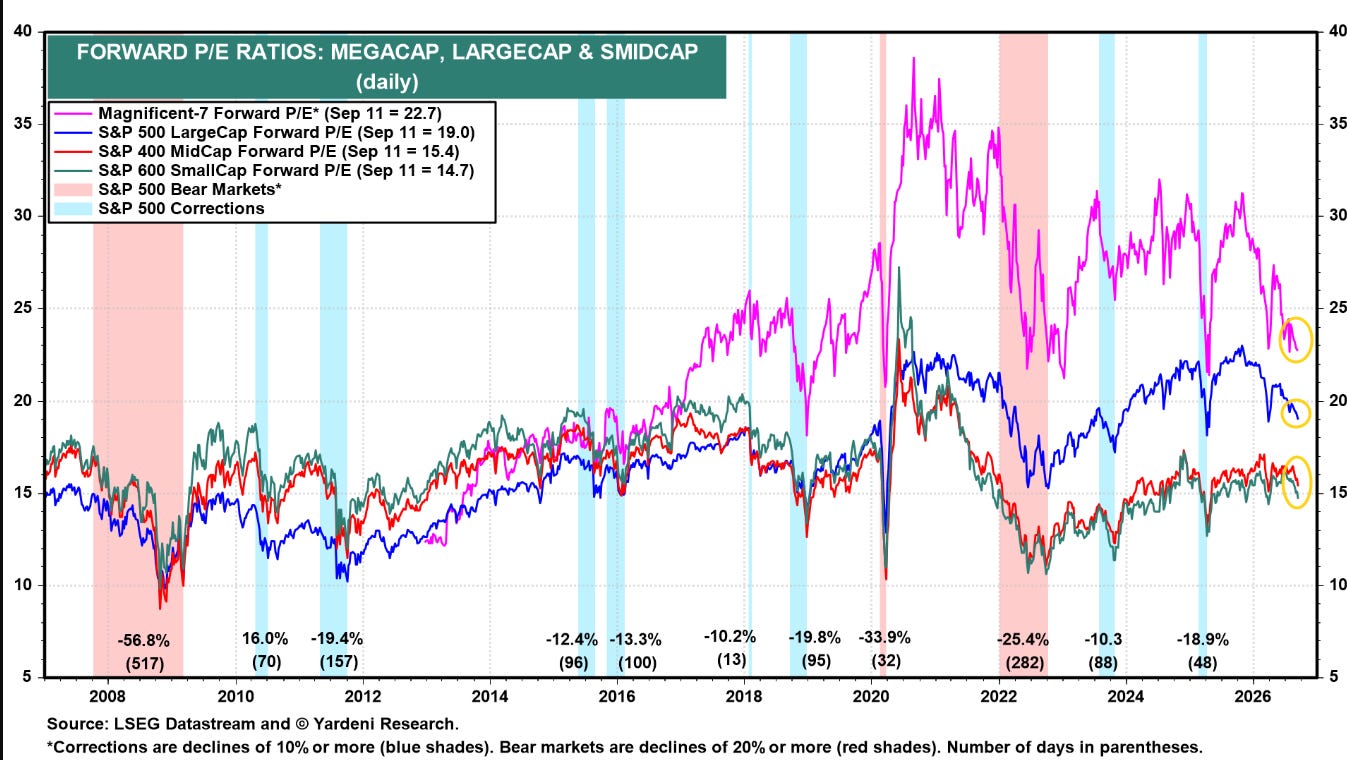
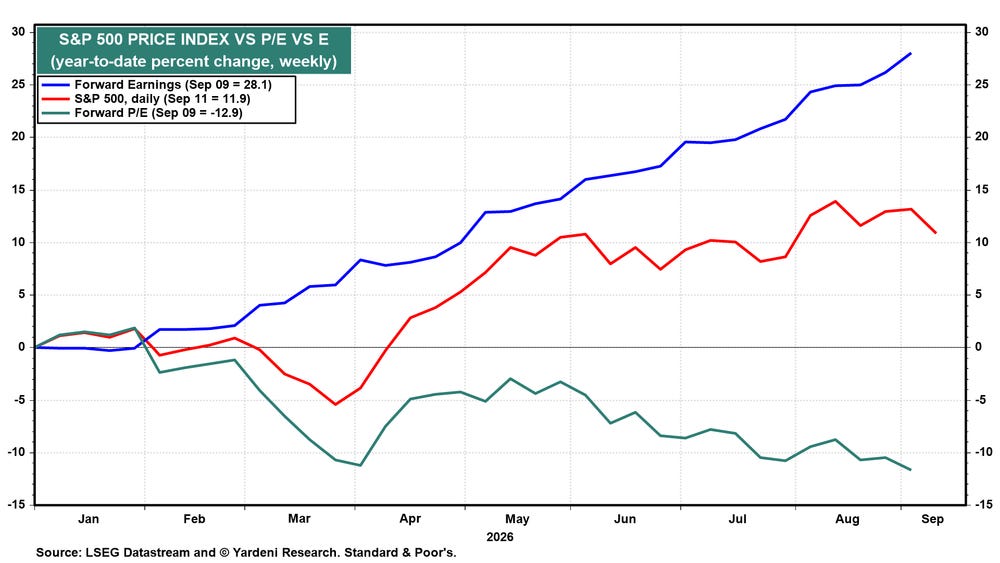
The relatively modest increase in the S&P 500 since the start of the third quarter (+2.0%) versus the huge increase in earnings expectations has seen valuations (price to next-twelve-month earnings) edge closer to the lows of the year.
Per Ed Yardeni: “Since the start of the year, the S&P 500’s forward earnings has risen 28.1%, while its forward P/E has fallen 12.9% ytd… Investors aren’t willing to pay as much for FEMO as they were in January. They may be concerned that analysts’ EPS projections reflect a fair amount of irrational exuberance, even though that exuberance has been fueled by actual EPS results!”
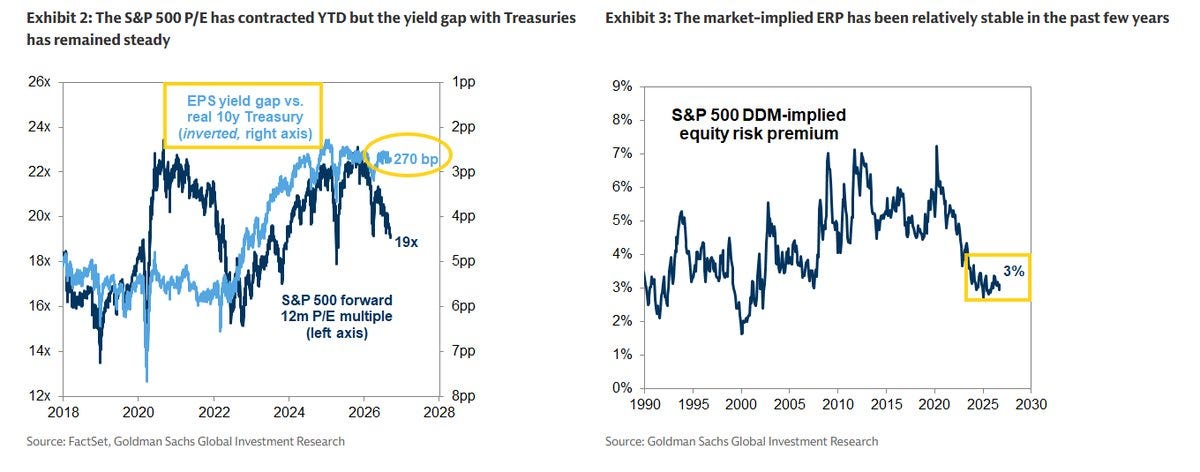
But Goldman notes that some of that softening is a function of the increase in interest rates:
Equity multiples have declined this year but valuations relative to bonds have been roughly unchanged.
The S&P 500 forward P/E has declined from 22x at the start of the year to 19x today…. The difference between the S&P 500 earnings yield (5.2%) and the real 10-year US Treasury yields (2.6%), a simple proxy for the equity risk premium, is currently 270 bp.
Outside of brief market downturns, this “yield gap” has been fairly constant during the last two years, as has the equity risk premium implied by our S&P 500 dividend discount model.
Which Ed Yardeni also addresses:
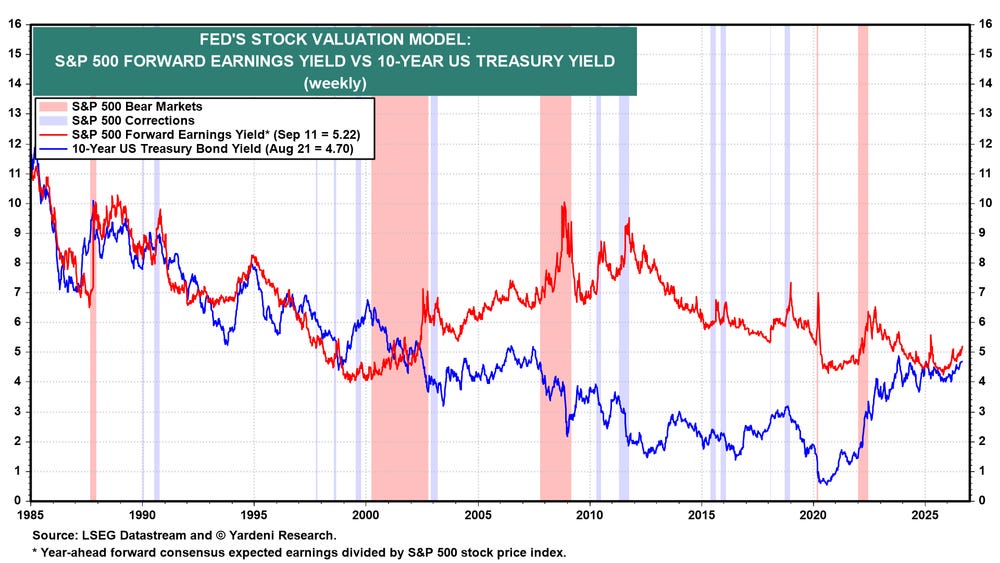
Also weighing on forward P/Es has been the rise in bond yields (chart). We are still projecting 8400 for the S&P 500 by the end of the year. That target might be hit with stronger forward earnings and a weaker forward P/E than we had expected. So we are raising our 2027 earnings estimate to $425 per share from $415 and lowering our forward P/E expectation to 19.7 from 20.2.
But Bad Breadth (I know, overused)
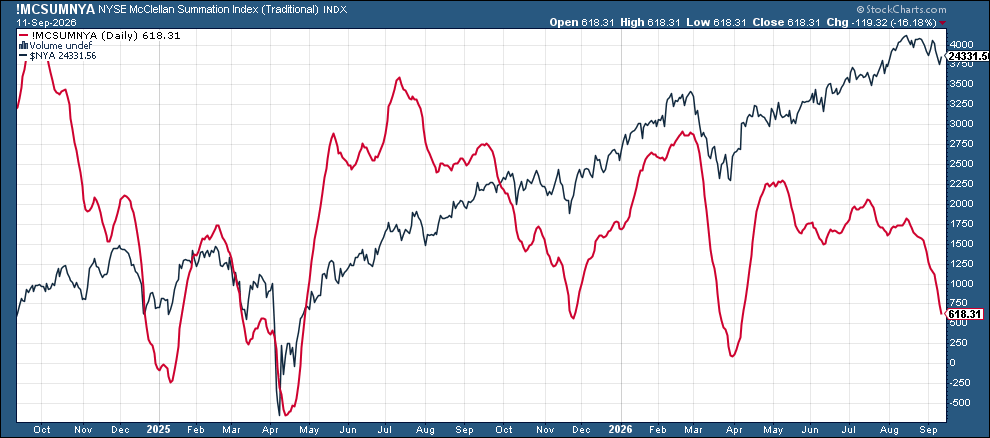
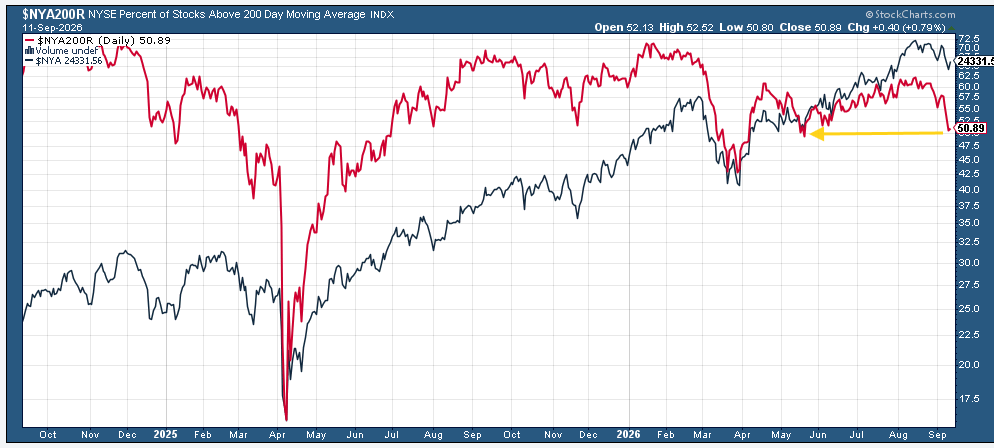
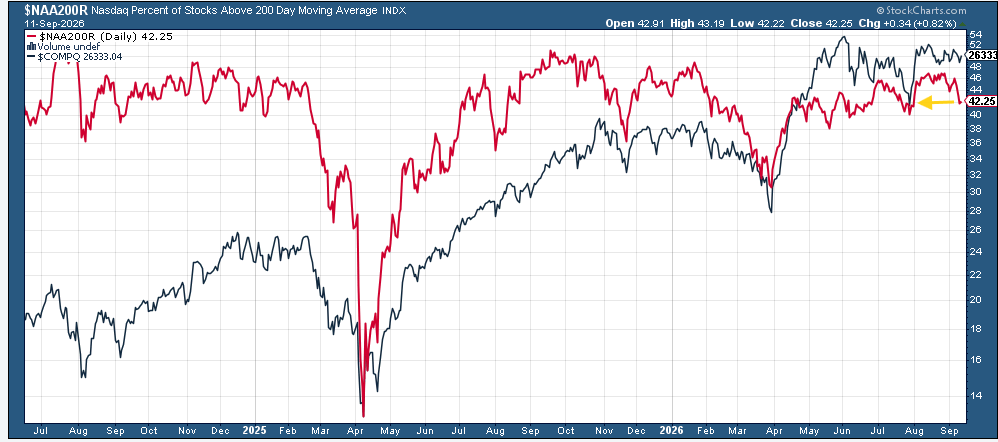
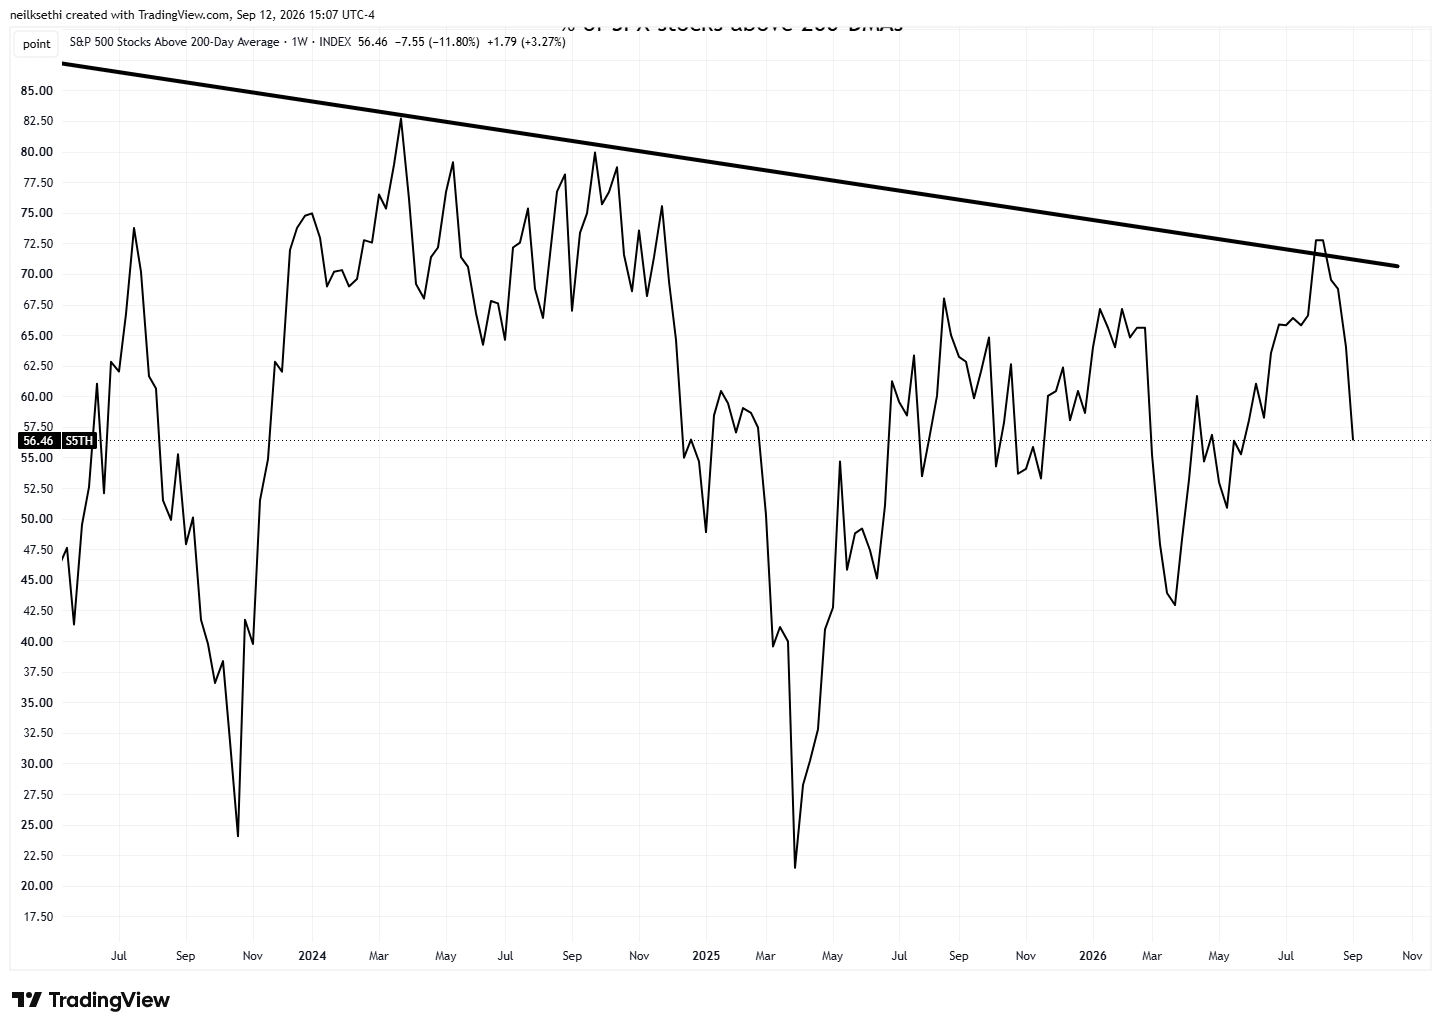
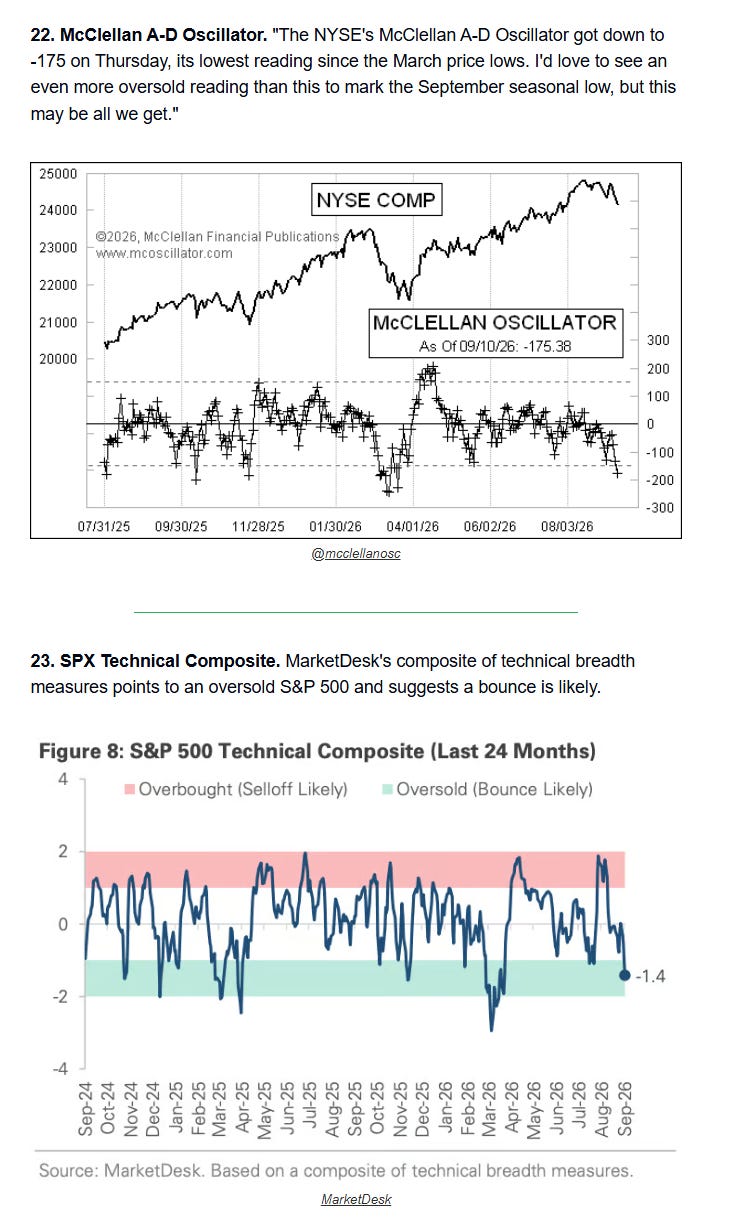
Breadth continued to deteriorate, although some metrics are getting into “oversold” levels arguing for a bounce at some point.
The McClellan Summation Index (red line, “what the average stock is doing”) continues to drop — one of those arguably calling for a bounce.
Percentage of stocks over 200-DMAs (red lines), which have held up better than other metrics, finally gave in on the NYSE, now the least since May, but the Nasdaq hasn’t broken the July low yet.
While SPX percent of components above their 200-DMAs are down to the least since June.
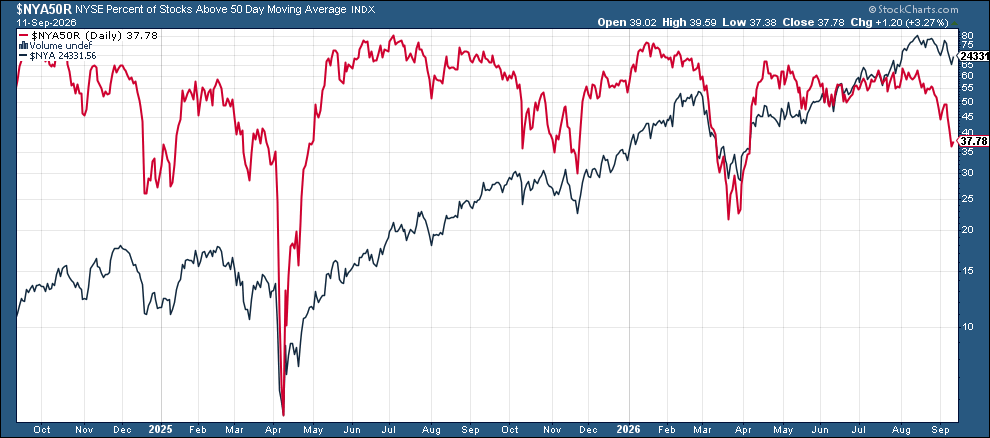
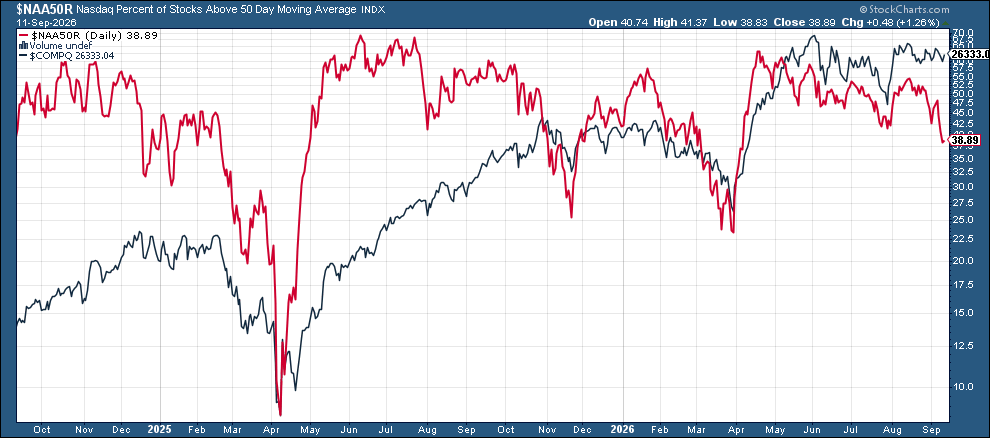
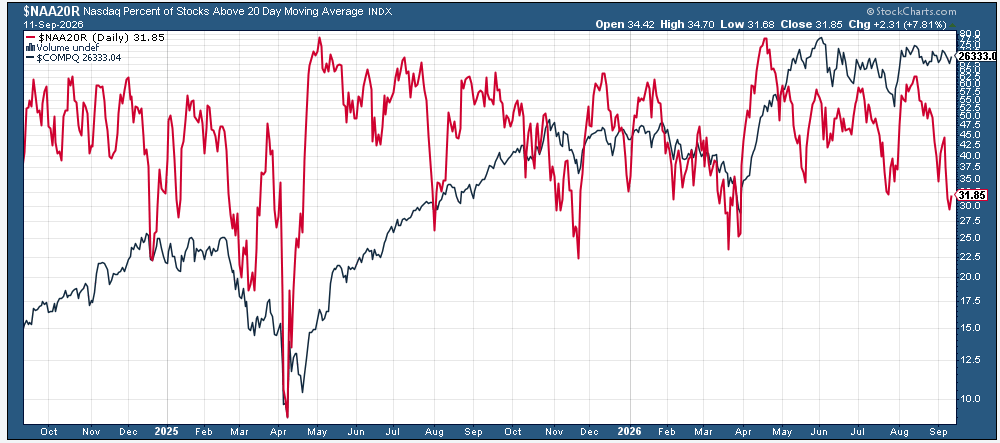
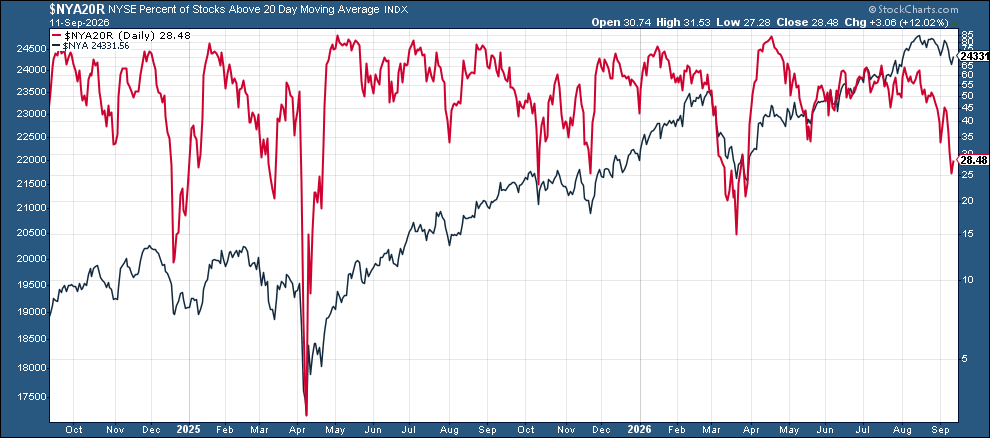
While shorter-term 50 & 20-DMAs got a little bounce Friday after falling to the least since April and March respectively, areas that would be candidates for an oversold bounce (especially the 20-DMAs).
50-DMAs
20-DMAs
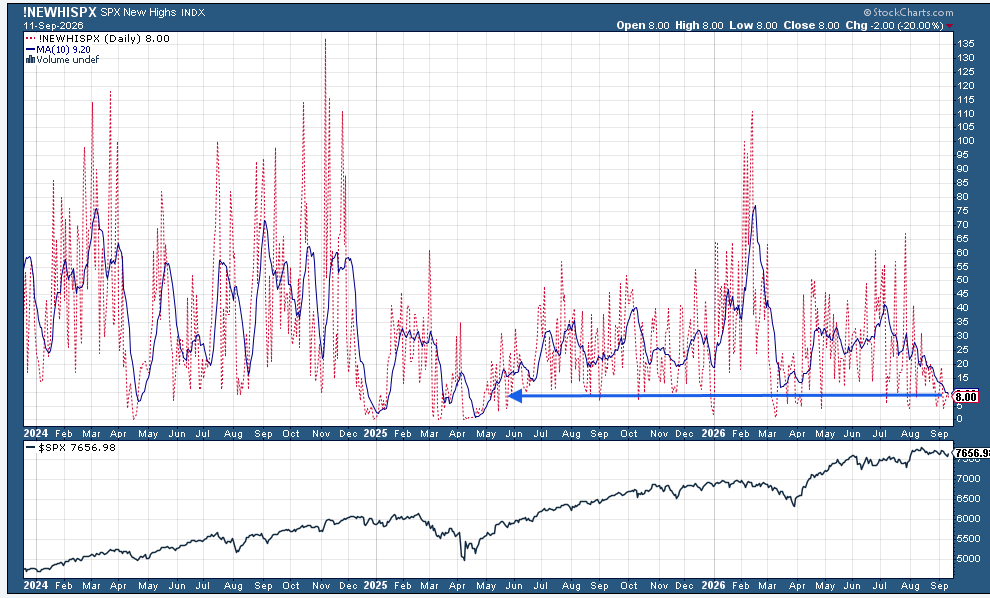
SPX new 52-week new highs minus new lows didn’t breach the 4 from the prior week but didn’t get over 10 either, while the 10-DMA (blue line) is now the least since May 2025 at just 8.
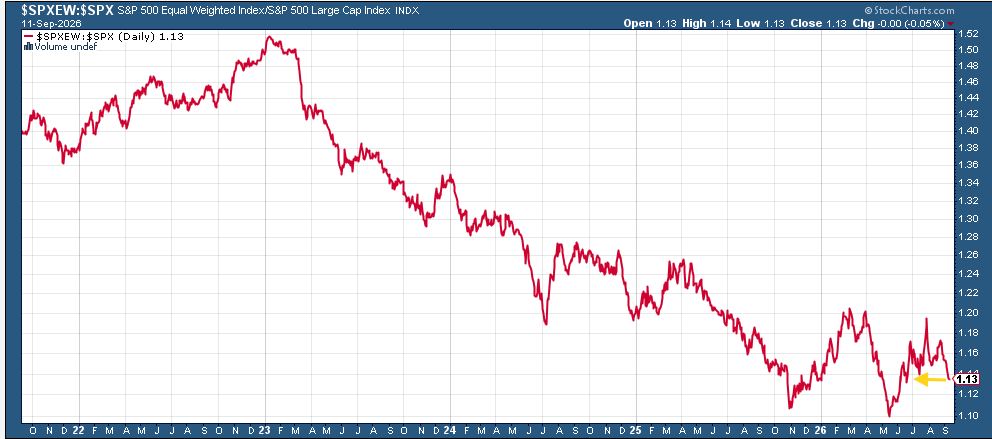
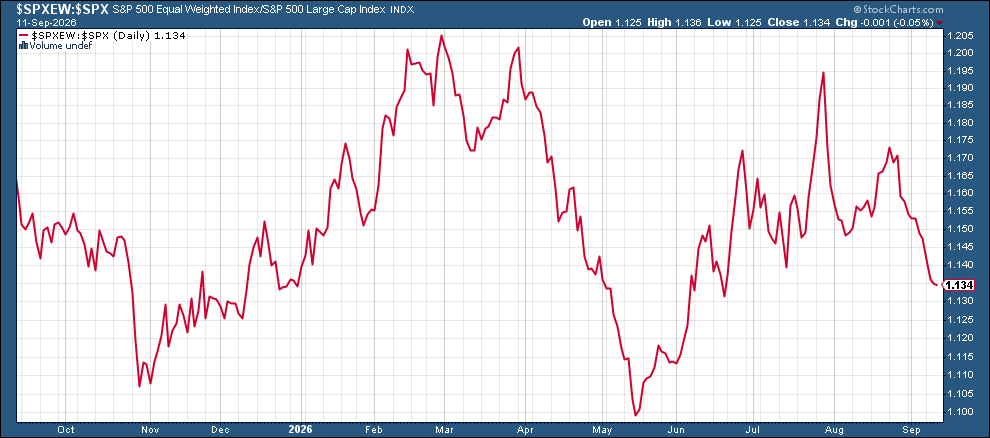
And the ratio of the equal-weight SPX to the cap-weighted is now the least since June.
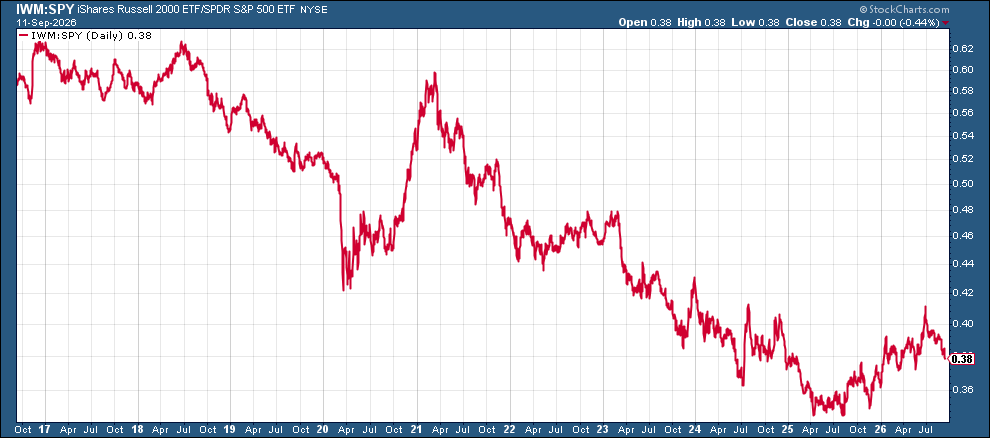
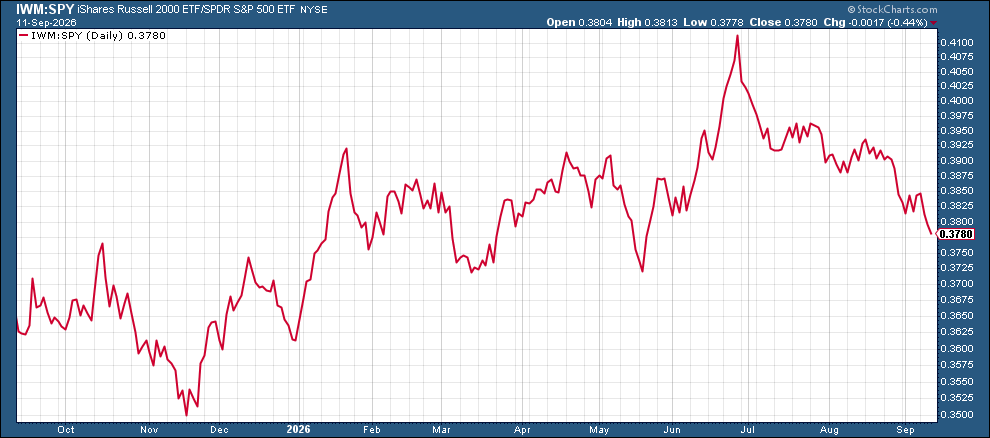
While the ratio of small caps to large caps (Russell 2000 to SPX) is the least since May.
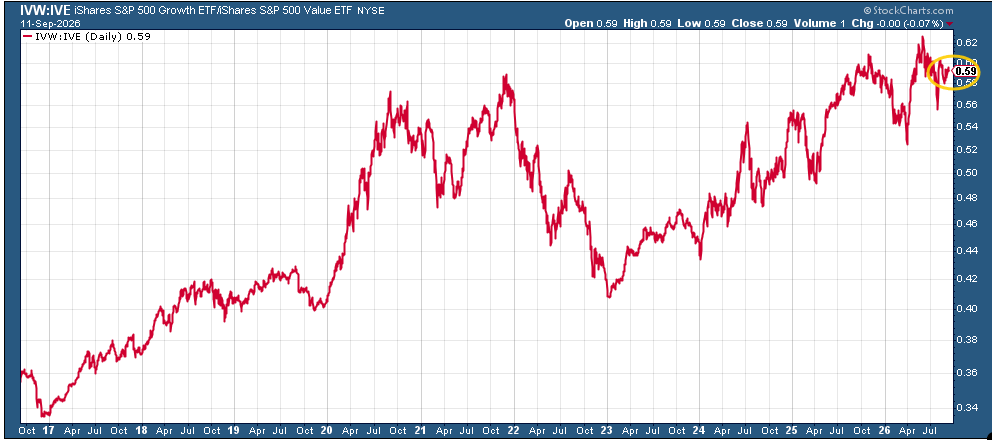
While S&P 500 growth/value remained just off its all-time high from May.
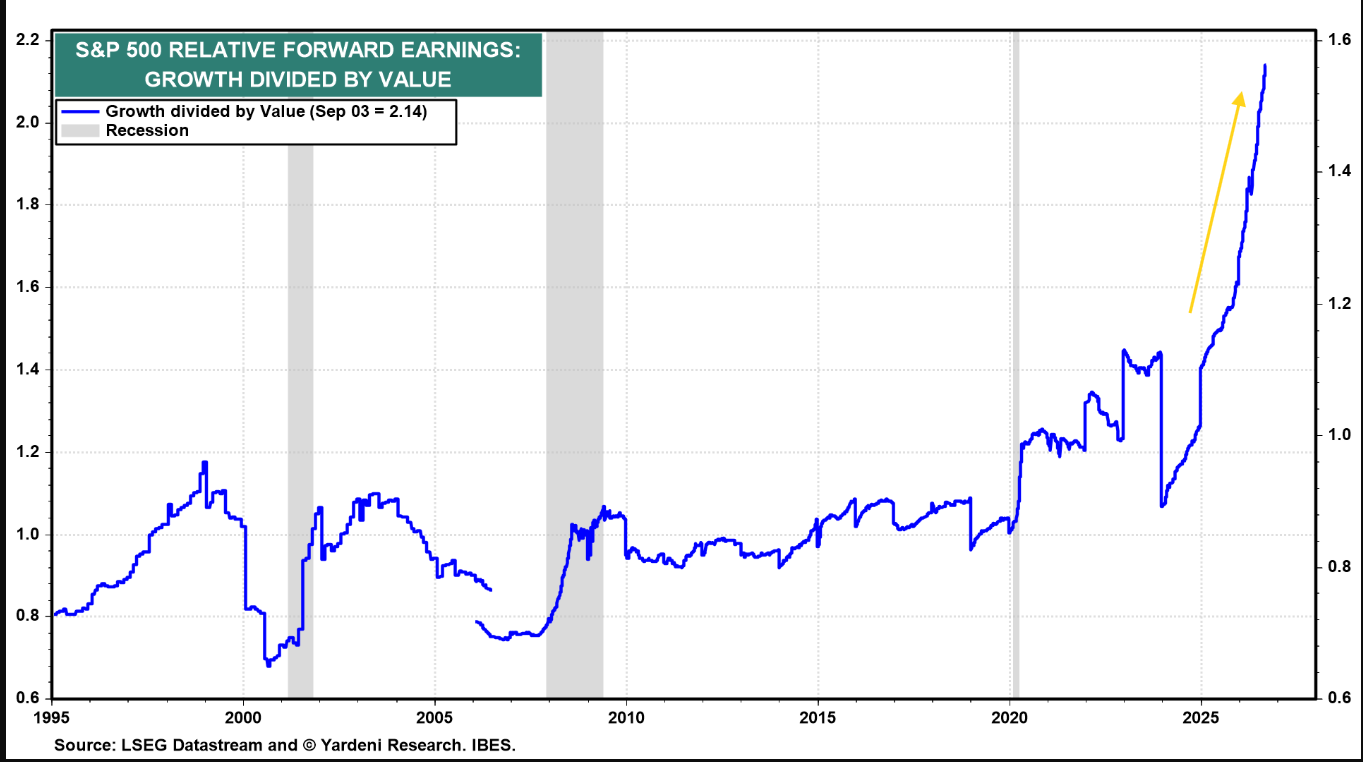
As the ratio of forward earnings for growth/value pushed to a new all-time high at 2.14. That is up from around 1.0 at the start of 2025.
And more from the Daily Chartbook on breadth approaching “washed out” levels.
And Eric Soda notes in his weekly update some metrics getting closer to levels that have seen bounces in the past, but most are not quite there.
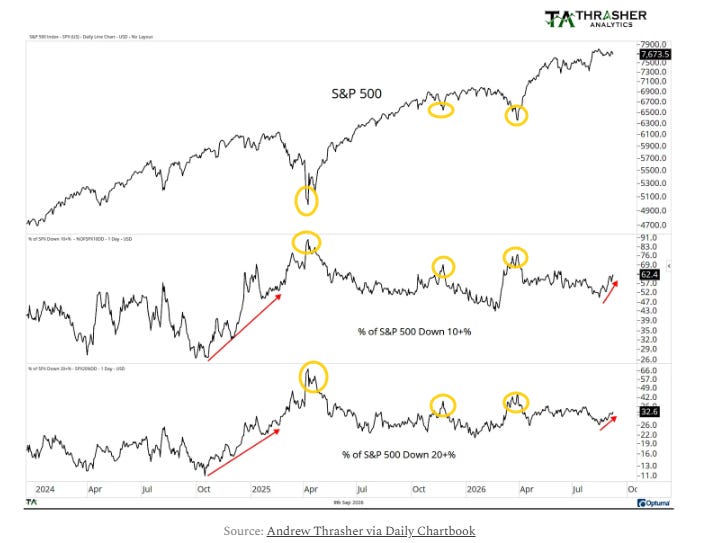
One example is the percentage of S&P 500 stocks down at least 10% from their highs, which has climbed to 62.4%, while stocks down 20% or more sit at 32.6%. The last couple of times they reached 70% and 40% respectively we’ve seen bounces (and even lower levels saw bounces in 2024).
Positioning Eases Back For First Time Since July, Systematics Now “Fragile”
Turning to equity market positioning, after having rebuilt the previous five weeks, positioning eased back last week.
Deutsche Bank:
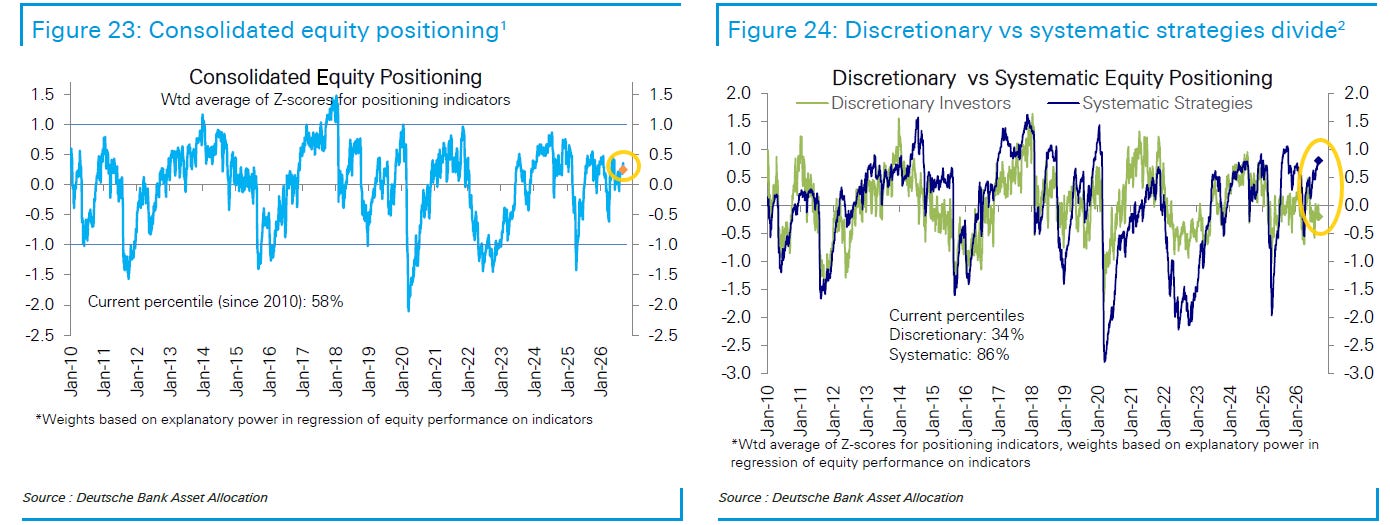
Our measure of aggregate equity positioning dipped slightly this week and remained modestly overweight (0.25sd, 58th percentile).
Discretionary investor positioning (-0.20sd, 34th percentile) declined to modestly underweight again, while systematic strategies’ positioning (0.80sd, 86th percentile) edged up to further overweight, taking it to its highest level in 11 months.
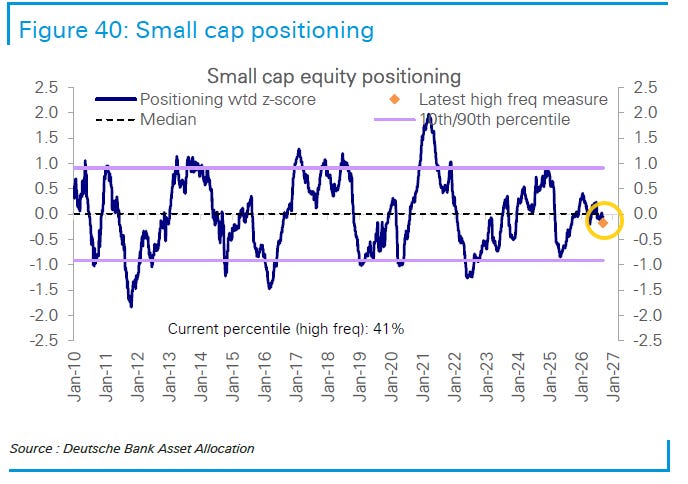
Positioning in large caps (0.53sd, 81st percentile) fell slightly from last week, while that in small caps (-0.18sd, 41st percentile) remained slightly underweight.
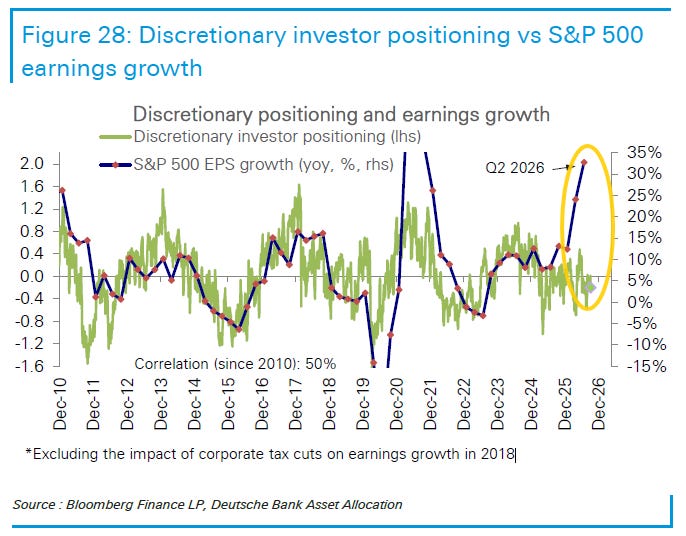
Positioning continues to trail earnings growth in their opinion.
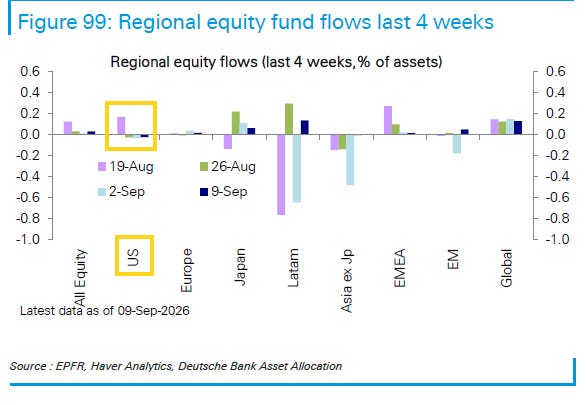
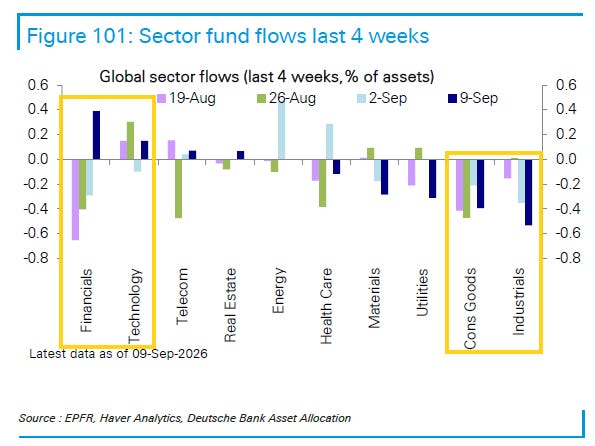
They note that while global funds saw inflows, the US saw a third week of outflows. Inflows were led by Tech and Financials, outflows by Industrials and Materials.
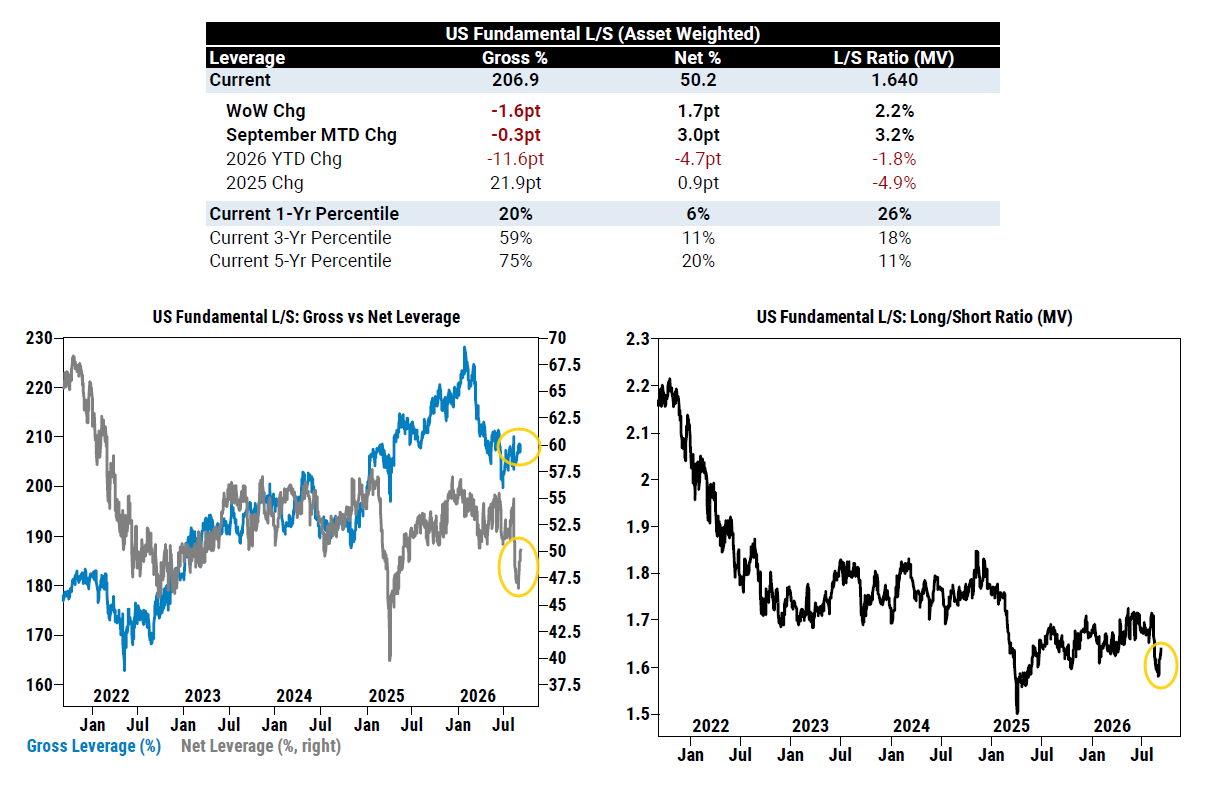
Goldman’s prime desk (mostly hedge funds) continues to see very modest positioning with fundamental long/short gross positioning at just the 20th percentile over the past year (although 75th past 5 years) and net positioning at just the 6th (20th).
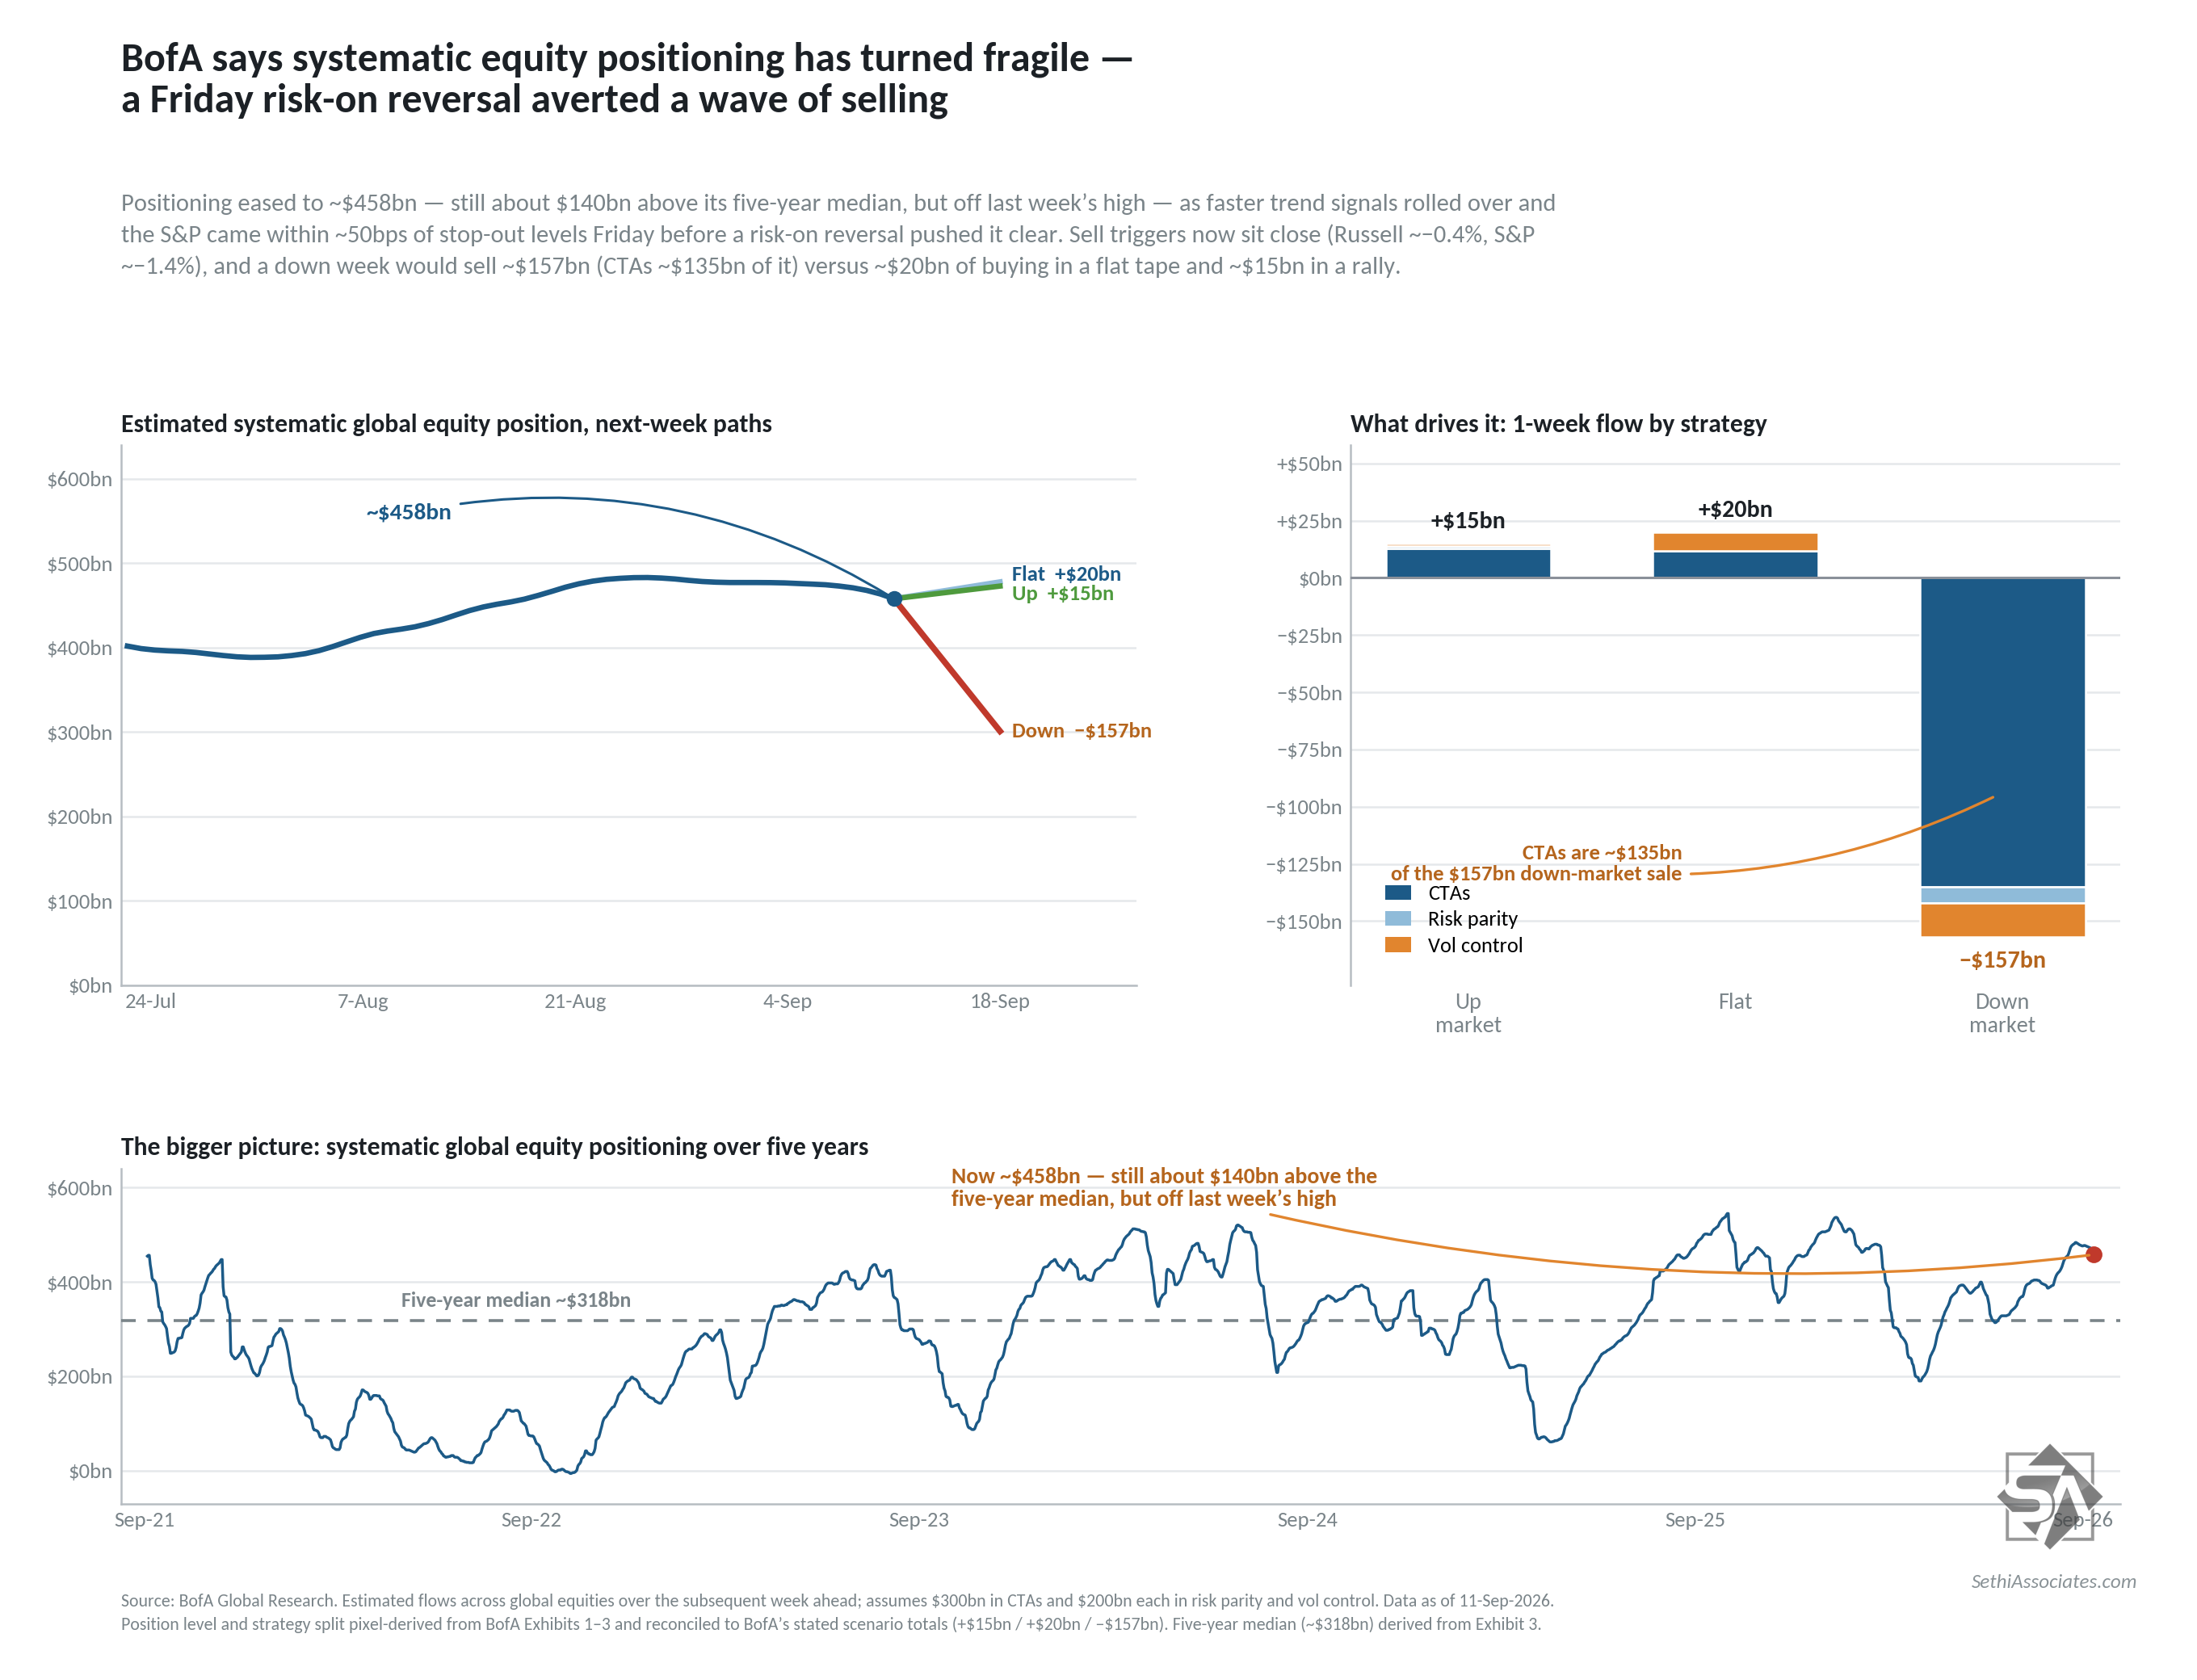
BofA in contrast to DB saw overall systematic positioning in global equities as having moderated last week, easing off last week’s high but remaining above its 5-year median. The note several faster trend signals rolled over on the week’s declines led by the Euro Stoxx 50 and Russell 2000, and by Friday morning the S&P 500 was within ~50bps of key stop-out levels before the sharp reversal pushed markets away from triggers and averted a broader wave of systematic selling. Positioning though remains fragile and while systematics are still modeled to buy modestly in flat and up markets, the erosion in faster signals leaves the near-term flow biased toward selling if equities weaken further, where the bulk of the risk sits.
The first layer of sell triggers now sits around −0.4% for the Russell 2000 and ~−1.4% for the S&P 500 — while the Nasdaq-100 retains more cushion (~−3.5%).
Specifically they see:
+$20B of buying in a flat market (from +$35B of buying the prior week);
+$15B of buying in an “up” market (from +$5B; “up market” defined as the 97.5th percentile price path or ~+3.5%, similar to Goldman); and
−$157B of selling in a “down” market (from −$126B last week and −$163B the prior week; “down market” defined as the 2.5th percentile price path or ~−2.9%, different than Goldman who uses −4.5%).
And Tier1Alpha also notes “concern” regarding CTAs (and also use the word “fragile” to describe the outlook):
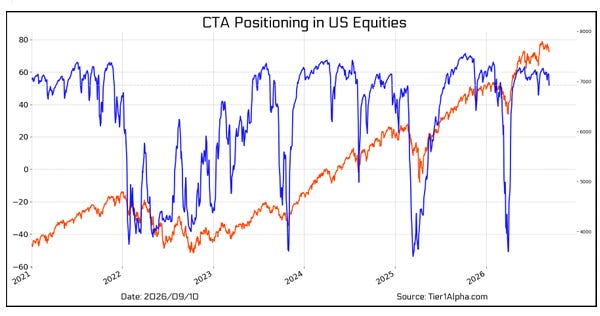
Looking ahead, the more concerning development is coming from the CTA space, where positioning has now started to decline. So far, the move has largely been isolated to momentum, which means we are not yet seeing aggressive deleveraging from these strategies. However, given how elevated CTA exposure remains, we view this as a clear structural inflection point, particularly if a volatility shock develops over the next week or so.
For now, we view this as a highly fragile setup, but not one that has crossed the point of no return. Overall, we’re left with dealers in negative gamma, the vol control buying impulse is beginning to fade, and CTA positioning is starting to soften. None of those factors are catastrophic on their own, but the margin for error is clearly getting smaller.
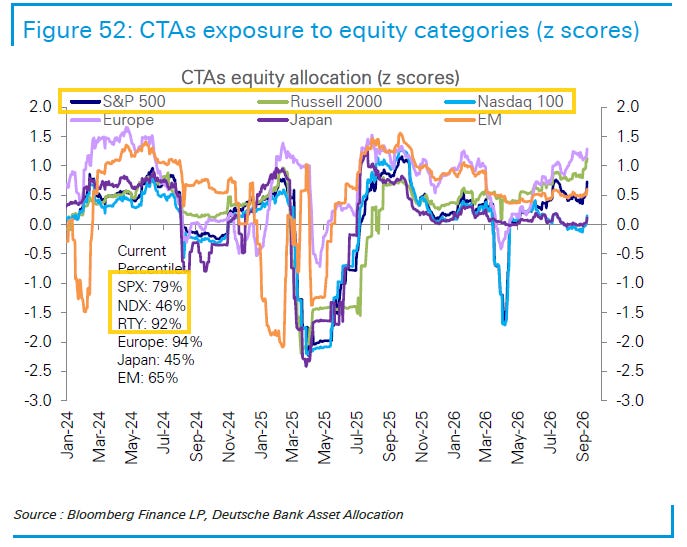
DB also sees global CTA positioning as “elevated” at the 89th percentile to 2010 although weaker in the US at the 78th percentile (but up from the 68th percentile a week ago), with the Nasdaq-100 continuing to lag at the 46th percentile (but up from the 37th) while SPX and RUT are at the 79th and 92nd (from the 67th and 87th) respectively.
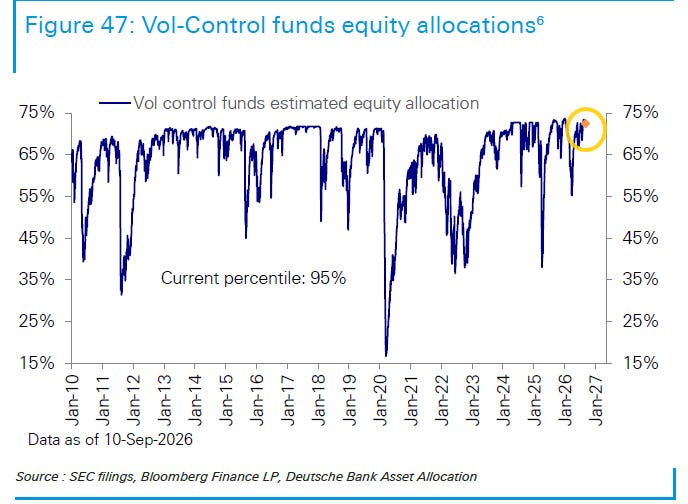
DB’s estimate of vol control* positioning in contrast to their estimates on CTAs, eased back from “historical maximums (100th percentile)” the prior week but remained “elevated” at the 95th percentile but still leaving “little capacity to add further”:
Sell-off sensitivity increased modestly this week but remained relatively contained, suggesting near-term deleveraging risk is still limited. With positioning near historical highs, funds have limited capacity to add further to equities.
*vol control strategies enter and exit based on changes in volatility over past windows (mostly 1-month and 3-month).
Tier1Alpha as a reminder was looking for vol control positioning to be a significant buyer. That did come through to some extent, adding around $15B, but less than they had looked for. Still they note
There are still a few additional releveraging opportunities next week, but this latest buying wave is largely coming to an end, which means we expect the positive influence from these funds to weaken from here. Clearly, this is not the outcome we had hoped for coming into the week, but ultimately we have to work with the market we are given.
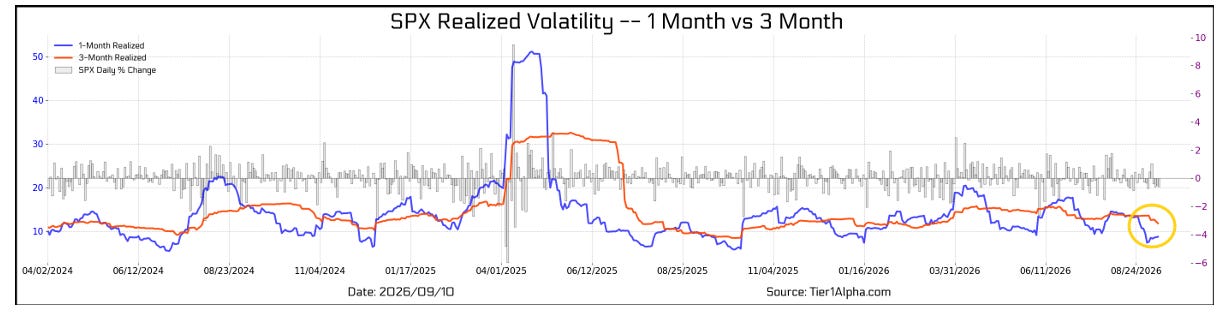
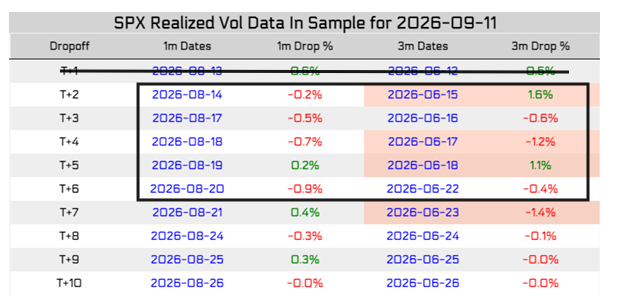
(as a reminder from two weeks ago “1-month realized volatility has now fallen back below the 3-month measure, shifting the 3-month reading into the primary volatility input for funds that deploy volatility scaling as a way to manage risk”):
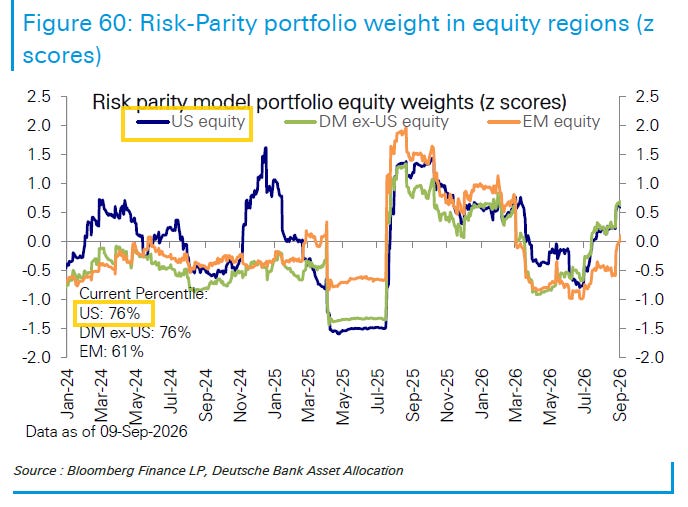
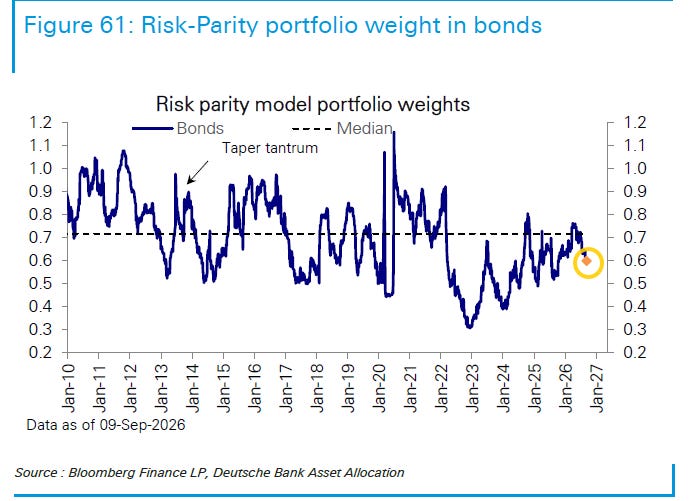
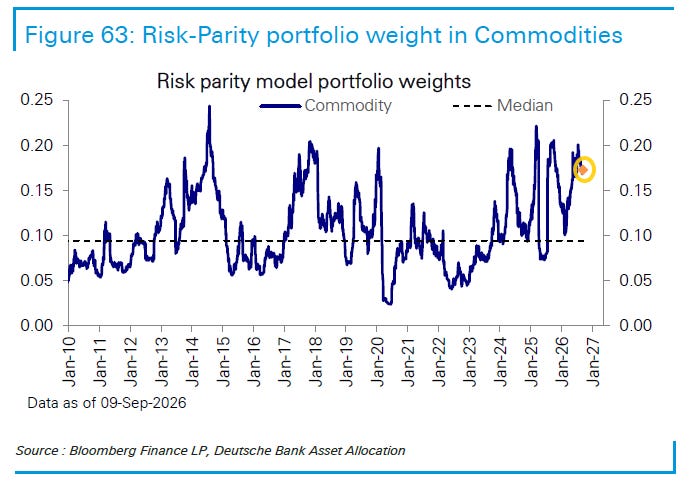
While for risk parity DB says equity positioning “were little changed this week” after rising the prior three weeks with the US at the 76th percentile from the 67th percentile three weeks ago. That leaves it overweight. Bond exposure edged up to the 34th percentile while commodities remain elevated at the 91st.
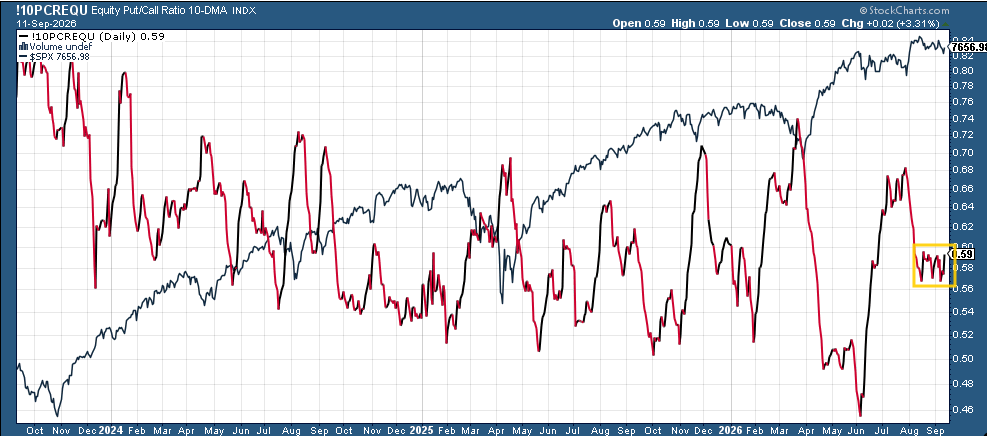
While call/put buying (which adds incremental upside/downside pressure) continued to chop back and forth for a sixth week.
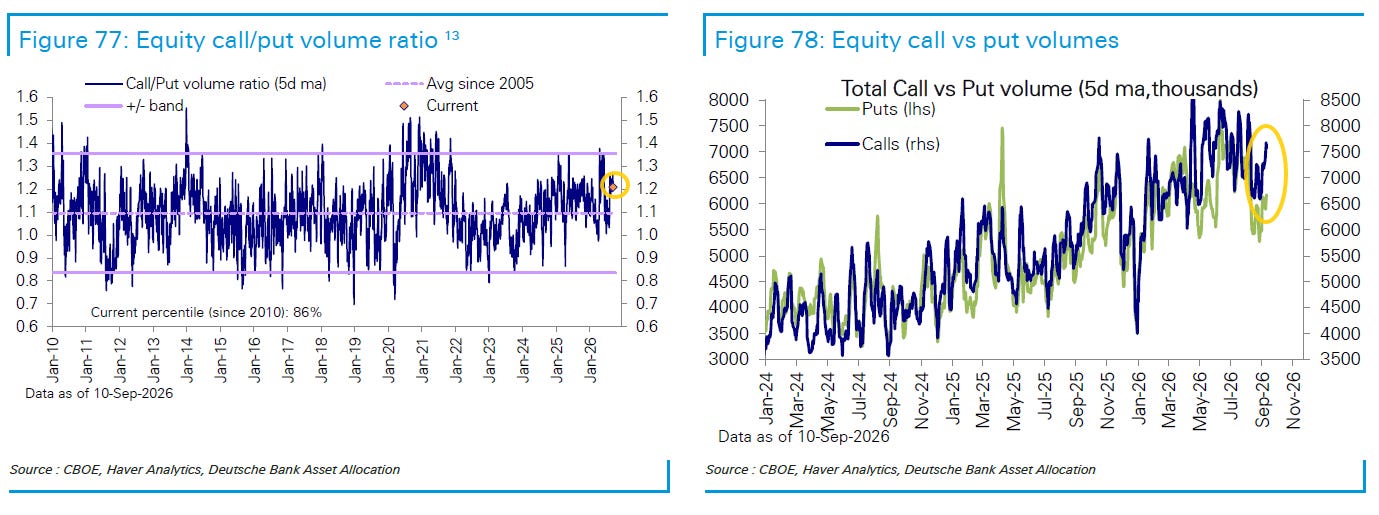
DB, though, saw a more notable rise in calls versus puts last week, seeing the ratio push back up to the 86th percentile since 2010 from the 78th, and not far from the 5-year high of the 89th percentile two weeks ago:
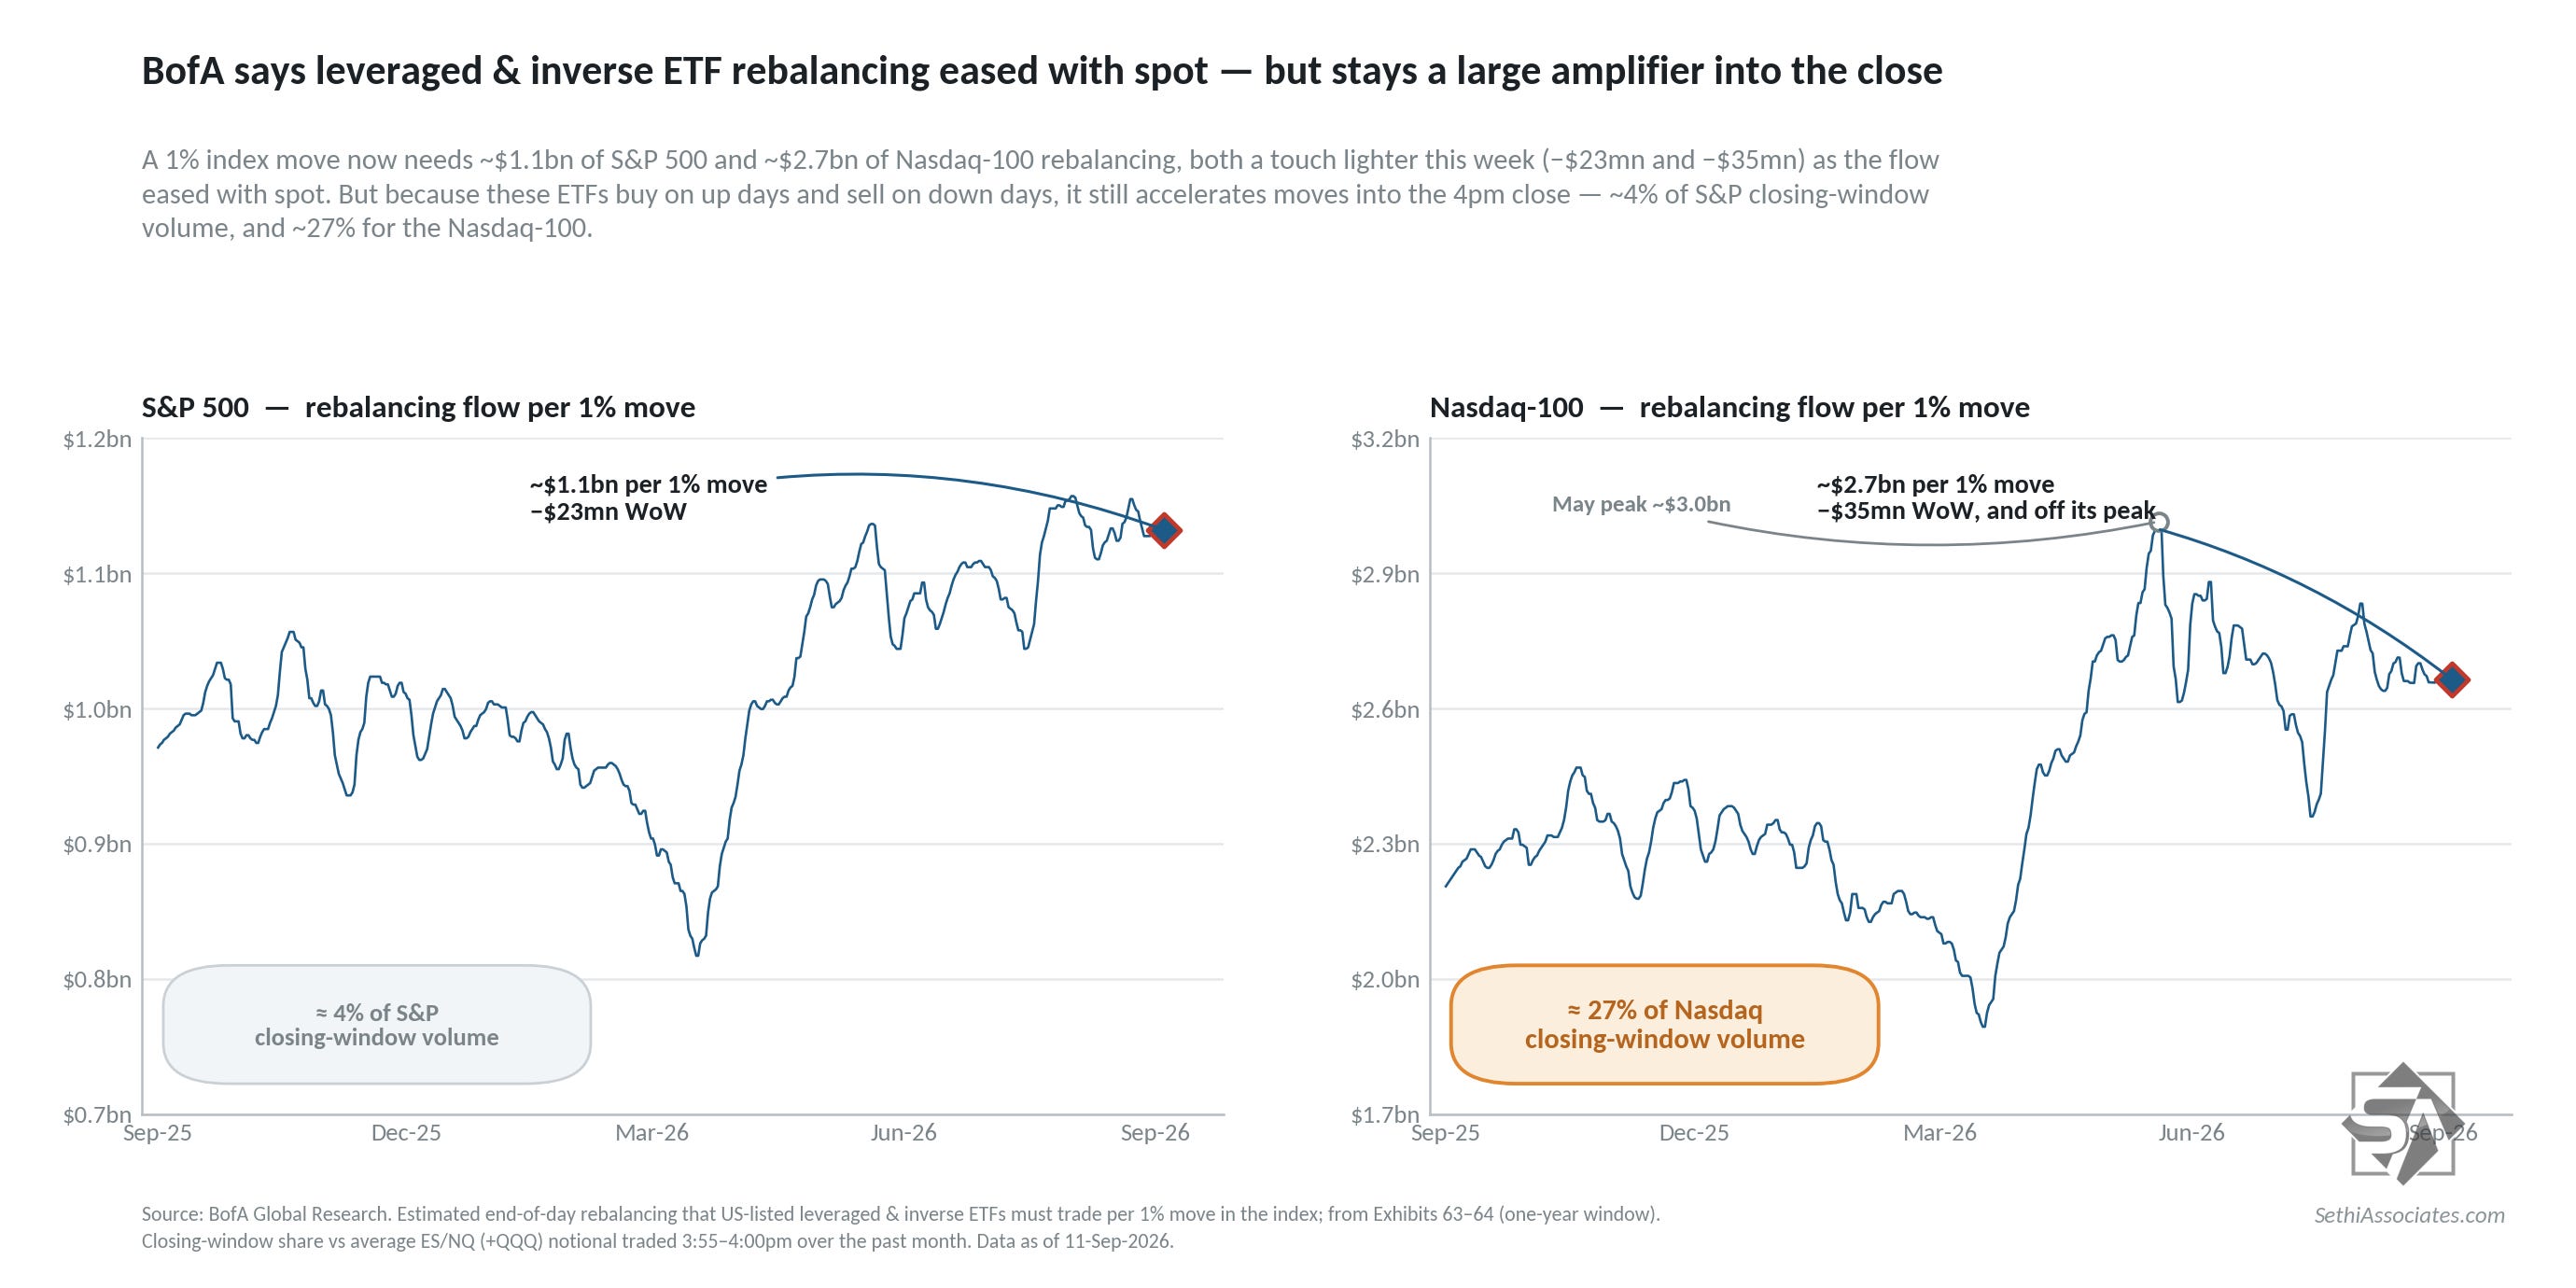
Like call buying, leveraged positioning acts as a “negative gamma source” as Charlie McElligott has put it (meaning that there is added buying/selling pressure from them in the direction of daily flows as they rebalance each day).
Rebalancing flows for Nasdaq-100 and SPX leveraged ETFs eased back but remained at solid levels particularly the SPX which is just off 52-week highs.
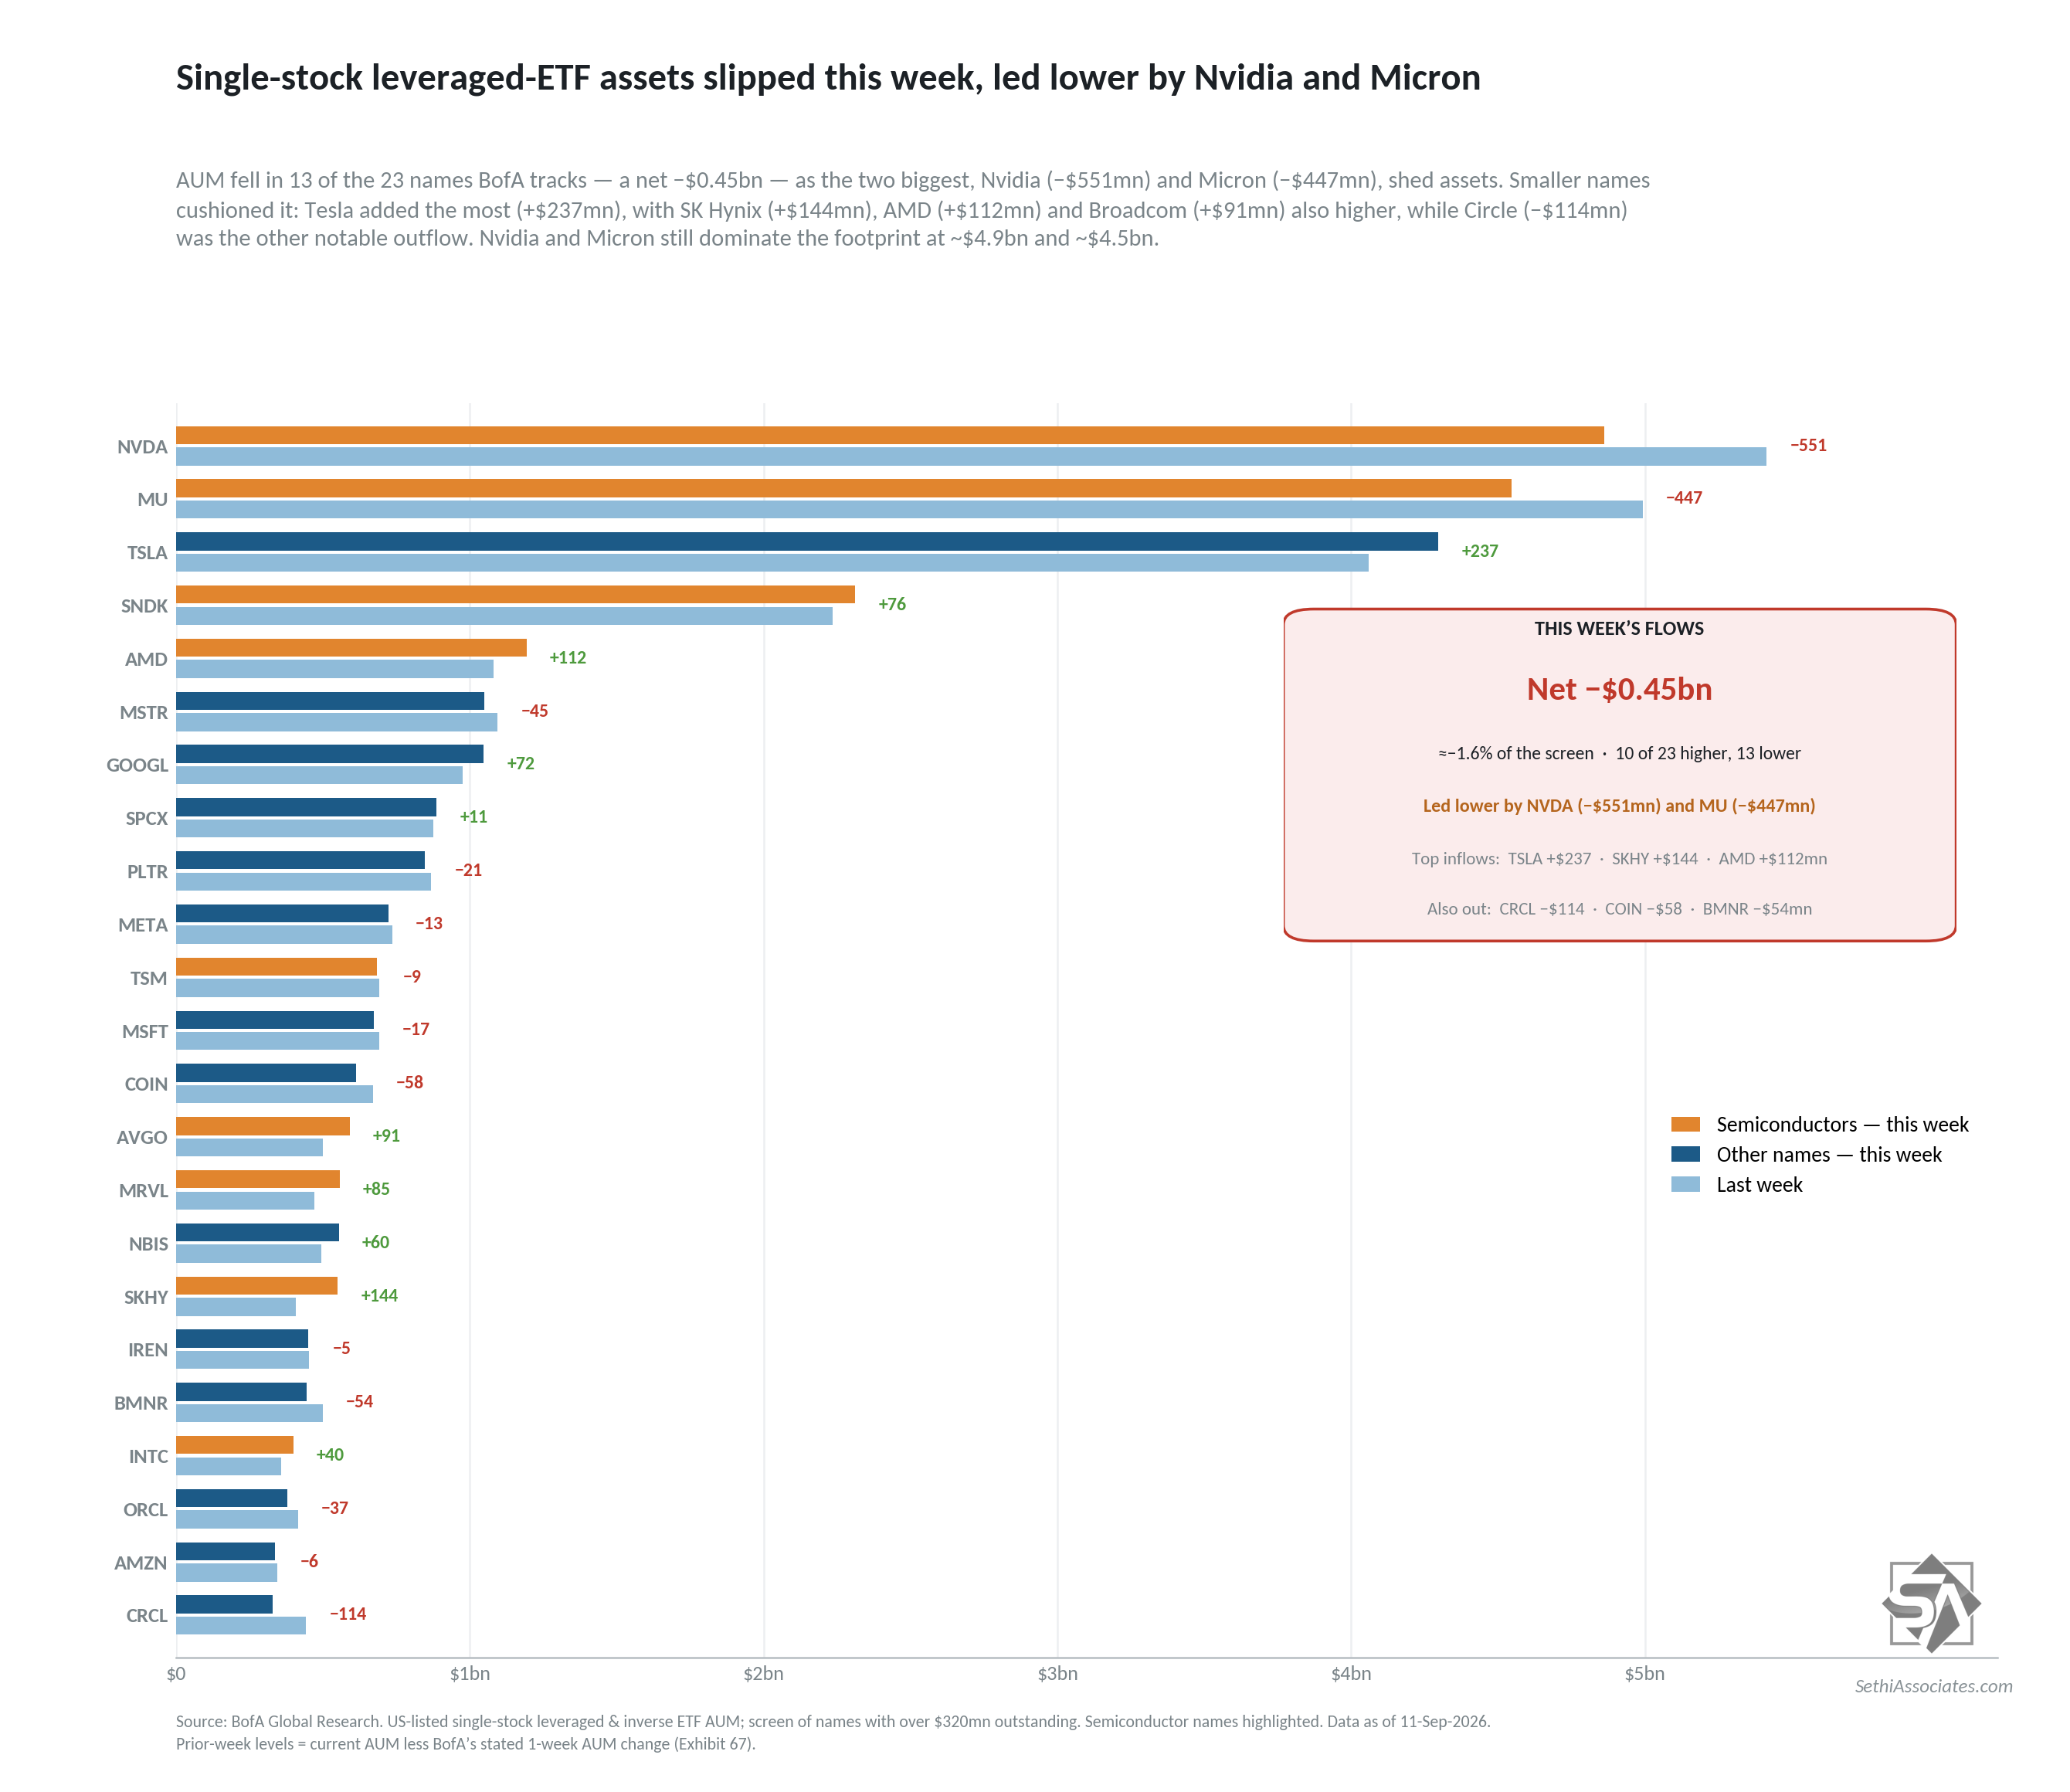
Single-stock leveraged ETF AUM also eased back led lower by Nvidia (NVDA) and Micron (MU) leveraged ETFs.
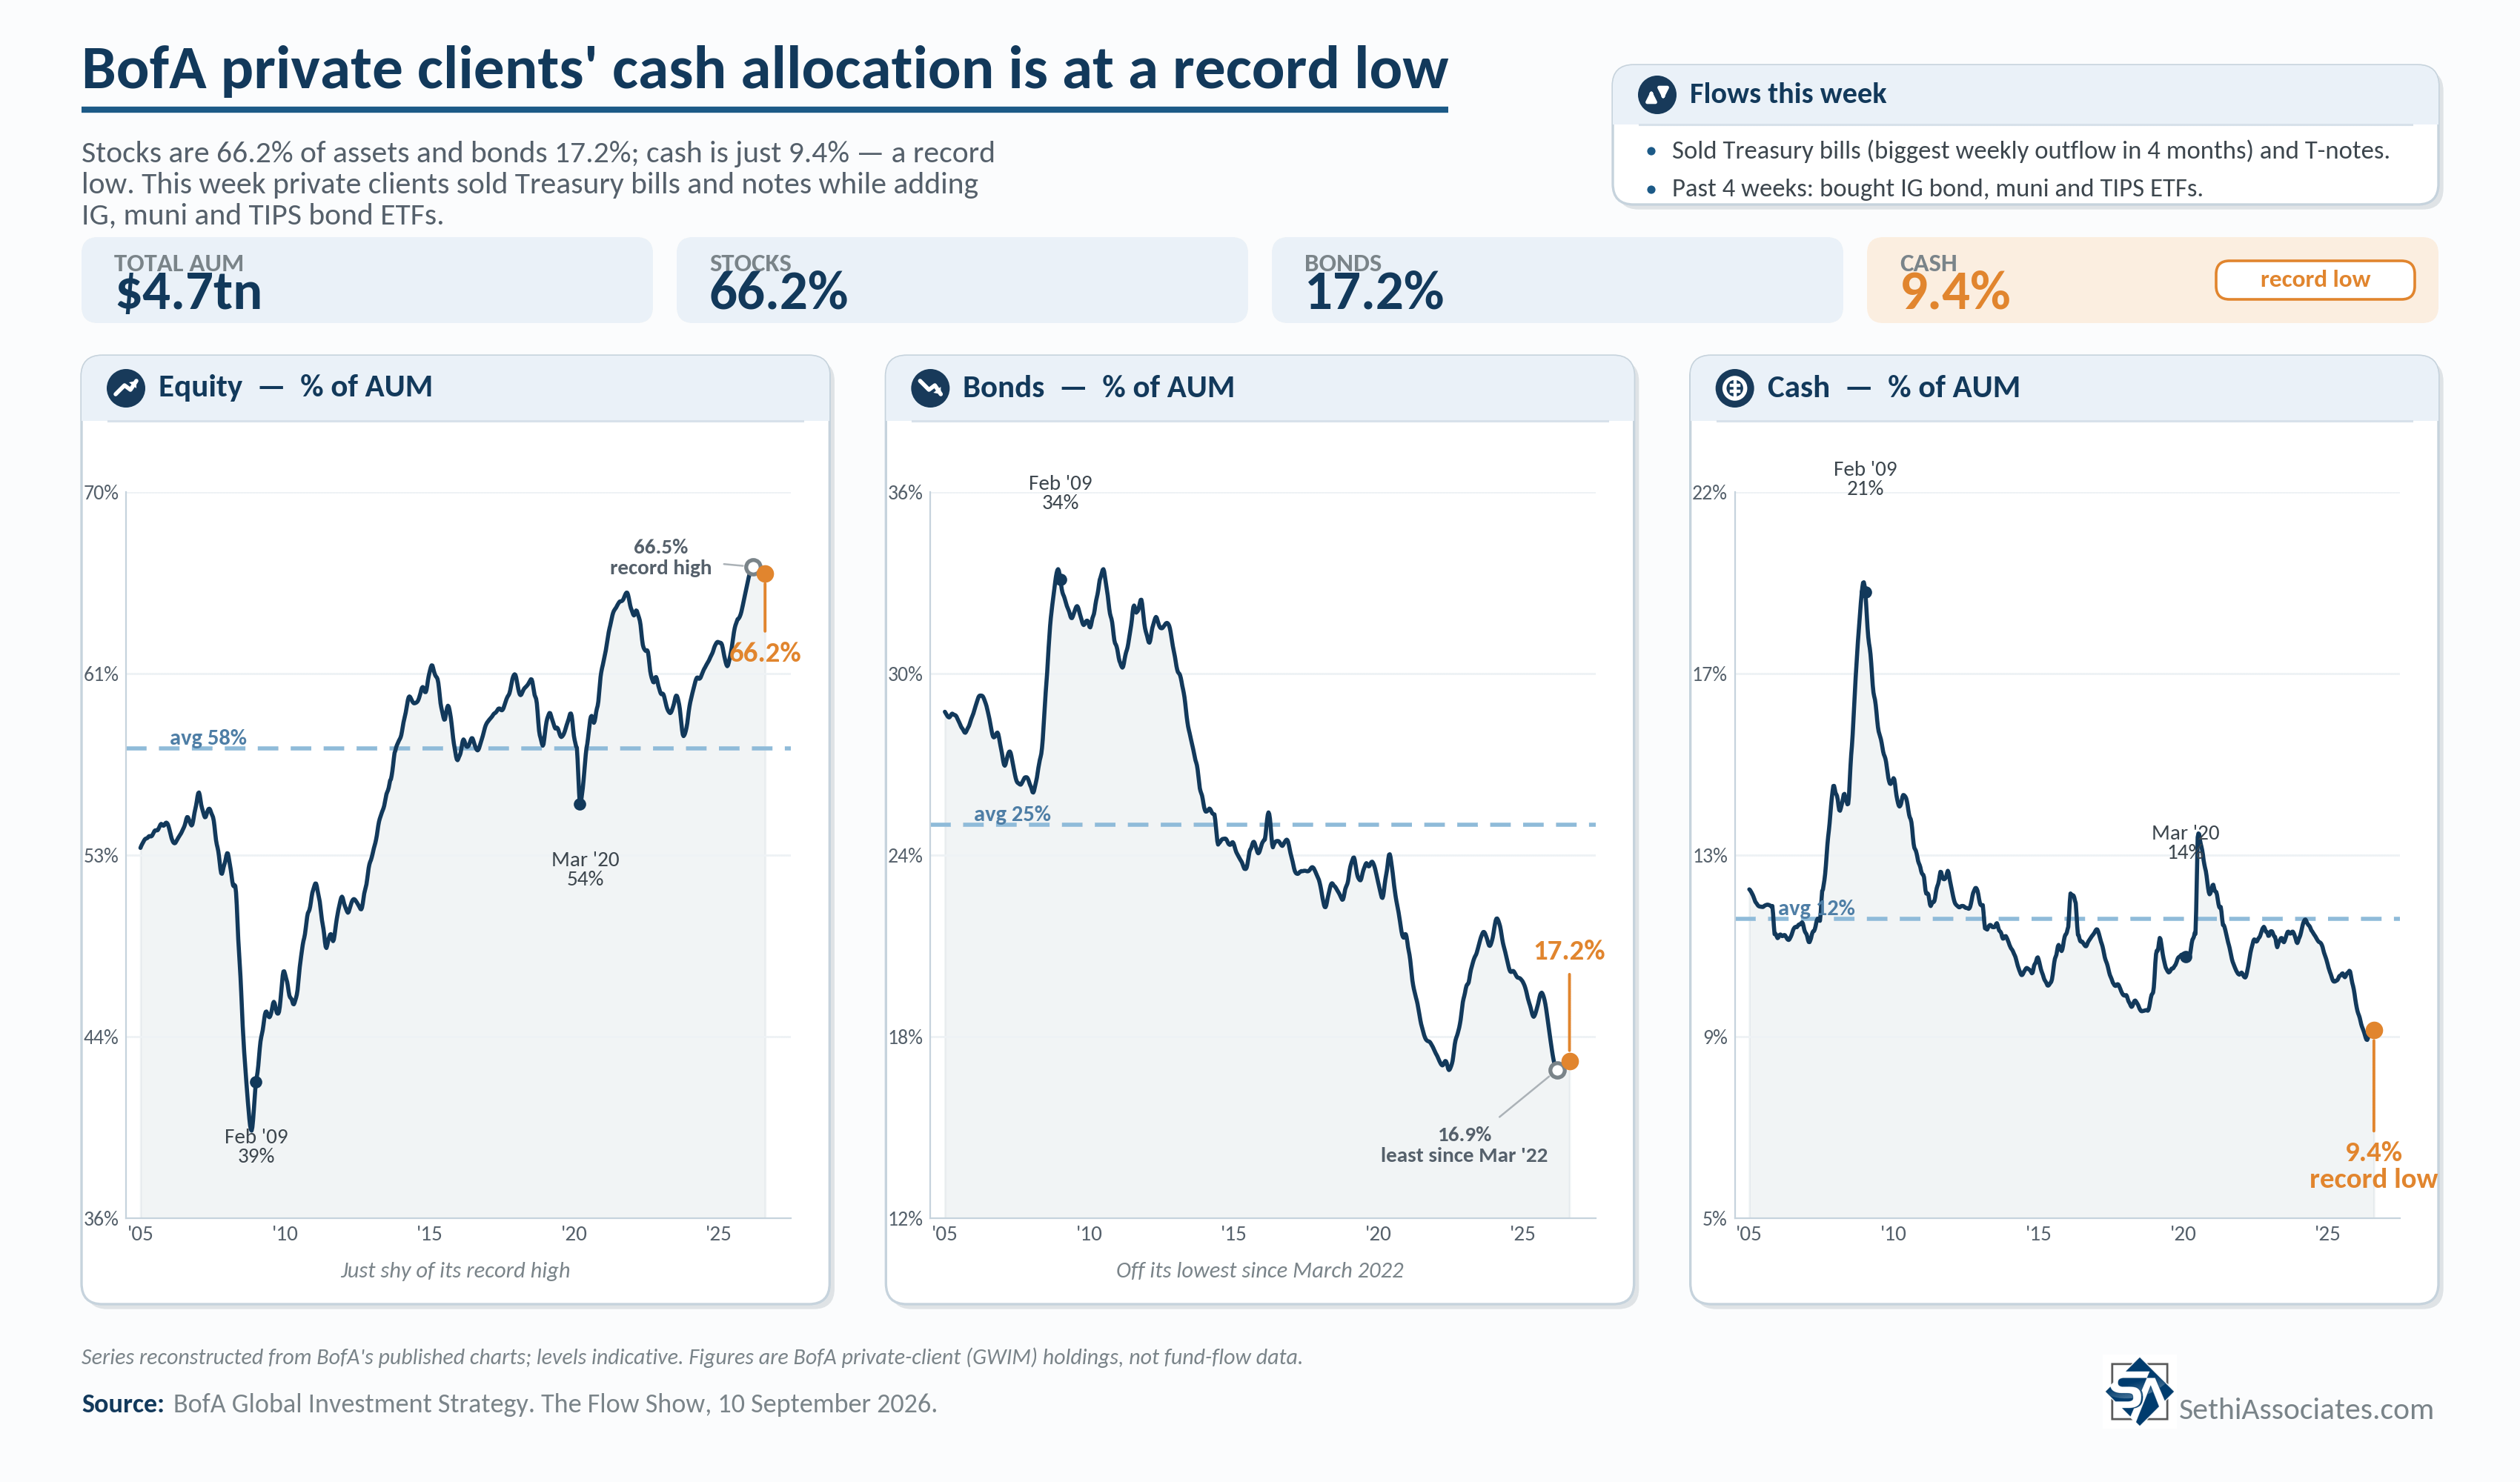
Turning to retail positioning, BofA client retail equity positioning edged higher with AUM in stocks to 66.2% (+0.1% w/w, all-time high was 66.5% two weeks ago), 17.2% in bonds (unchanged w/w, 16.9% two weeks ago was the lowest since March 2022), while cash remained at a record low 9.4%.
On bonds the report noted that clients saw the largest outflow from T-Bills (less than 1 year in maturity) in four months with some of that going to notes/bonds (longer than 1 year in maturity).
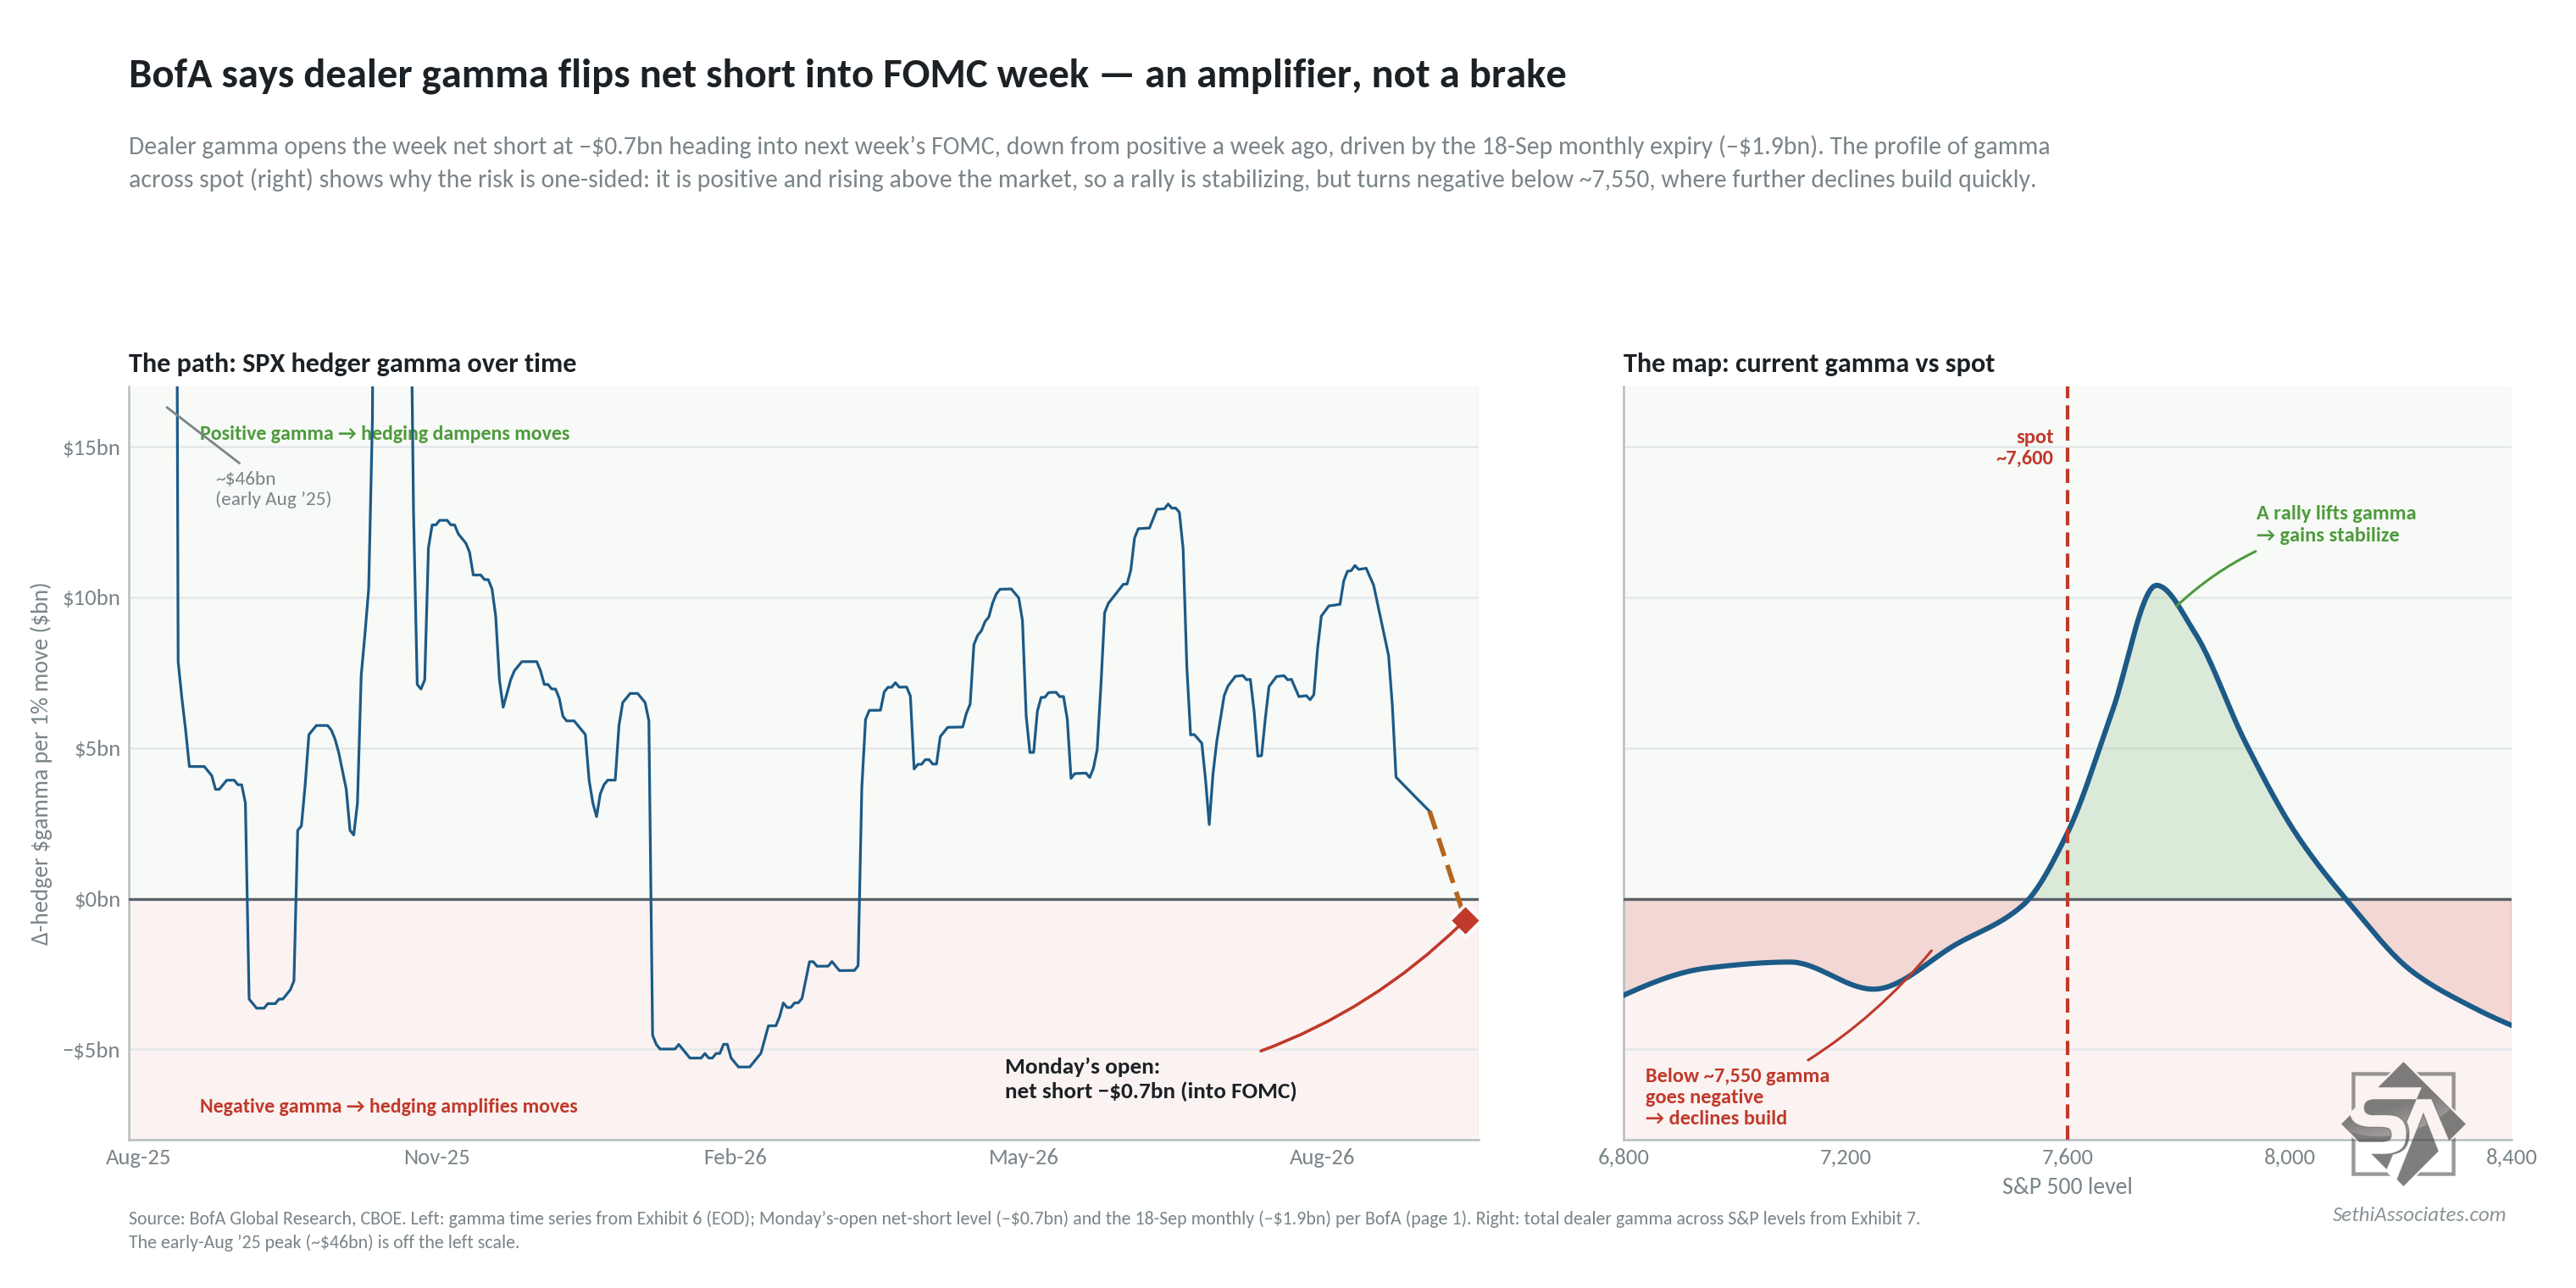
And looking at gamma (which is an important if nebulous role in market volatility —positive gamma means options market makers will buy/sell in the opposite direction of moves in price dampening volatility, while negative gamma means the inverse and market makers accelerate rallies/sell-offs adding to volatility):
BofA saw SPX gamma as of Thursday dropping sharply “to $2.9bn (37th %ile)” and they note “Friday’s expiry contributes [another] $2.9bn that rolls off,” meaning “heading into FOMC, hedgers are net short gamma across expiries … (-$0.7bn),” so they start the week as a destabilizing force (buying in the direction of moves in spot).
They further note that “within the Sep monthly, hedgers are net short ~25k contracts between 7500-7650 and net long ~18k contracts between 7650-7800, a position that could push gamma more negative on a downtick and higher if spot rallies,” leaving the potential for moves lower to build quickly, adding to the “fragile” systematic situation BofA noted.
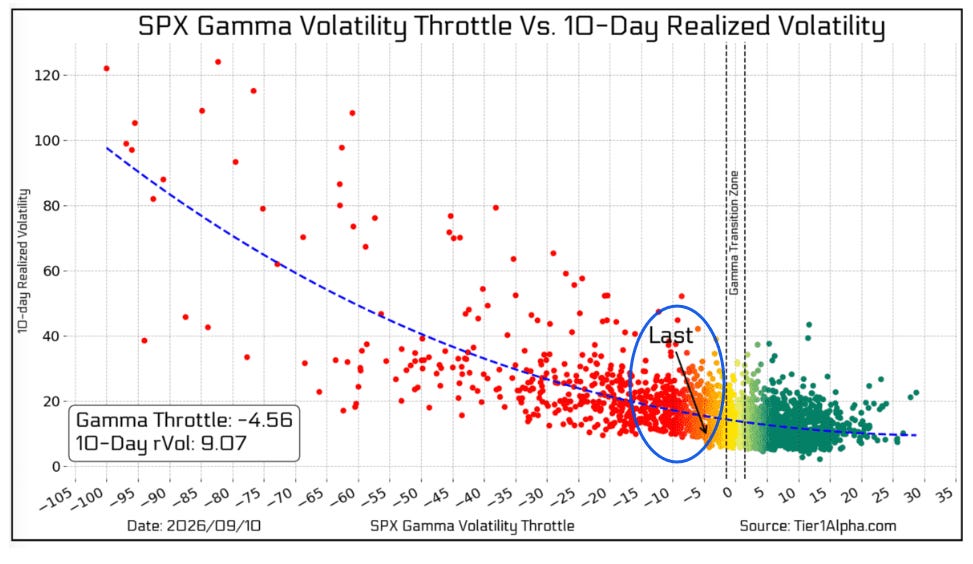
Tier1Alpha’s update was also as of Thursday night and they already saw the SPX in negative gamma:
SPX has slipped back into negative gamma territory. Our GVT index has now fallen to -4.56, although realized volatility remains notably lower than what we would typically expect in a short-gamma environment.
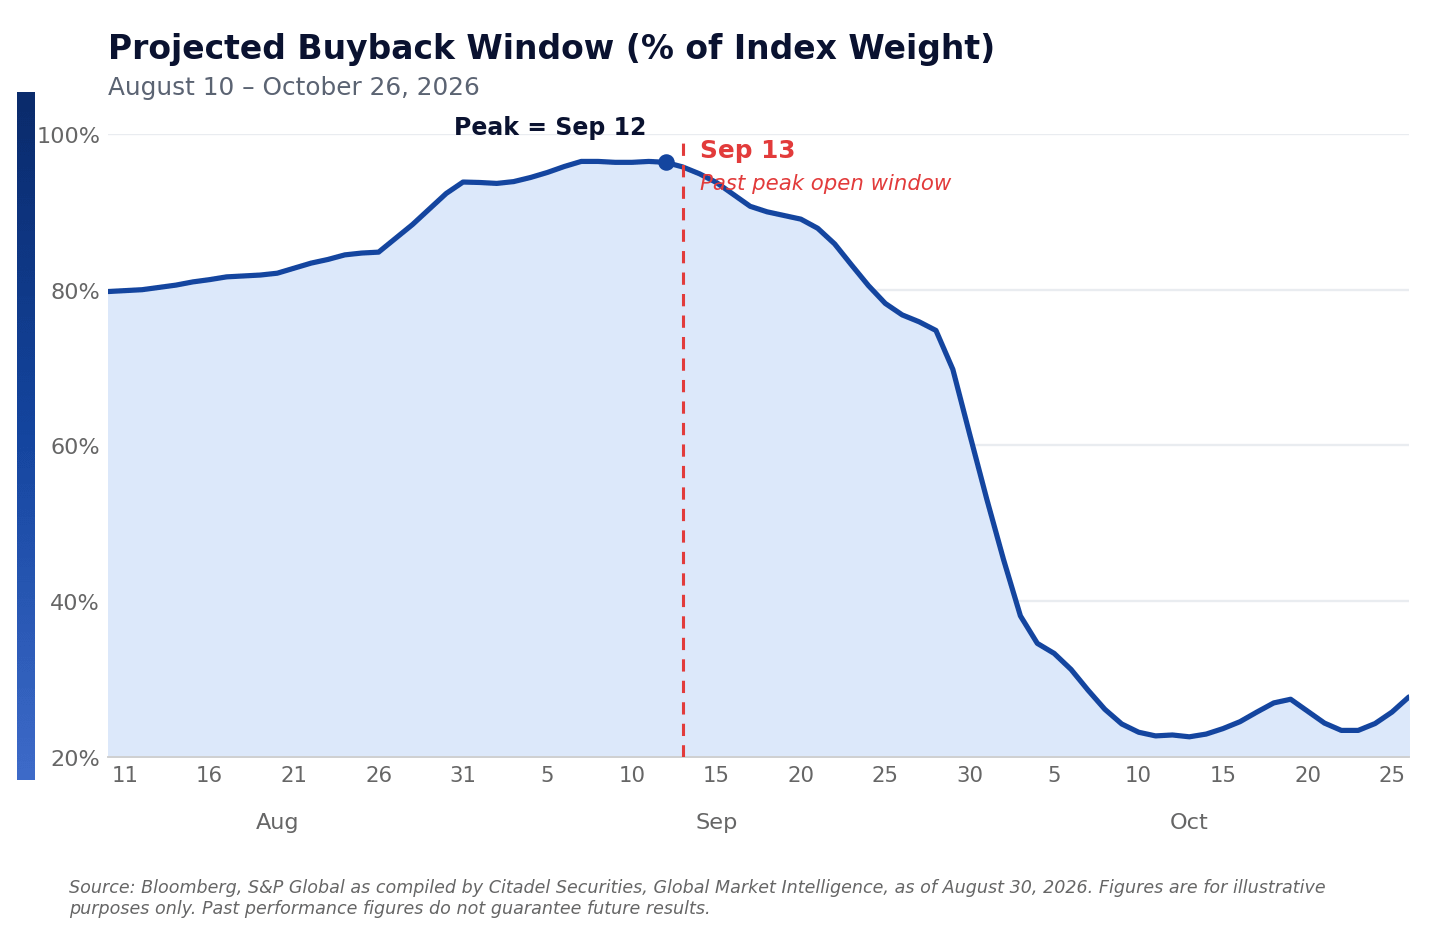
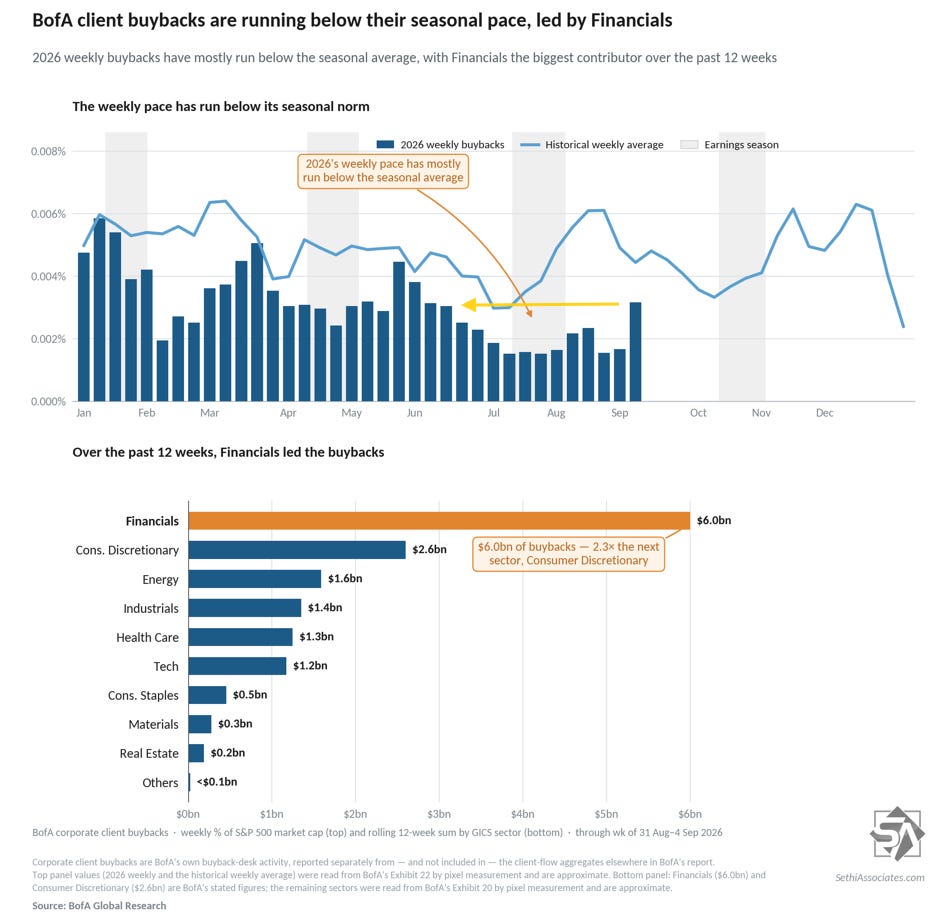
Turning to corporate buybacks (an important source of underlying demand), we have now passed the peak of the open buyback window but still will have nearly 100% of discretionary buybacks by index weight for S&P 500 companies active this week (discretionary buybacks represent ~30% of all buybacks). This will start to fall quickly though as we move through the month (another reason that September is seasonally weak).
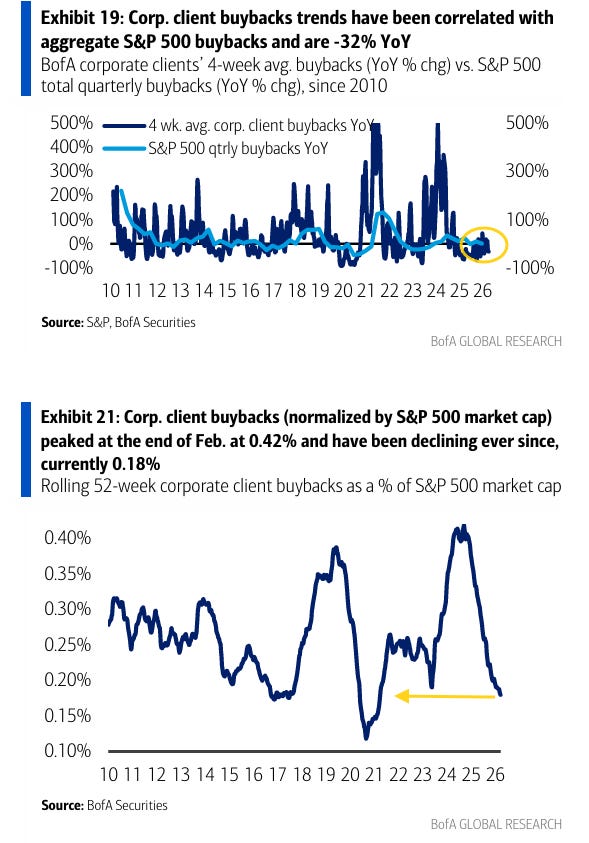
BofA says buybacks “accelerated for the 2nd week, again driven by Financials,” the fifth week of acceleration in six (consistent with the reopening of the buyback window) to the strongest since early June, although they remain well under the historic average for this week and on a 4-week average basis they fell to -32% y/y from +5% three weeks ago, and they remain well below the historical average for this week when normalized by market cap.
YTD they say annualized buybacks are “slightly below full-year ‘25 levels and below ‘24 records, but above 2016-23 levels,” but as a % of market cap are now the least since 2021 (on a rolling 52-week basis).
Sentiment Growing More Mixed
Sentiment (which I treat separately from positioning) is one of those things that is generally positive for equities when it’s above average but not extreme (“it takes bulls to have a bull market”, etc.), although it can stay at extreme levels for longer than people think, so really it’s most helpful when it’s at extreme lows (“washed out”).
Currently we are not near either extreme:
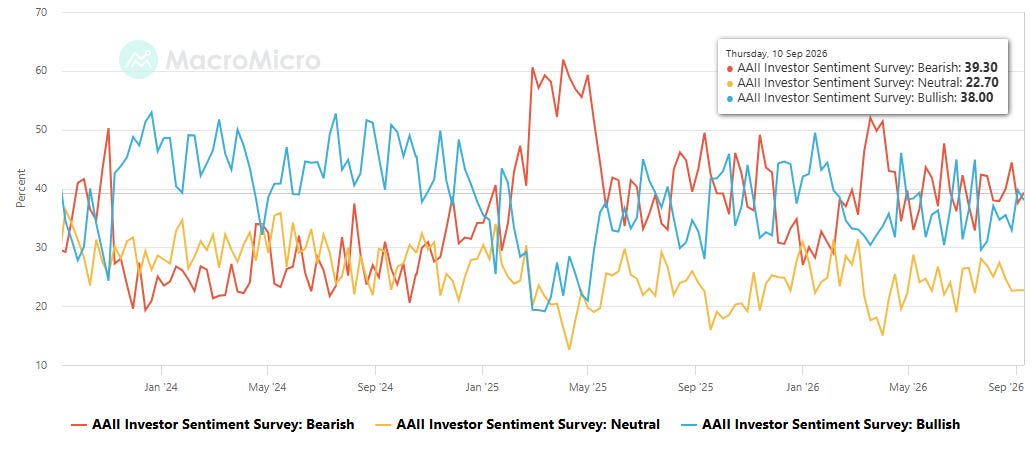
American Association of Individual Investors (AAII) sees bulls fall back to just below the bears (7th week in 8 and (and 22nd in 28)):
AAII bulls (those who see higher stock prices in 6 mths, blue line) eased to 38.0% from 39.7% the prior week, but remaining above the long-term historic average of 37.5% for a second week.
Bulls also fell just back under the level of the bears (who see lower stock prices in 6 mths, red line) with the bears edging up to 39.3% from 37.6%. Bears also remain above the long-term average of 31.0% for a 30th straight week (and they’ve only been below it 9 weeks since Dec 12, 2024).
The Neutral camp (yellow line) was unchanged at 22.7%. It remains under the long-run average of 31.5% and has been over that only twice since July 2024.
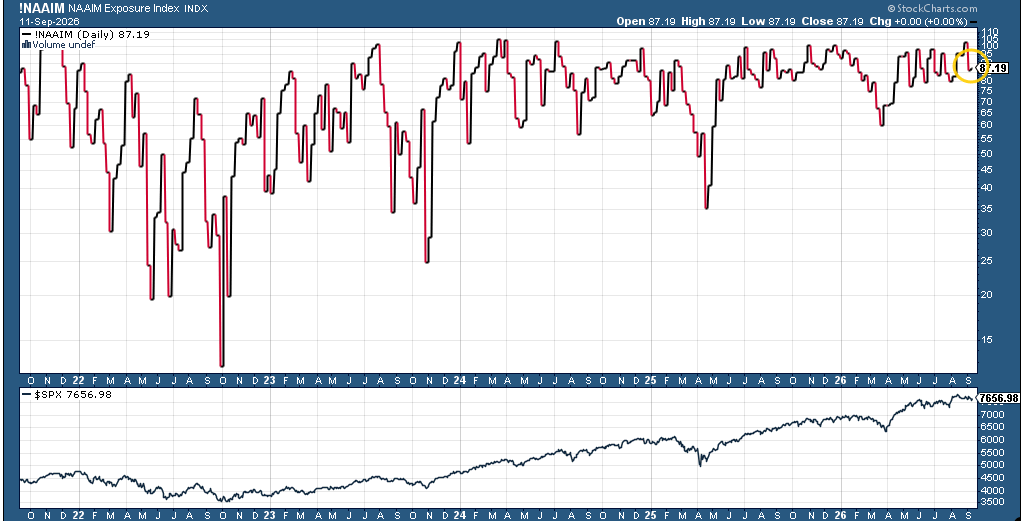
NAAIM’s survey of investment professionals* edged higher to 87.2 from 85.6 but only after falling from 102.66 the week before that (meaning they were on margin) which was the highest since July of 2024.
*The index according to NAAIM “represents the average exposure to US Equity markets reported by our members” and which ranges from -200% (2x short) to +200% (2x long).
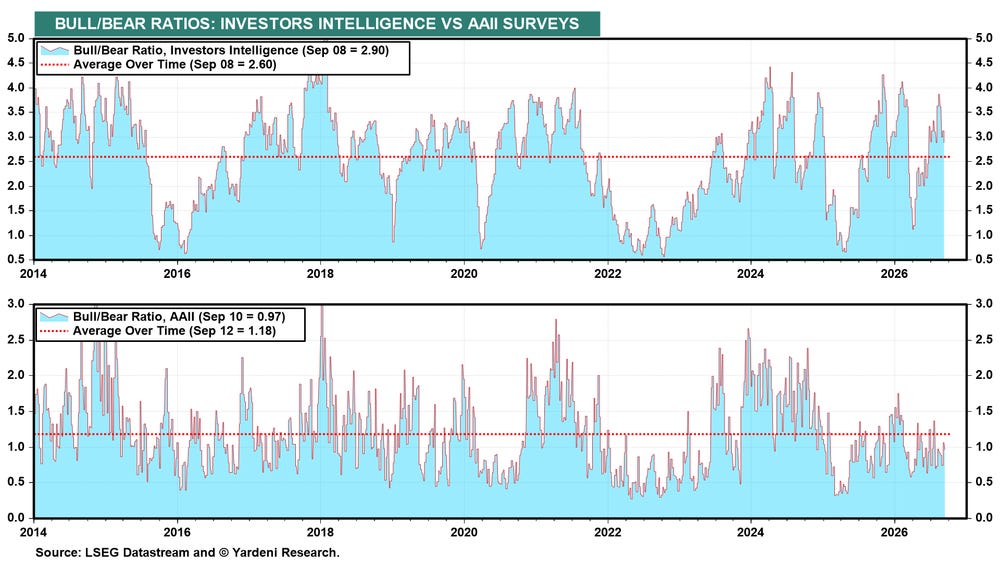
While the Investors Intelligence (independent investment-newsletter writers) survey saw the bull/bear ratio fall back to 2.90 from 3.12 closer to its average since 2008.
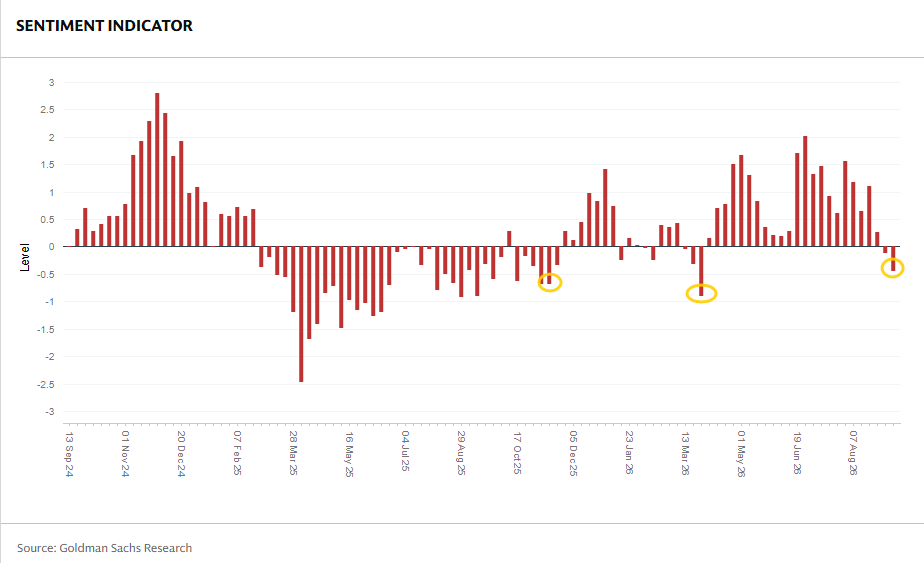
And Goldman’s US Equity Sentiment Indicator*, fell for the fifth week in six moving further into negative territory at -0.45, the least since late March.
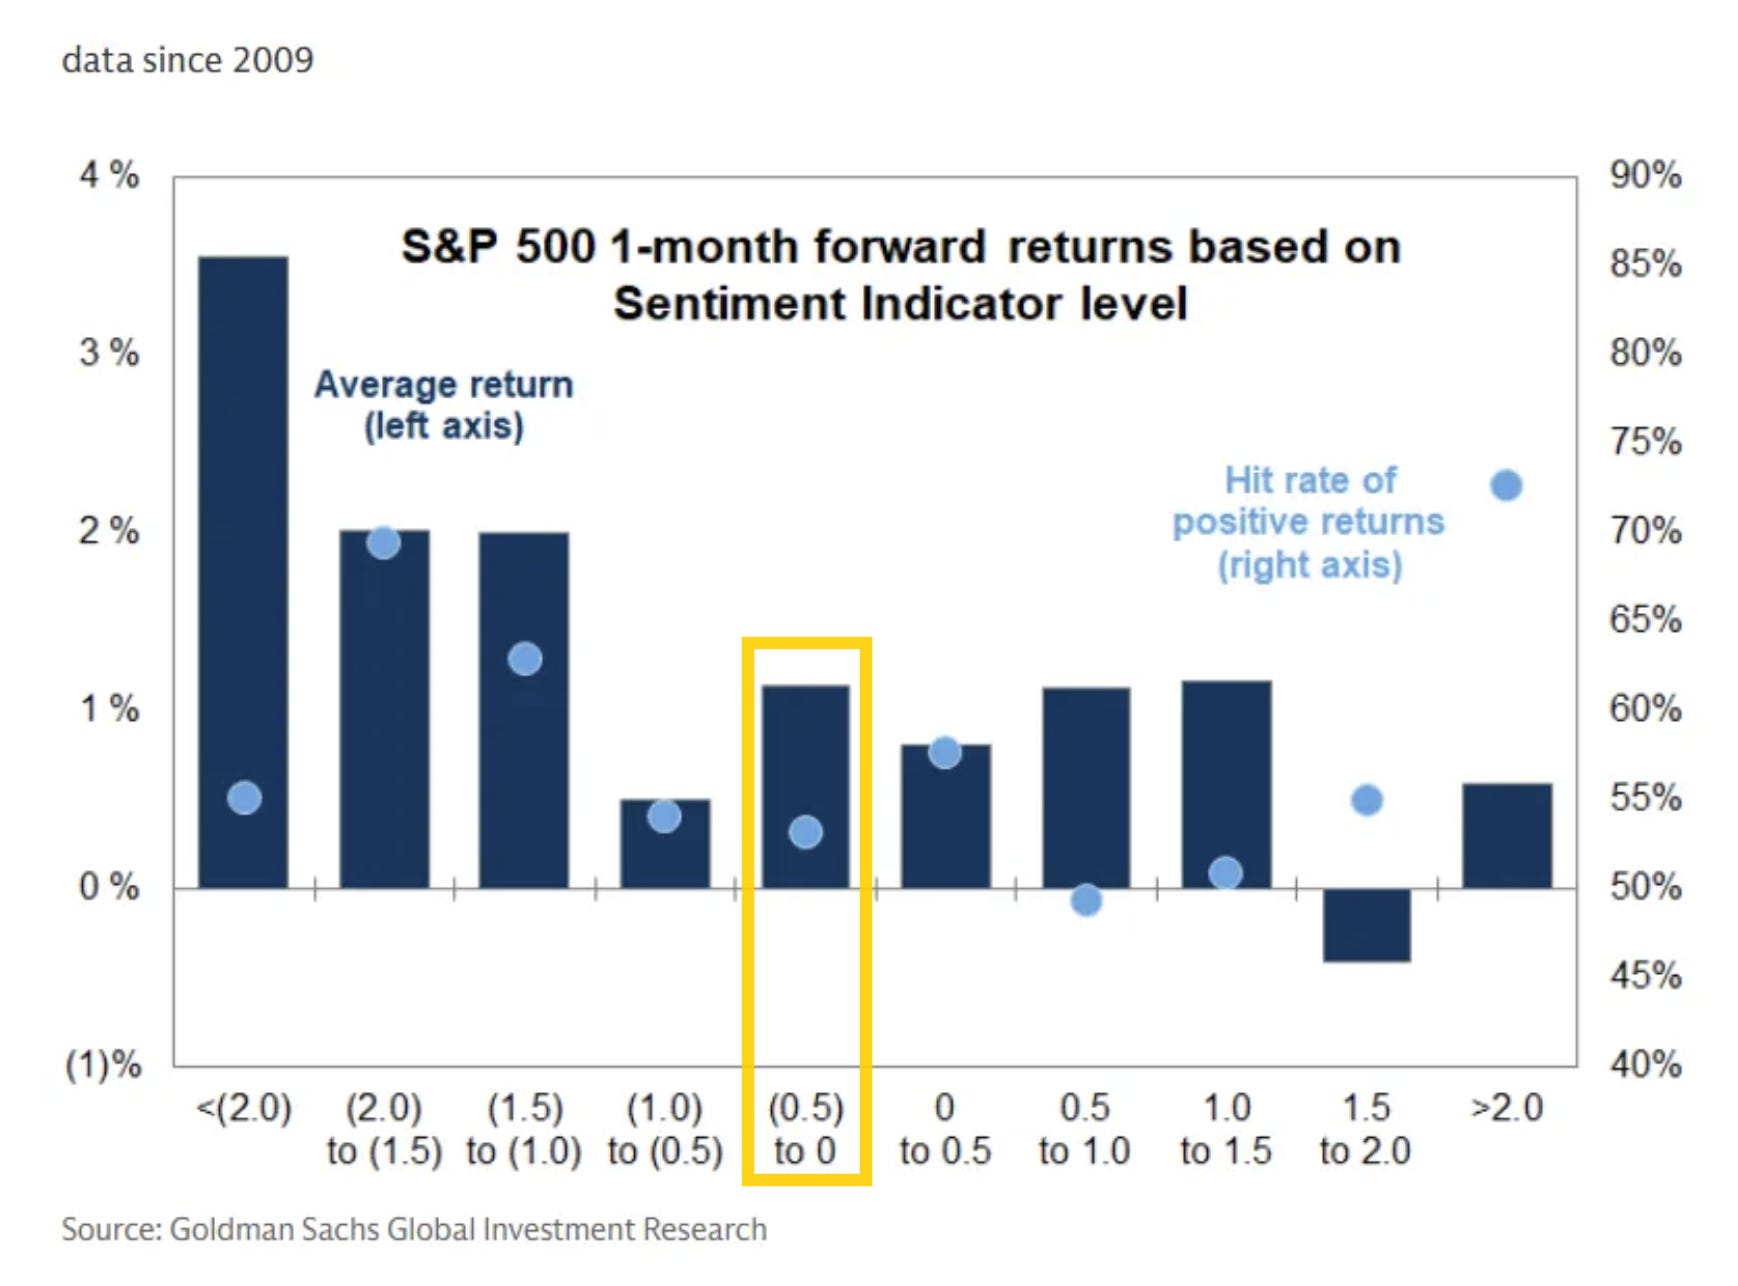
The current reading is consistent though with a 1-month average return of around 1% since 2009 with a positive rate over 50%.
*The indicator combines “six weekly and three monthly indicators that span [across the more than 80% of the US equity market that is owned by institutional, retail and foreign investors]. Readings of +1.0 or higher have historically signaled stretched equity positioning. Readings of -1.0 or lower have signaled very light positioning and have historically been a statistically significant signal for subsequent S&P 500 performance”.
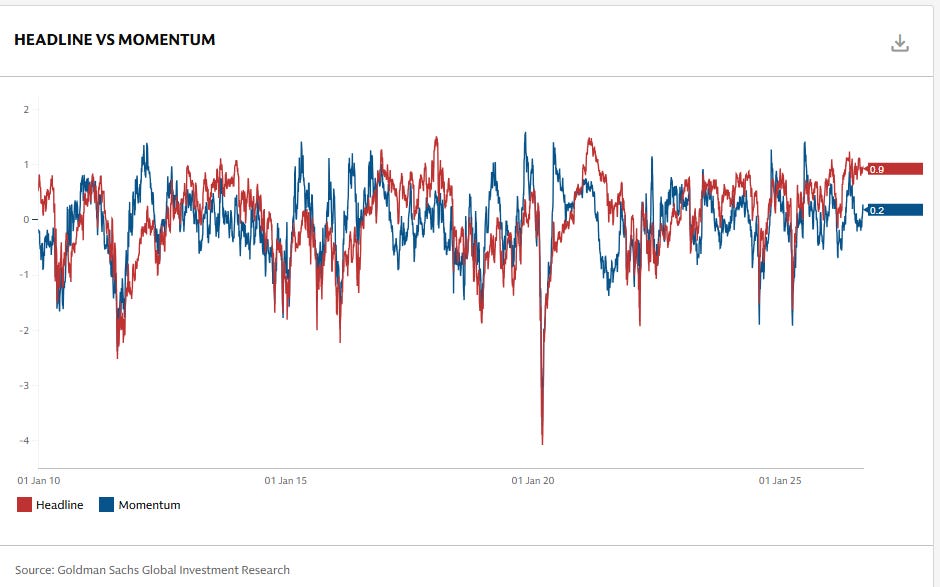
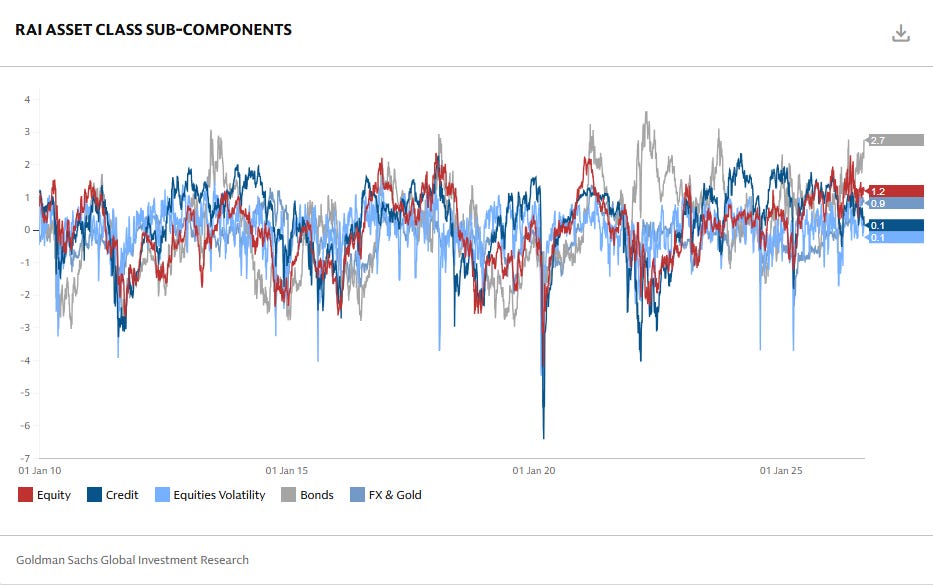
But Goldman’s Risk Appetite Indicator* remains more elevated at 0.9, associated with below-average returns over the next 1, 3, 6, and 12 months although still positive 62, 67, 87, and 71% of the time respectively.
*”Goldman Sachs Risk Appetite Indicator (RAI) aims to track the level of global market risk appetite and risk aversion based on various market variables. A sharp rise in the index can send a warning signal that investors have more risk appetite and are potentially exposed to a correction if consensus views are tested. Similarly, a sharp decline indicates a reduction in risk appetite, and at extreme levels it can indicate that markets may have overshot. RAI signals are most powerful when the level of risk appetite is very low below -1.5, with levels closer to -2.0 giving the clearest signal over longer time horizons, as at such levels the asymmetry of subsequent medium term equity return becomes very positively skewed. RAI momentum is designed to track short term shifts of market risk appetite, and subcomponents of the RAI.”
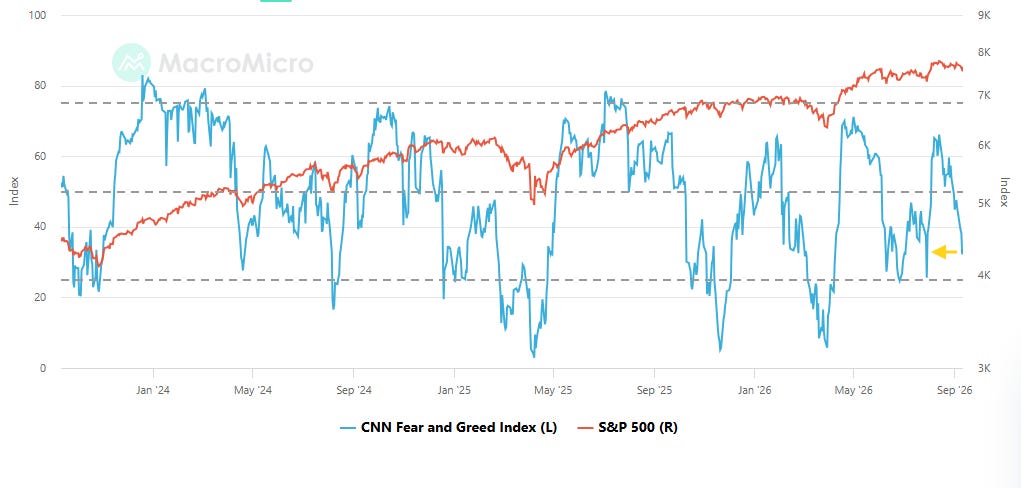
While the CNN Fear & Greed Index (blue line) continued to drop down to 33.3, the least since July 29th remaining in “Fear”.
We remain with just one indicator above Neutral and now five below (from three).
As a side note, if you have any questions on the indicator, TheStreet Pro’s own Jason Meshnick is your guy, as he helped create it.
Fear = market momentum (SPX vs 125-DMA); put/call options (5-day put/call ratio) (from Neutral); safe haven demand (20-day difference in stock/bond returns)
Extreme Fear = stock price strength (net new 52-week highs); stock price breadth (McClellan Volume Summation Index) (from Neutral)
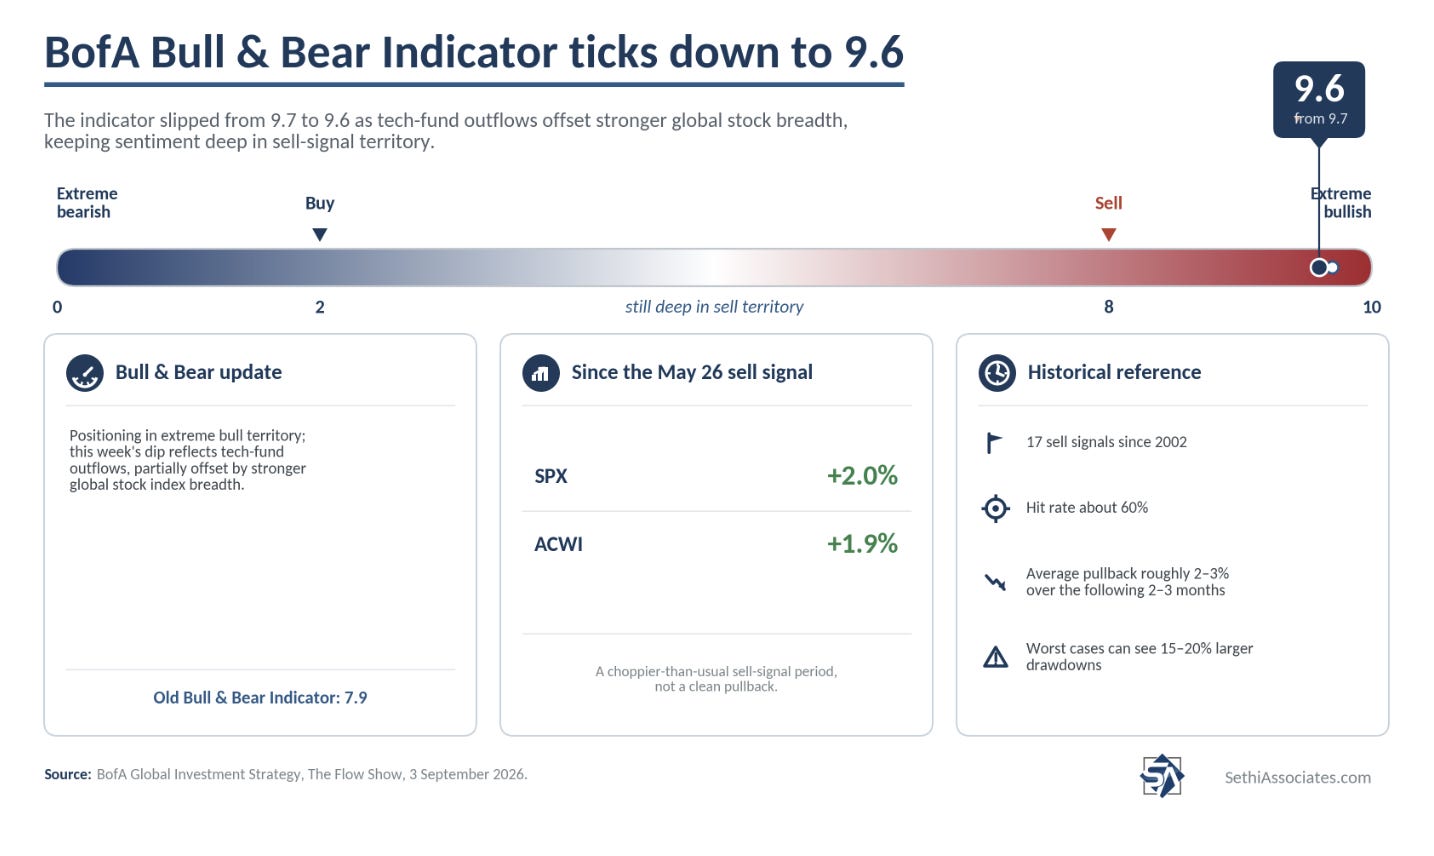
And BofA’s Bull & Bear Indicator eased back another tenth to 9.5 now down two tenths from the joint highest since 2021, still remaining well above its sell signal (8.0) which it crossed back above the week of May 26th:
down to 9.5 from 9.6 on slowing inflow to stocks and healthcare outflow; “sell signal” triggered May 26th; since then, SPX +1.0%, ACWI +1.5%; “old” Bull & Bear Indicator at 7.6
[From prior weeks]:
BofA Bull & Bear “sell signal” remains in place, extreme bull positioning says markets “toppy”, reduce equity exposure, retreat or rotate much smarter summer tactic for risk assets than reload.
17 “sell signals” since ‘02, average loss for global stocks over 2-3 months is 2-3% (hit ratio of ~60%), with max drawdowns of 15-20% (caveats always “tops are a process, lows are a moment”, i.e. greed harder to reverse than fear).
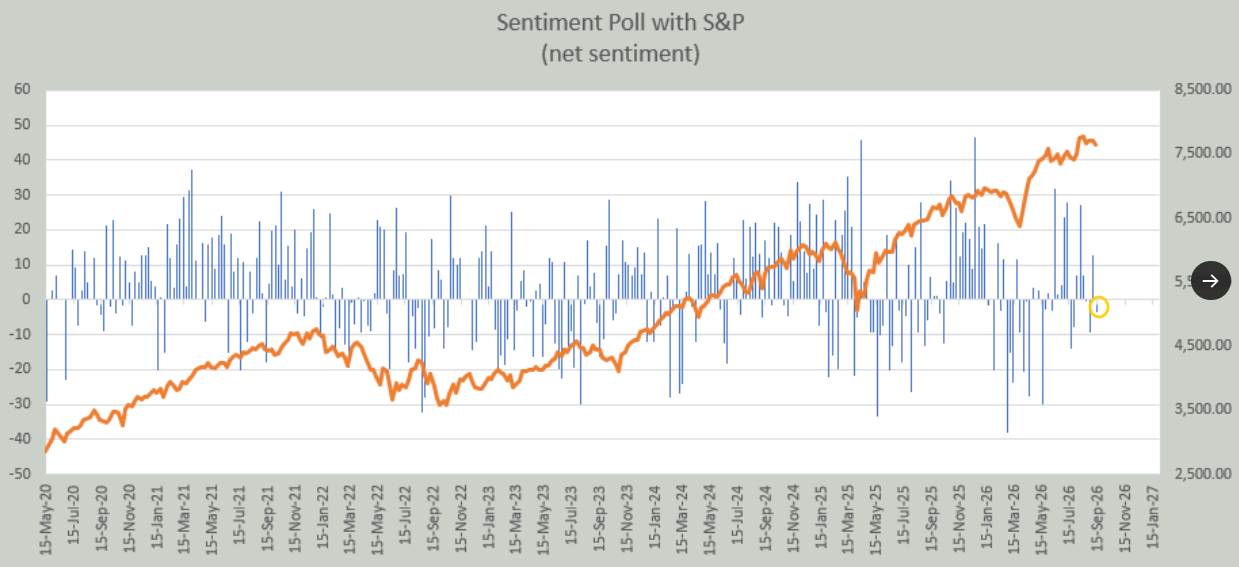
And Helene Meisler’s X followers flipped back to bearish after being the most bullish in a month. It’s the third bearish week in four.
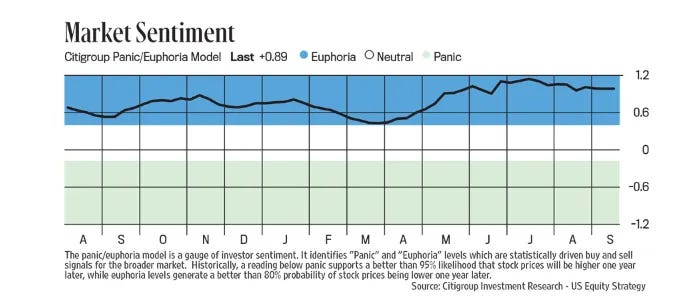
While the Citi panic/euphoria index (which Helene includesin her great weekly Substack) remains squarely in Euphoria just a little off the highs.
As I mentioned last week, it has had a fairly poor track record over the past couple of years:
While the fine print says “[h]istorically…euphoria levels generate a better than 80% probability of stock prices being lower one year later,” it has seen a mixed track since the start of 2024:
-It entered euphoria in late March 2024 (when the SPX was around 5200). We didn’t get to 5200 by the end of March 2025, but we got closer than I would have thought at 5500 (and we did fall under for one day in April 2025).
-The next entry into Euphoria was in late October 2024 w/the SPX around 5800. The closest we got in October 2025 was 6550.
-The most recent entry was in July (2025) w/SPX at 6200. The lowest we got in July 2026 was 7316 (again failing the lower in one-year test). It’s been in Euphoria ever since.
September Seasonality Is Weak, But The Second Half Is Weaker Than The First
For overall September seasonality (and the positive flip in October and November) see last week’s post.
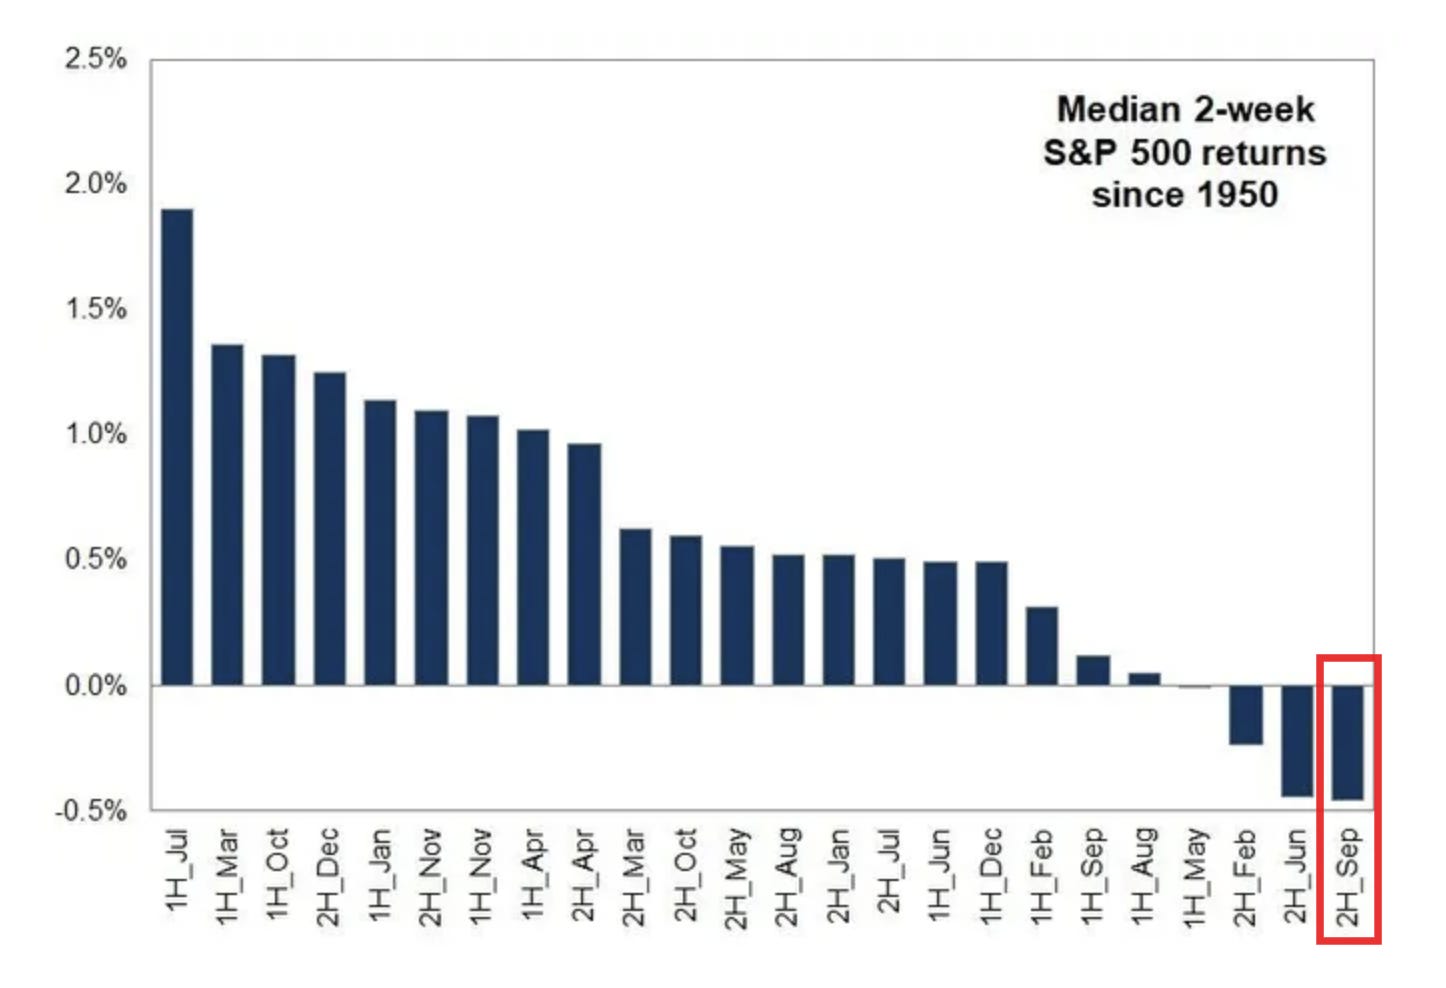
While the first half of September is one of the weaker half-month periods, the second half is the worst half-month with a median loss of around -0.5% since 1950.
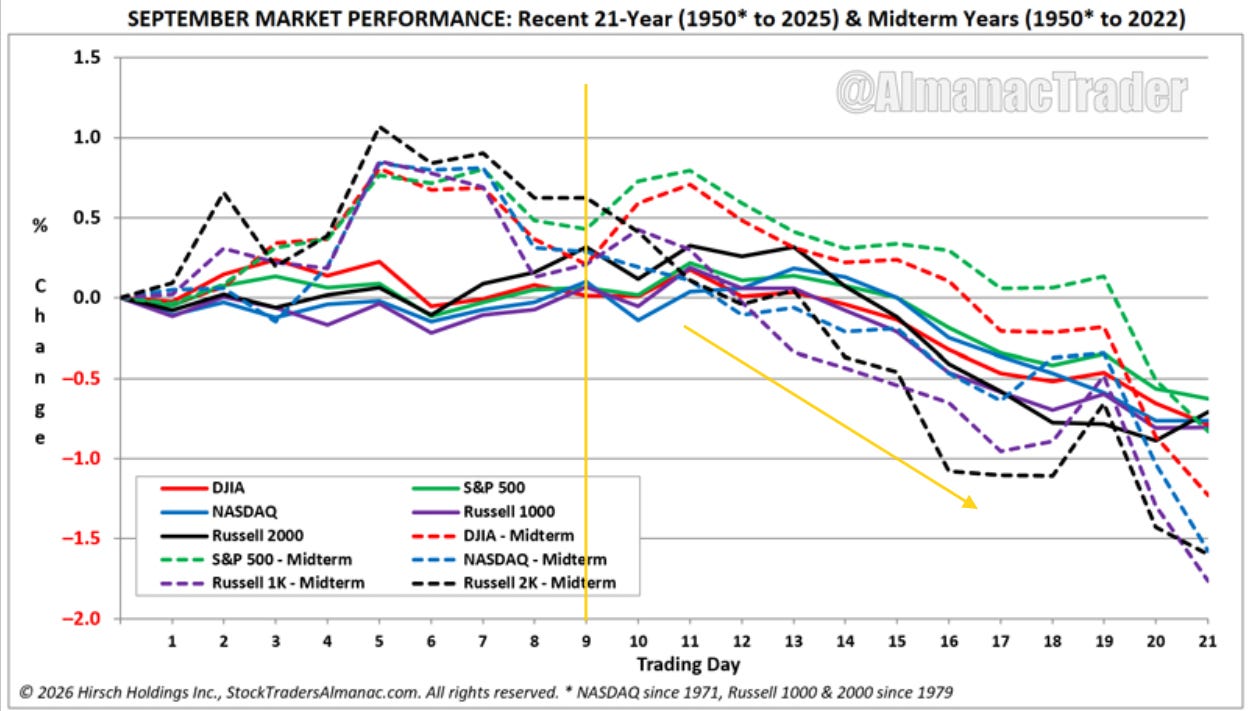
And Jeffrey Hirsch editor of the Stock Trader’s Almanac notes it’s even worse in midterm years:
The chart shows how the major indexes have tended to struggle as the month progresses, with losses accelerating after mid-September. By the end of the month, the “All Years” pattern has declined approximately 0.6% to 0.8% across the major averages.
Midterm-election years show an even more pronounced pattern of weakness late in the month. September starts relatively well in midterm years, with S&P 500 and DJIA outperforming their longer-term patterns through roughly the first 10–12 trading days. However, that strength has faded quickly. By the final week, midterm-year losses steepen dramatically, particularly for Russell 1000 and NASDAQ.
The contrast is especially notable in the final trading days. Midterm-year NASDAQ and Russell 1000 performance falls to around –1.6% and –1.8%, respectively, compared with more modest declines in “All Years.” The historical message is clear: September weakness tends to build as the month progresses, and midterm years have often delivered an especially difficult finish.
A BIG Week For Interest Rates And The Fed
Turning to interest rates and the Fed, I had mentioned last week that
with the hot August employment report, it comes down to the inflation prints this week. For a Fed that has said too many times to count that they don’t want to overemphasize any one data point, the fact that a September rate hike perhaps comes down to whether core CPI prints above or below 0.25% is more than a little strange, but that’s the world we live in.
And as noted earlier with the core CPI print coming in above that 0.25%, along with the unfavorable read-through discussed in the CPI breakdown, markets have now priced a September hike at a near certainty of 90%. As I mentioned in the Friday evening update, “Don’t see how the Fed doesn’t hike next week absent some sort of media tip that they are planning on not going.”
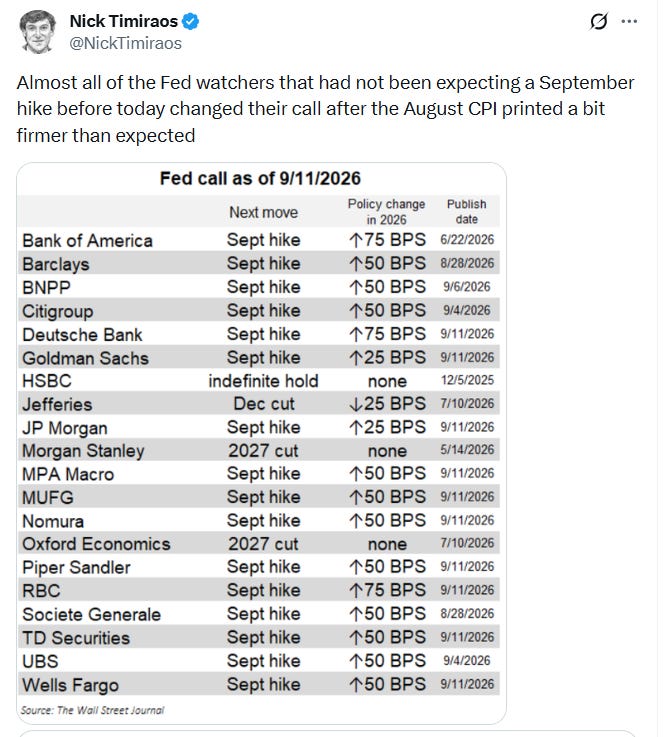
Wall Street agrees with just four of the analysts Nick Timiraos tracks (HSBC, MS, Oxford Economics, and Jefferies) not looking for a hike this year as of Friday (and that might just be a timing thing with Nick’s analysis as of Friday, and I haven’t seen new notes from any of those since then).
A notable one is Citi who went from three cuts to two hikes, quite the change. Here was Goldman on their change to one hike:
While today’s CPI report did not change our fundamental inflation view, we think that the FOMC will be reluctant to surprise a market now pricing a nearly 90% chance of a hike.
Additional hikes at later meetings are possible but are not our baseline. We suspect that a majority of FOMC participants would prefer not to hike again at the October meeting, both because it comes just before the midterms and because those participants skeptical of the case for hiking would likely prefer that it at least be limited to a more gradual pace.
By December, we think that further evidence of improvement in the inflation trend and greater distance from some of the key drivers of higher inflation, especially tariffs and the Iran war, will make another hike seem unnecessary.
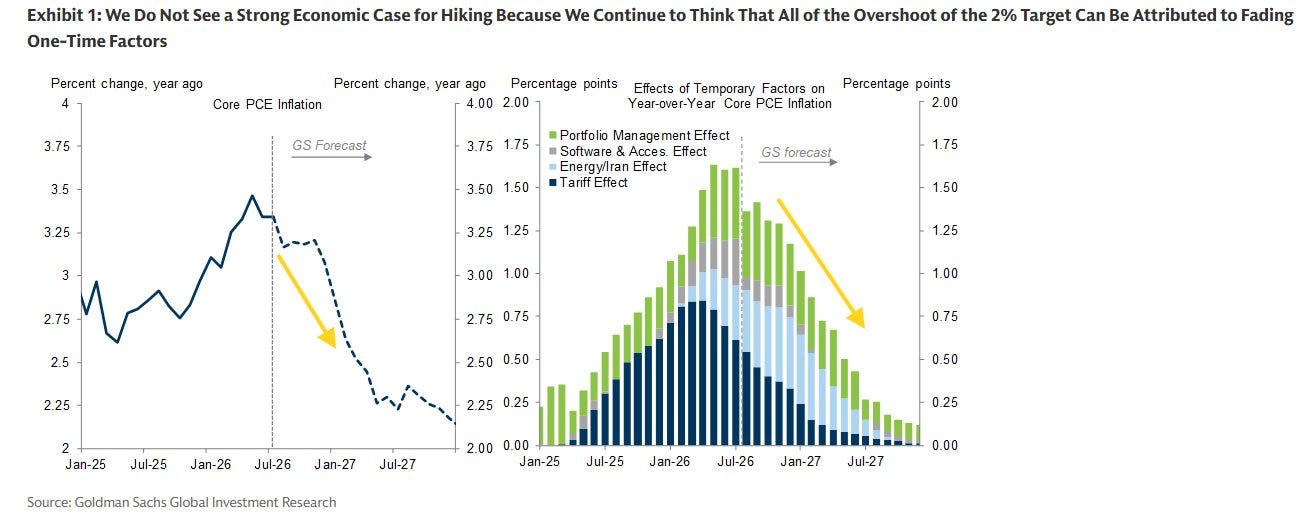
We do not see a strong economic case for raising the funds rate. We continue to think that all of the overshoot of the 2% target can be attributed to one-time factors whose impact is likely to fade, and that the improvement in core PCE inflation over the last three months is an early sign of this.
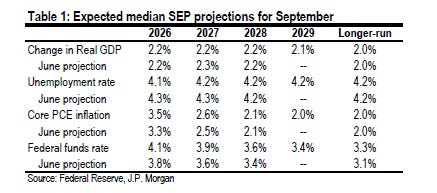
And JPM’s Michael Feroli who interestingly like Goldman is looking for the SEP to show rate cuts starting next year (not what the market is pricing):
Given Chair Warsh’s strongly worded remarks at Jackson Hole that the Fed’s “predominant focus right now” should be on restraining elevated inflation, we expect the FOMC to broadly support a decision to hike, with no dovish dissents—although the outcome could be a closer call than markets are pricing. At this stage, failing to back up words with action could put the institution’s credibility at risk.
Assuming Chair Warsh again avoids providing meaningful forward guidance during his press conference, and the statement language sees no material changes, markets will look to the updated dot plot for clues on the likely policy path.
We expect the median dot to point to a 4.00% to 4.25% year-end target range, implying one additional hike in 2026 after next week’s expected move. We then expect the median dot to decline by 25bp per year from 2027 through 2029, gradually moving toward an upwardly revised median longer-run dot of 3.25%.
The updated economic projections are likely to show slightly higher inflation and lower unemployment over the next year or two.
So absent a shock hold, as mentioned at the top, attention will quickly turn to the updated Summary of Economic Projections (SEP), which will have a new dot plot that will tell us a lot about the Fed’s thinking about the path of policy going forward based on where the dots are aligned for 2026 (and to some extent 2027 and 2028 but those will be less useful given the Fed’s horrendous forecasting record).
Do the hawks convince the doves that more than one hike is needed this year as the base case? Does Warsh care enough about the SEP (which he didn’t even submit a dot for in July) to jawbone members into a no further hikes median dot (given I’d imagine he doesn’t really want to hike again given what will likely be very uncomfortable public pressure from the administration)? A lot of questions around where that median dot lands. And we’ll also get updates to expectations on inflation, unemployment, and GDP.
Here are BofA’s thoughts:
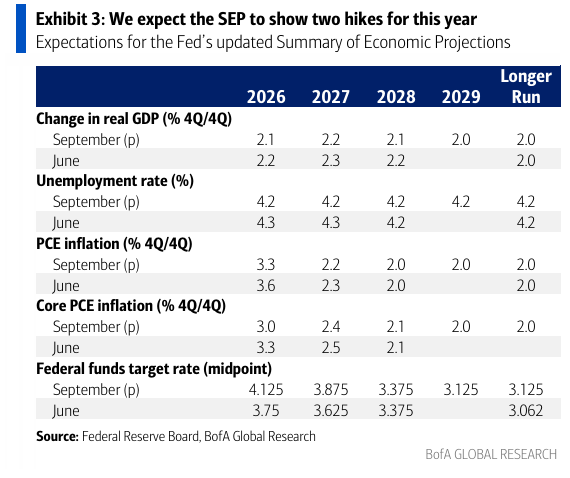
Assuming the Fed raises rates in September, we expect the 2026 median dot to show 50bp of hikes this year, implying another rate increase in Oct/Dec. We think the 2027 median will show one cut (3.875%). Recall that the dots reflect the expected policy rate at year-end. It would be reasonable for the Fed to pencil in a cut at some stage next year, since many policymakers will likely assume that higher rates will help quell inflation.
One outstanding question is whether the Fed will incorporate the PCE methodology changes scheduled for September 30 into its projections. We think it will, although our conviction is low as it may be easier to reflect those changes ex-post. If the revisions are incorporated, we would expect both the headline and core inflation projections for 2026 to be marked down by roughly 30bp.
Beyond this year, we expect the Fed to lower its growth forecasts by 0.1pp, to 2.2% in 2027 and 2.1% in 2028, reflecting the somewhat higher expected rate path over this year and next.We also expect the headline and core inflation projections for 2027 to be revised down by 0.1pp. The u-rate, however, is already two-tenths below the median projections for the end of this year and next. So we expect those medians to move down as a mark-to-market, despite the higher policy trajectory.
In summary, aside from changes to the policy path and the potential inflation revisions stemming from the PCE methodology update, the adjustments to the SEP should be relatively modest.
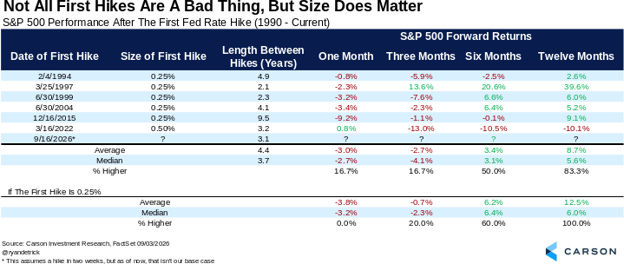
And if we do get that Fed hike, history would say to watch for equity weakness:
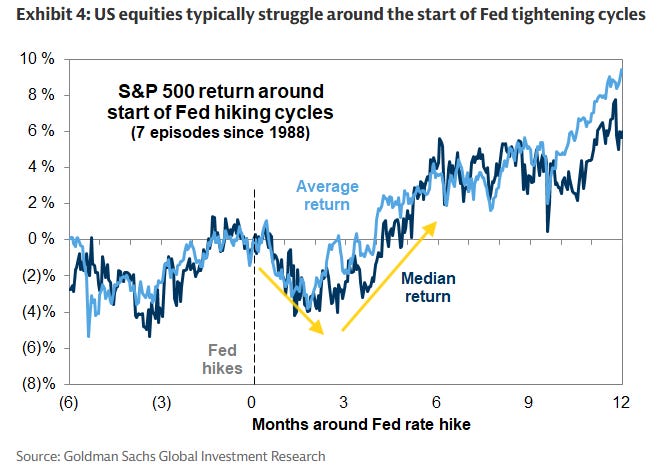
Goldman: Equities typically struggle at the start of Fed hiking cycles, but the market has already priced substantial Fed tightening in coming months.
The S&P 500 has generated an average 3-month return of -2% at the start of seven hiking cycles during the last few decades. However, the S&P 500 then generated an average 12-month return of +9%, with positive returns in every episode but 2022. In 1997, for example, the S&P 500 declined by 10% alongside the Fed’s 25 bp hiking “cycle.”
Stocks bottomed when the market ceased pricing additional tightening, and the S&P 500 reached new highs within three months. Today, the rates market is already pricing more than three 25 bp hikes by the middle of 2027, lifting the bar for policy to surprise in a hawkish direction. The medium-term impact of Fed tightening on equities will depend on how tightening affects earnings growth, which is the most important driver of stocks.
And from Carson Research:
Five recent hiking cycles started with 0.25%. Stocks were lower a month later all five times. A year later, they were higher all five times, up 12.5% on average.
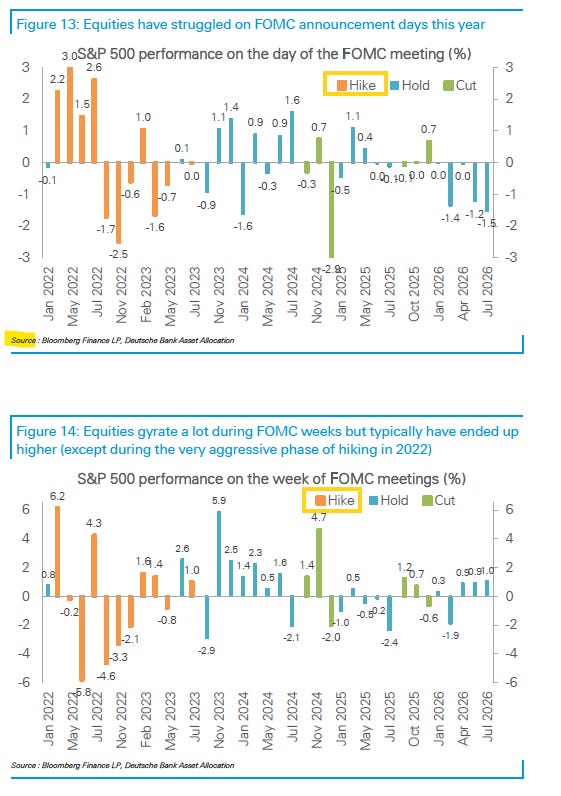
DB takes an even more granular look and finds that while volatile, recent FOMC meeting weeks have been net positive for equities, but much depends on the pace of tightening:
Recent FOMC meetings have produced equity-market whipsaws, but equities have ended higher for the week on average. This year, the pattern has been for stocks to rally modestly in the two days before the decision, with a median year-to-date gain of 0.9%, then sell off on the day of the announcement, with a median decline of 1.2%, before recovering to finish the week higher by 0.9% on average.
The last hiking cycle told a tale of two halves. In the first phase, during 2022, equities sold off sharply in nearly every FOMC week. However, as we noted at the time, the key issue for equities was not rate hikes themselves or the higher level of rates. Rather, it was the volatility caused by frequent shifts in Fed guidance and the rapid pace of tightening.
Once the Fed shifted to a more gradual and measured pace of hiking, vol subsided and equities rallied hard during subsequent FOMC weeks.
In that respect, I should note that Warsh did not do a stellar job at the July FOMC press conference. In fairness, this is not atypical of new Fed chairs (Powell certainly had his challenges at one point catalyzing a near bear market in stocks with his statement that QT was “on automatic pilot” in December 2018). Hopefully Warsh can find his footing, because it’s not only stock but bond markets that are also on “fragile” footing at this point.
It is not the easiest setup. As BofA notes
Chair Warsh will almost certainly field questions about the policy path going forward. In responding to these questions, he will face a delicate balancing act. If he asserts that the Sep hike (if it happens) was the first in a sequence of rate increases, markets might quickly price in over 100bp of hikes, as they did with the ECB. But if he attempts to pull off a “dovish hike” by reassuring markets that the Fed will proceed cautiously, markets might once again question the Fed’s commitment to the 2% inflation target. … More broadly, we’re curious whether Warsh will retain the tweaks he made to his communication style at Jackson Hole. We found that speech to be more transparent about his outlook and, as mentioned above, his reaction function. In our view, greater transparency decreases the risk of miscommunication. Even without forward guidance. But if Warsh wants to revert to his prior stance of avoiding substantive discussions about the economic outlook and the stance of policy, we think he’d be better off fielding far fewer questions at the press conference.
Turning to rates, as I mentioned Friday, despite markets now pricing in a September hike (and nearly three more over the next year), long maturity yields (10 and 30 years) recovered their early losses to trade roughly flat on the day. As I said “it appears that the bond vigilantes perhaps want more than a single rate hike before they will pull in their horns.” I’m not sure that Chair Warsh is ready to deliver that (although the rest of the FOMC might, we’ll see)
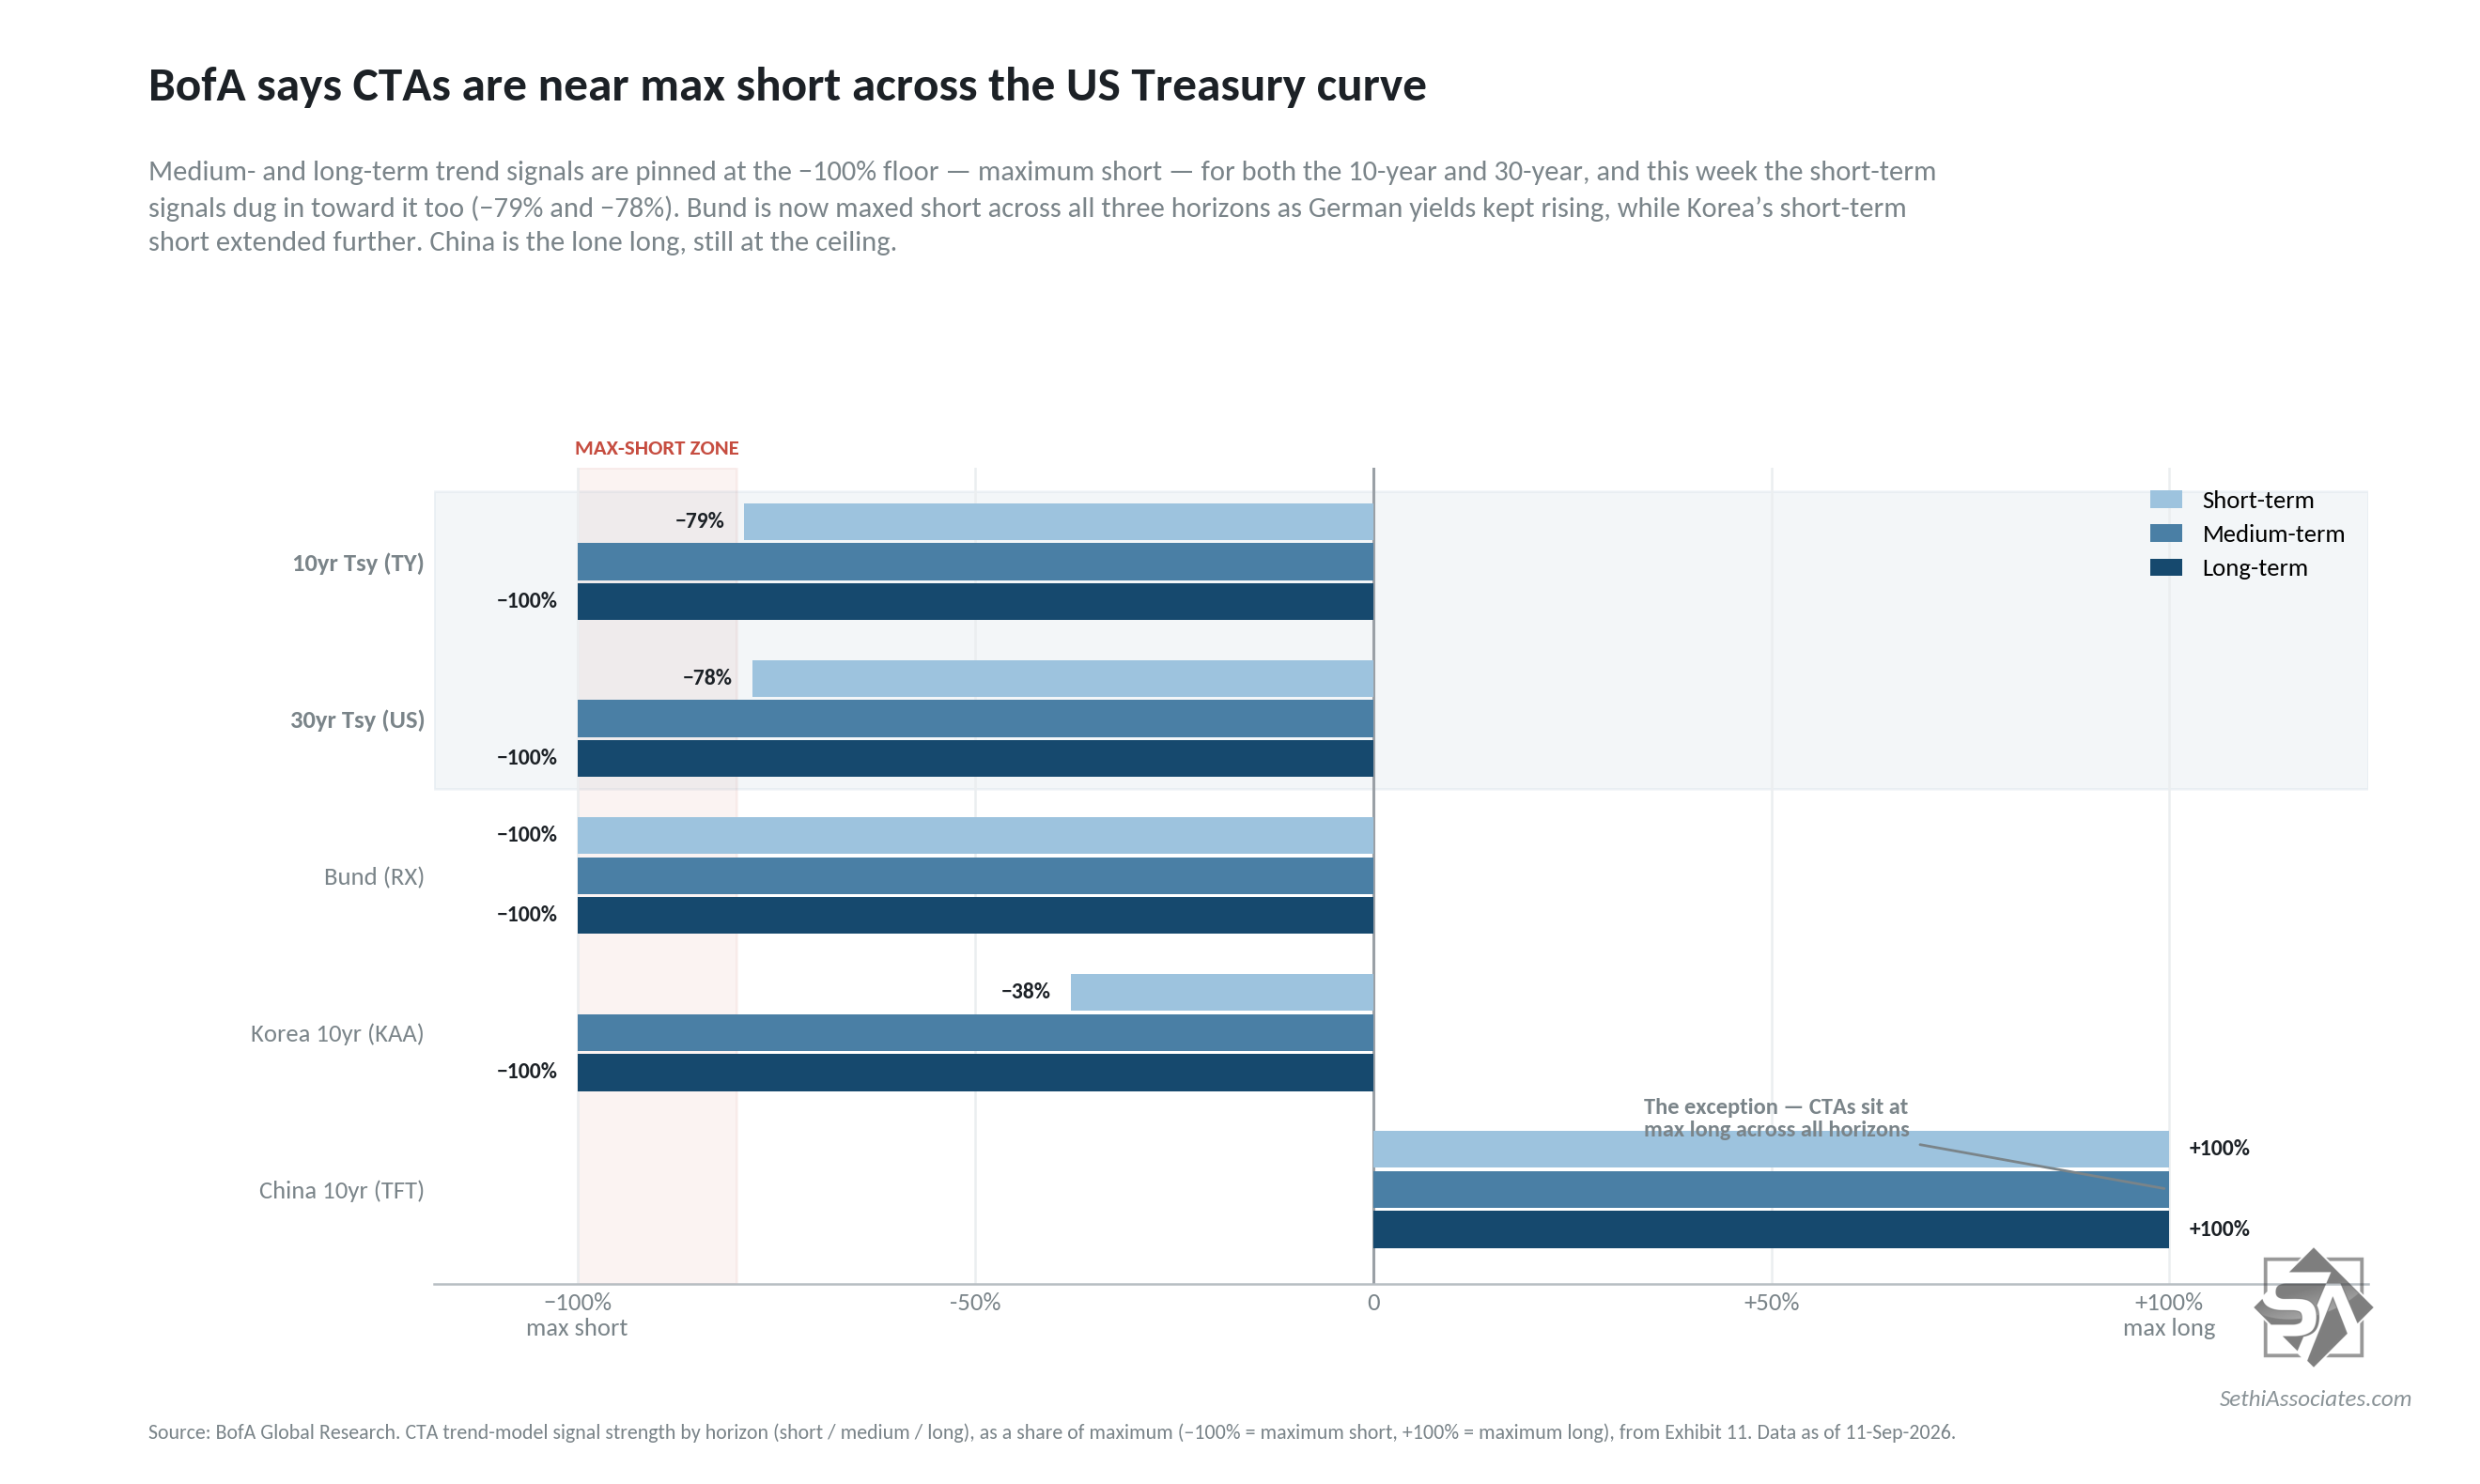
Turning back to rates, not helping (for now) on that front is positioning with the drop in bonds (increase in yields) keeping CTAs at nearly max long Treasuries. At some point this will unwind in a vicious short covering rally, but for now cover triggers remain distant.
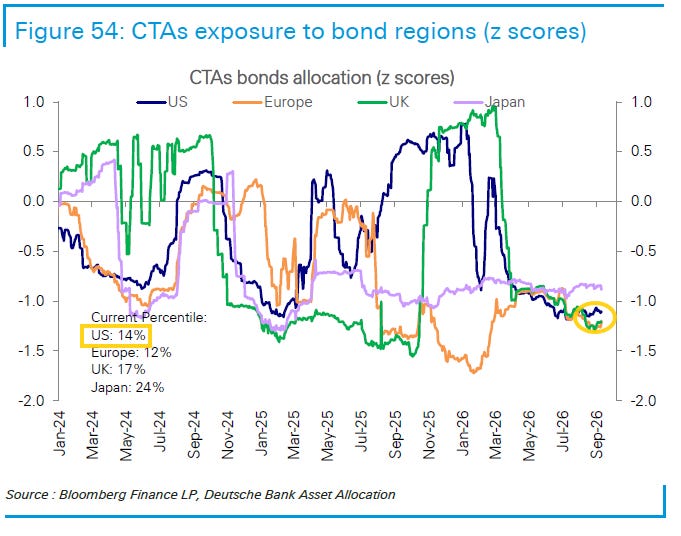
DB similarly says CTA “bond shorts remain extreme” at just the 14th percentile to 2012 for the US.
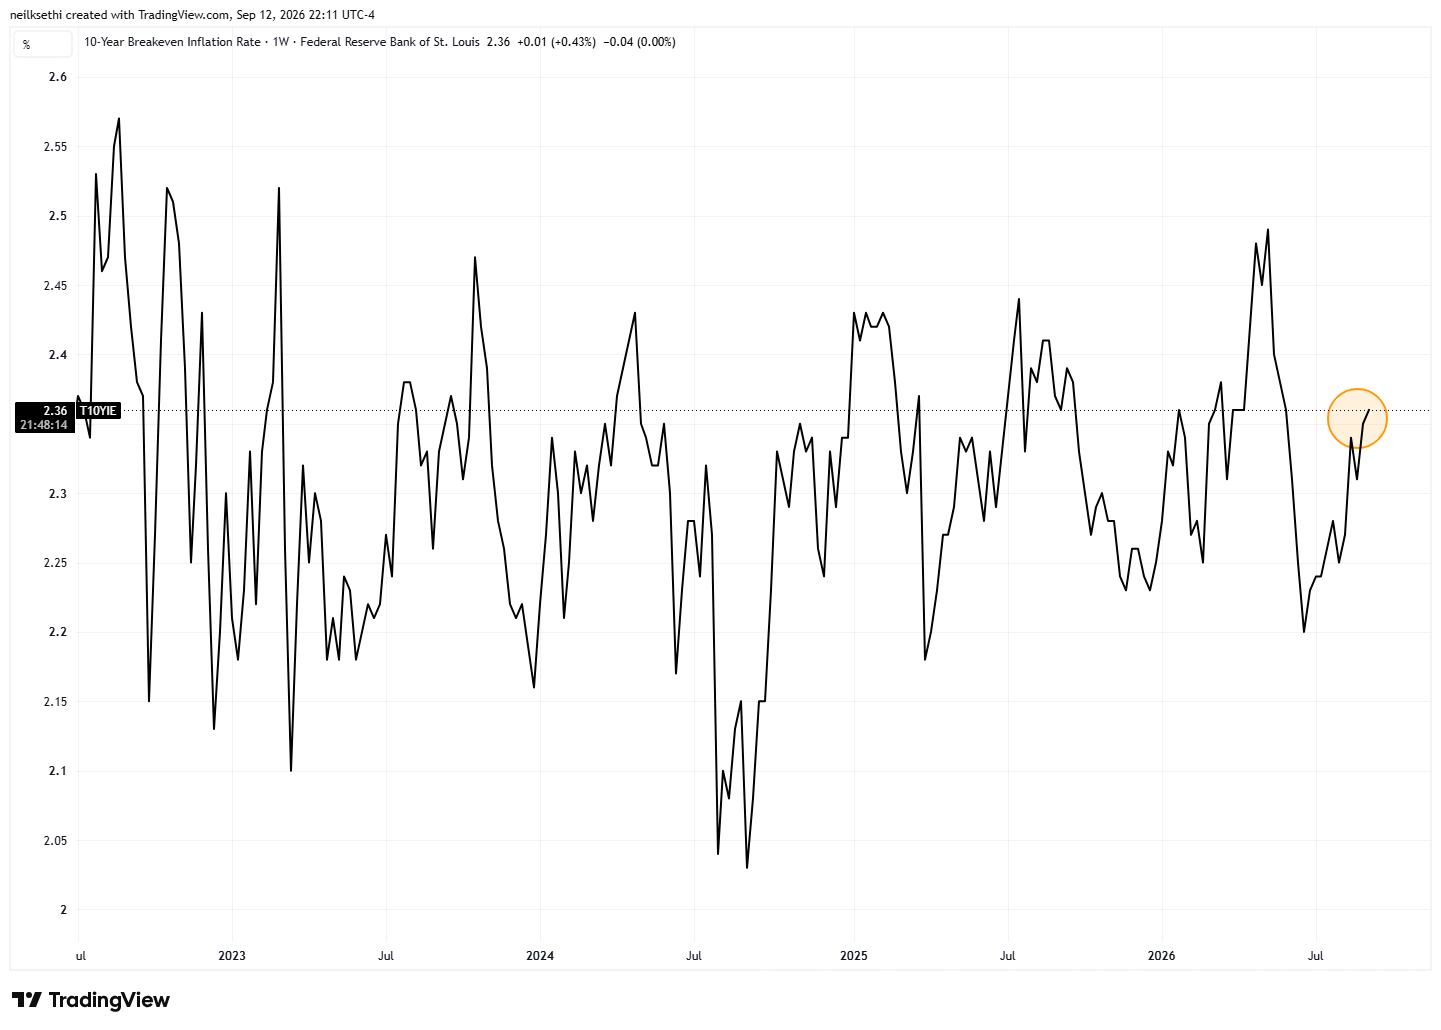
And while they remain well off the highs from May, 10-year inflation expectations have been steadily drifting higher.
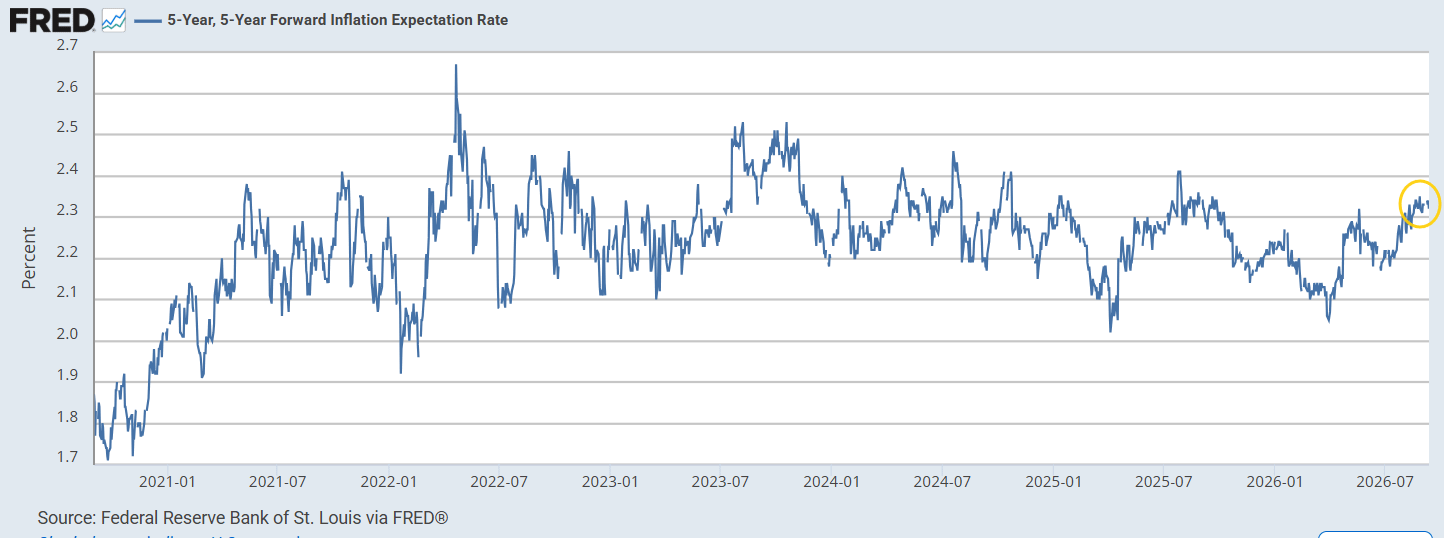
And the Fed favorite5-year, 5-year forward rate(expected inflation starting in 5 years over the following 5 years) remains around the highest in a year. Still neither are particularly problematic.
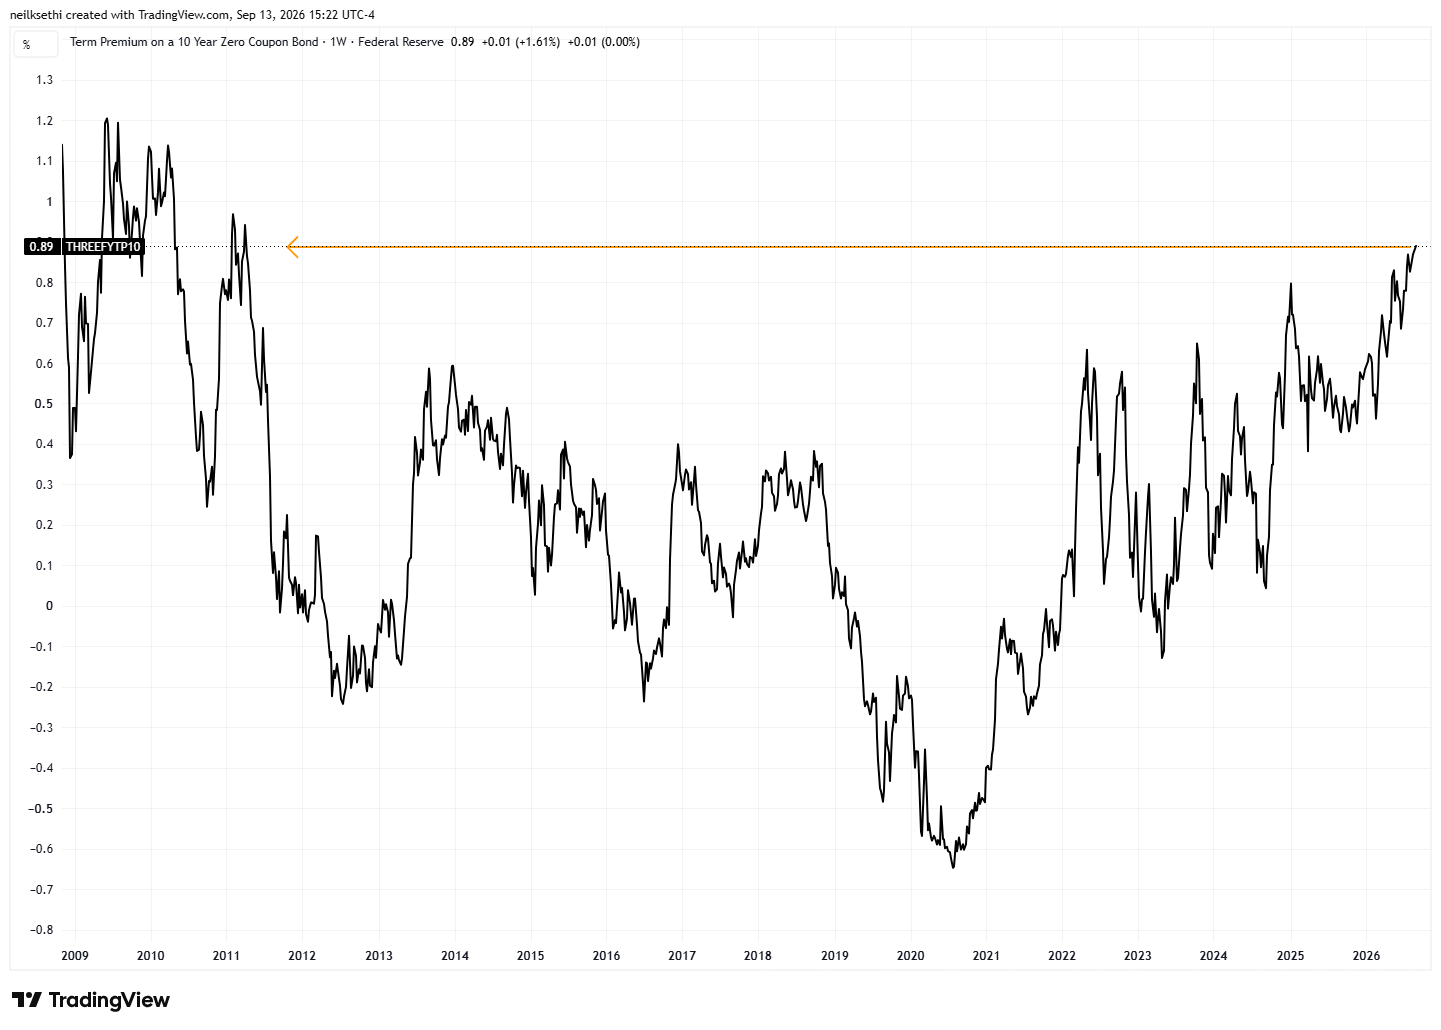
Which leaves term premium (extra yield investors demand to hold a longer-term bond instead of continually rolling over short-term bonds for the same period) as a source of pressure with the Kim-Wright model for the 10-year now the highest since 2011.
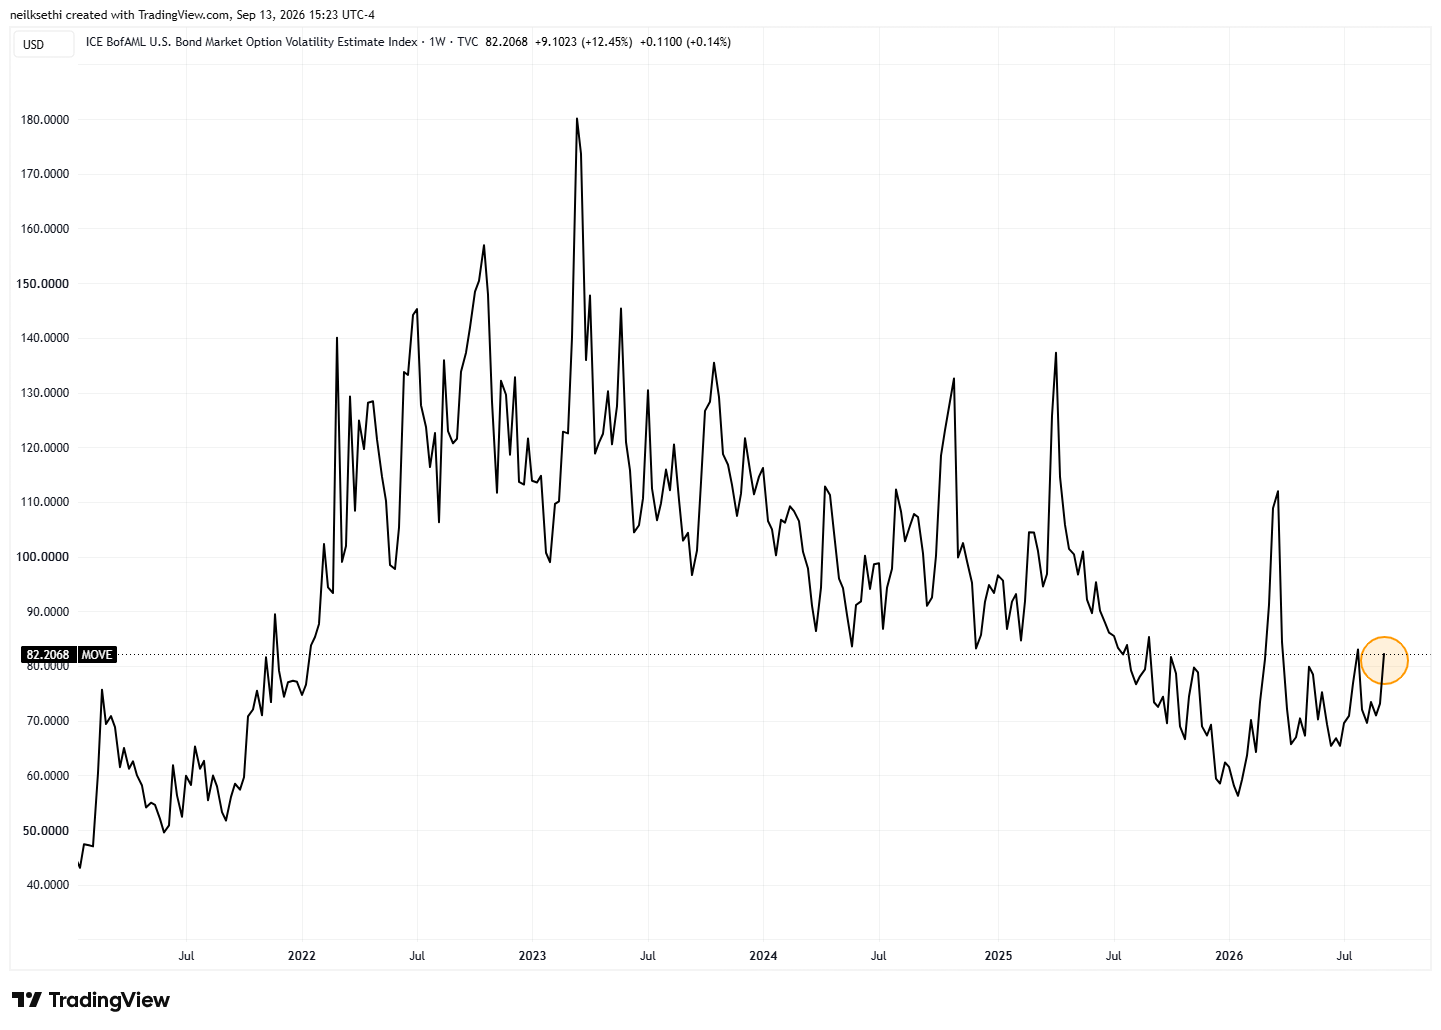
And while it’s well off the highs of the year, we did see the MOVE index of expected 30-day Treasury volatility rise to the highest since July.
Overall, on yields, for now we remain in my new ranges established at the start of August but we’re at the very top for the 10-year: “I still think that 5% on the 10-year and 5.75% on the 30-year represent areas where we will see very strong buying. On the 2-year I think a lot depends on whether the Fed hikes. If they do, there’s potentially another ~30 basis points to the upside (~4.75%). If they don’t, I think we’re going lower from here.” I did pick up a little across the curve last week, but I am leaving plenty of dry powder as this obviously could have more to go.
I mentioned earlier this week that the last time yields saw 5% it catalyzed a 6% pullback in the SPX.
DB though thinks we may be near a top:
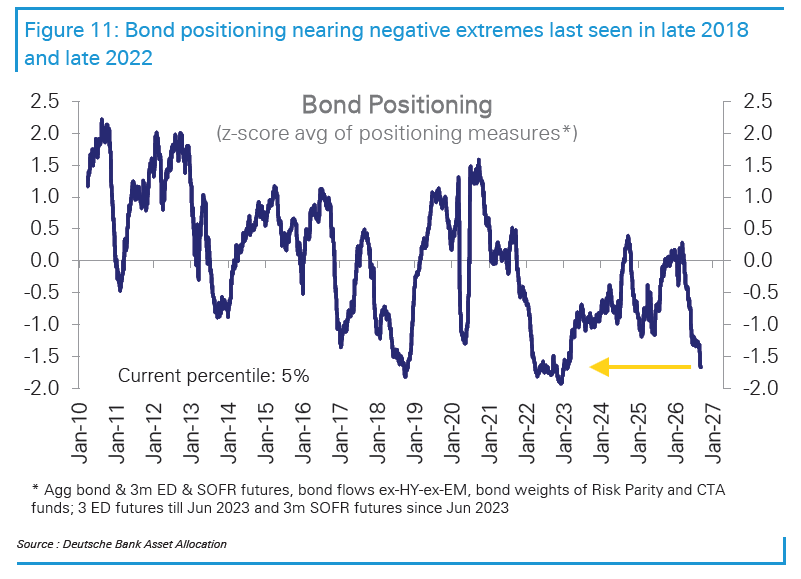
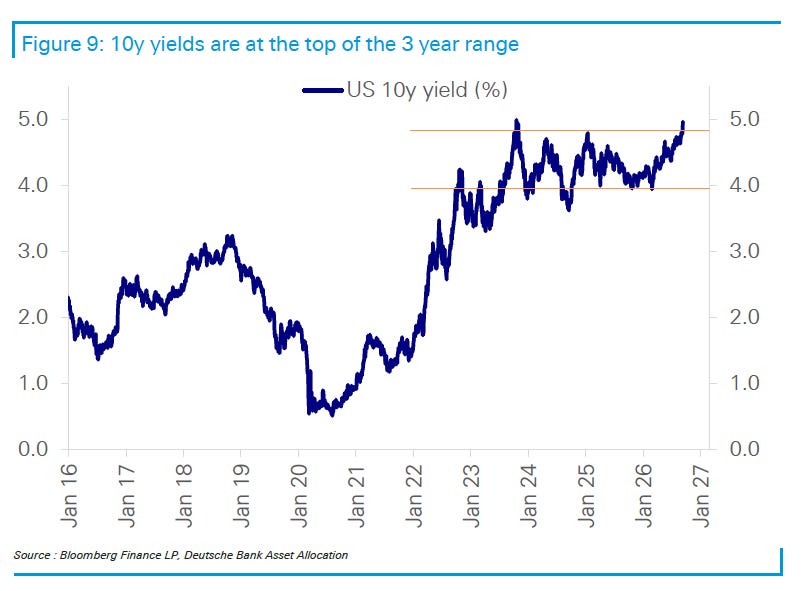
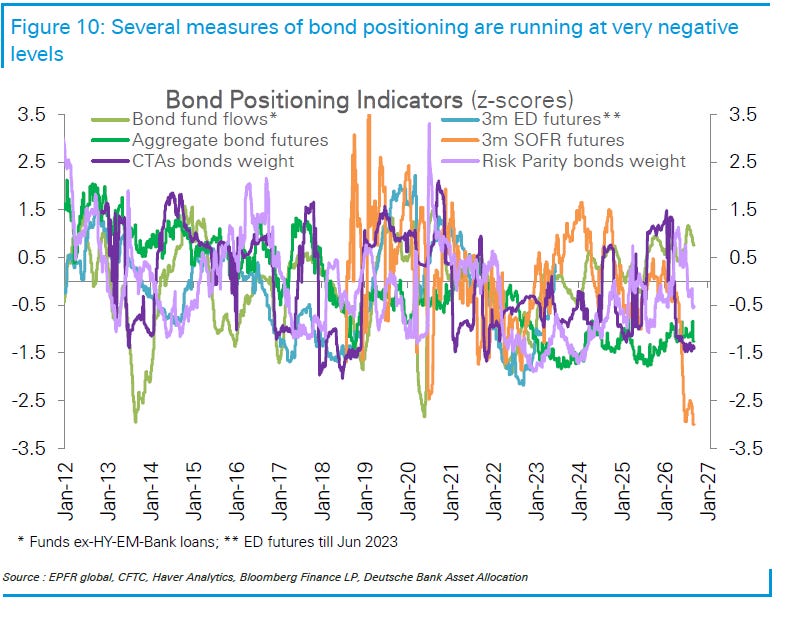
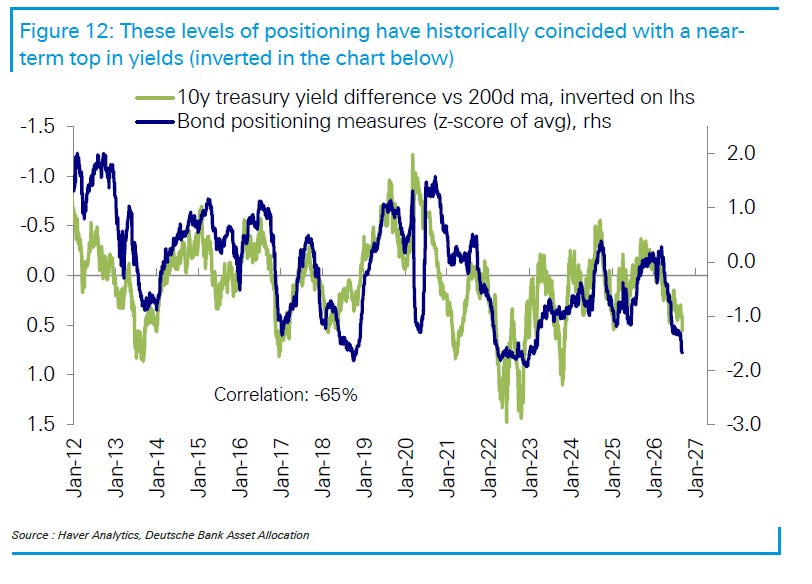
Bond positioning is nearing negative extremes that have historically coincided with a near-term peak in yields. With the 10-year Treasury yield now close to 5% and at the top of its three-year range, bond positioning across a range of measures is near the 5th percentile—levels last seen in late 2018 and late 2022.
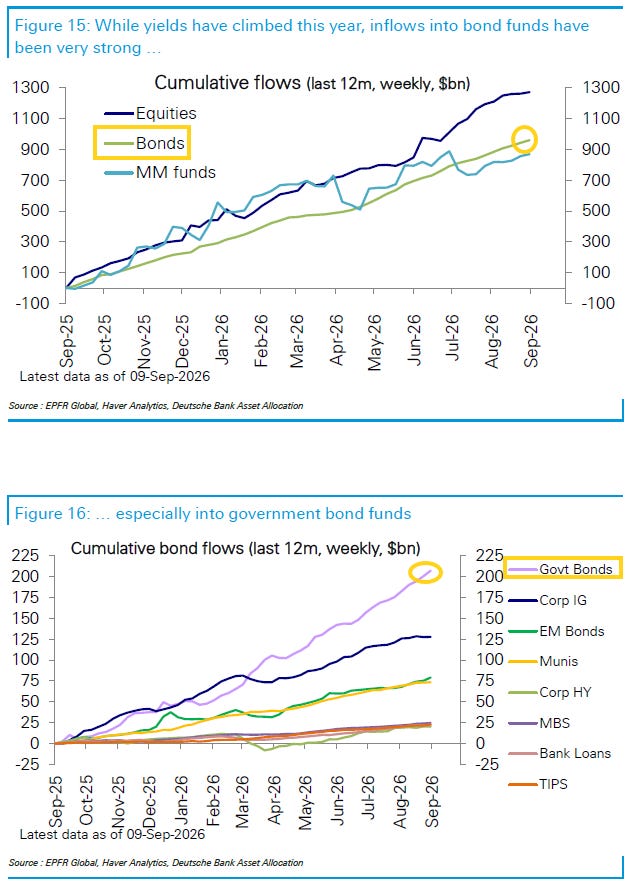
Historically, positioning at these levels has coincided with a near-term top in yields, if not an outright bond-market rally. We also note that, while yields have been rising since March, inflows into bond funds have remained very strong, particularly into government-bond funds.
I should note in terms of demand we saw that in the auctions this week with perhaps the second strongest 30-year auction on record along with a very solid 10-year auction.
While Goldman was out with their own note this weekend on equities and interest rates reminding that rapid moves higher in yields have historically been met with equity weakness.
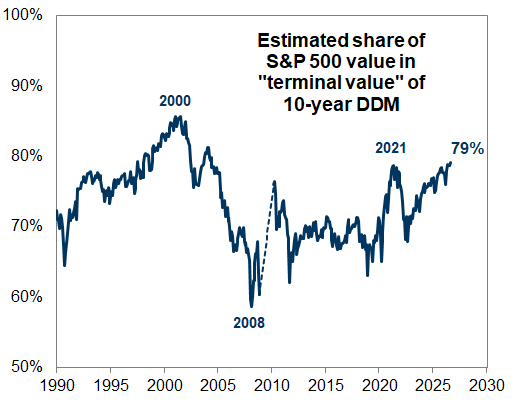
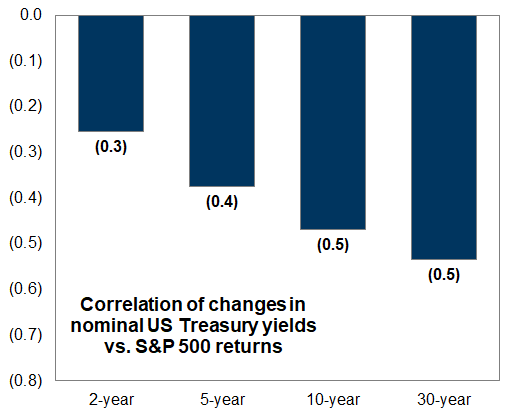
Equities are usually more sensitive to long-term interest rates than short-term rates. One way to frame the value of an equity is as a discounted stream of long-term future cash flows. Our dividend discount model shows that roughly 75% of the present value of the S&P 500 reflects cash flows 10+ years in the future. Mirroring the long-term nature of equity cash flows, the correlation of S&P 500 returns with changes in interest rates is strongest for long-term bonds. Because inflation boosts the nominal values of future cash flows, equity valuations are more vulnerable to rising real rates than to nominal rates.
Exhibit 6: “Terminal value” represents roughly 80% of S&P 500 equity value today
We estimate the present value of earnings, dividends, and net buybacks for 10 years and assume the remainder of equity value is in the \”terminal value.\”
Source: Goldman Sachs Global Investment Research
Exhibit 7: Equity returns are generally most correlated with changes in long-term interest rates
monthly changes since 2023
Source: Goldman Sachs Global Investment Research
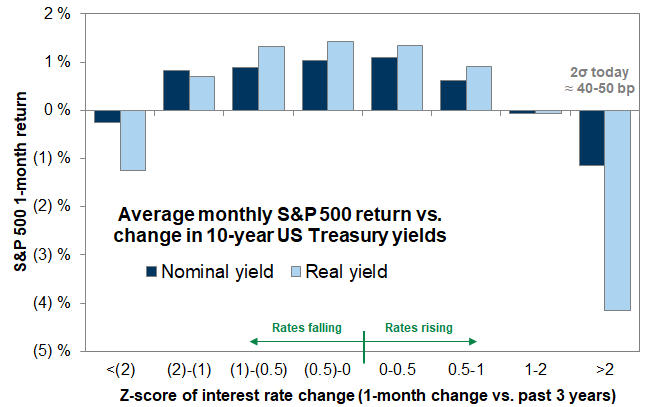
In addition to the level of bond yields, interest rate volatility matters for equities. Stocks typically struggle to digest sharp increases in bond yields. During the past few decades, stocks have usually generated positive returns alongside rising interest rates unless the pace of rising rates exceeded 2+ standard deviations. Today, a 2 standard deviation move in 10-year Treasury yields would equate to about 50 bp over a month or 30 bp over two weeks. The speed of the rate moves during the last few weeks helps explain why stocks struggled to digest those changes.
Exhibit 8: Equities typically struggle to digest sharp increases in bond yields
Source: Goldman Sachs Global Investment Research
But they note that today balance sheets are less sensitive to rising rates and companies can offset rising rates by faster growth.
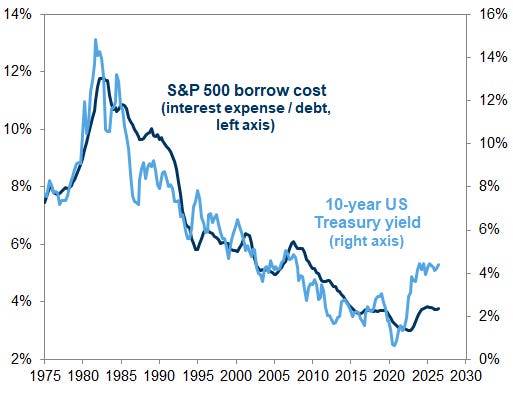
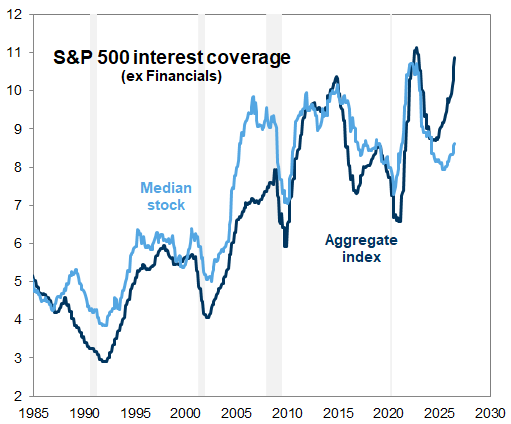
Corporate balance sheets today face limited fundamental risk from rising interest rates. Interest rates can affect corporate earnings and solvency in addition to equity valuations, but those risks appear limited today. S&P 500 borrow costs have increased modestly during the last few years alongside higher bond yields. However, the increase has been modest because most S&P 500 company debt carries fixed rates and long maturities. In addition, interest expenses remain small relative to strong profits. Interest coverage ratios for the aggregate S&P 500 and its median stock rank in the 99th and 68th percentiles relative to the past 20 years. Smaller companies generally have weaker balance sheets and higher shares of floating rate debt, making them more vulnerable.
Exhibit 9: Interest expense increase has been manageable
Source: Compustat, Goldman Sachs Global Investment Research
Exhibit 10: Interest coverage ratios are historically high
aggregate excludes “other income” for GOOGL, AMZN, MSFT in recent quarters
Source: Compustat, Goldman Sachs Global Investment Research
The incentive to spur growth in the face of rising interest rates is one of many factors supporting the ongoing boom in AI investment. One way to boost growth is through investments in capex and R&D. This past earnings season, roughly half of S&P 500 companies discussed adopting AI in their businesses to boost productivity. Other companies will use AI to generate new streams of revenue.
The ongoing acceleration in M&A activity highlights another avenue for companies to improve growth.
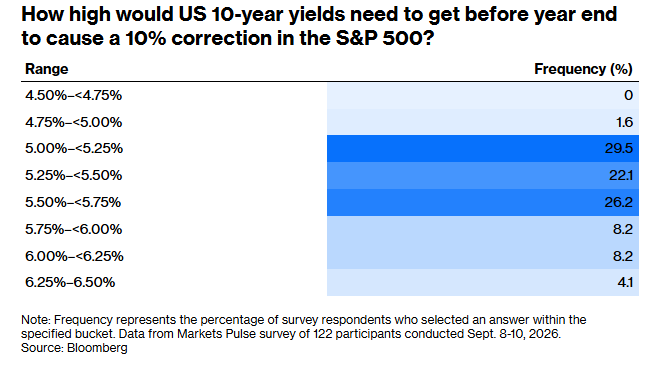
And FWIW BBG did a survey and of the 122 respondents the majority think a 10-year at 5.5% causes a 10% correction.
Wrap-Up – A “Fragile” Situation With Increasing Risks
I enter this week with my caution levels at the highest since late July.
Last week I mentioned Citadel’s highly regarded Scott Rubner gave a detailed look at why he’s looking for a September pullback:
And I also mentioned last week, “perhaps my largest concern is with systematic positioning which is by any measure overweight and by some measures quite extended, leaving that positioning vulnerable”.
And as BofA noted this week that systematic positioning has become “fragile” with sell triggers not far. Add to that:
-negative gamma (meaning market makers are destabilizing, particularly on any moves to the downside), -a Fed chair that so far has proven to be a bit of a wildcard, a poor history for equities following both Fed rate hikes as well as sharp upward moves in longer-term interest rates as well as the 10-year hitting 5%, -tightening financial conditions, -increasingly weak breadth, -increasingly poor seasonality, and -an increasingly unfavorable macro picture of increasingly tight oil and products markets, rising food prices, rising interest rates, sticky inflation, new tariffs, and a growing AI backlash threatening that key economic boost.
Against that I mentioned last week a long list of reasons to be bullish.
The economy continues to look resilient, if uneven, with GDP trackers still pointing to solid growth. Earnings have been extraordinary, and while expectations are for growth to slow, it holds at double-digit levels through 2027. Valuations have continued to ease. Positioning is not uniformly stretched — on the discretionary side in particular there is plenty of room to move higher. And outside of BofA’s Bull & Bear Index (which hasn’t been much use since it was reformulated in December), sentiment sits just moderately bullish to neutral [with some now drifting to bearish], … buybacks are back in full force; and retail continues to keep allocations high.
Unfortunately outside of buybacks and perhaps the oversold conditions noted earlier none of those argue for buying next week per se, so as I said last week “a material pullback would not surprise me.” I added then that “there’s no reason to make that our base case,” and I still think that, but I also think the odds have been raised substantially to make it at least as likely as an equity rally.
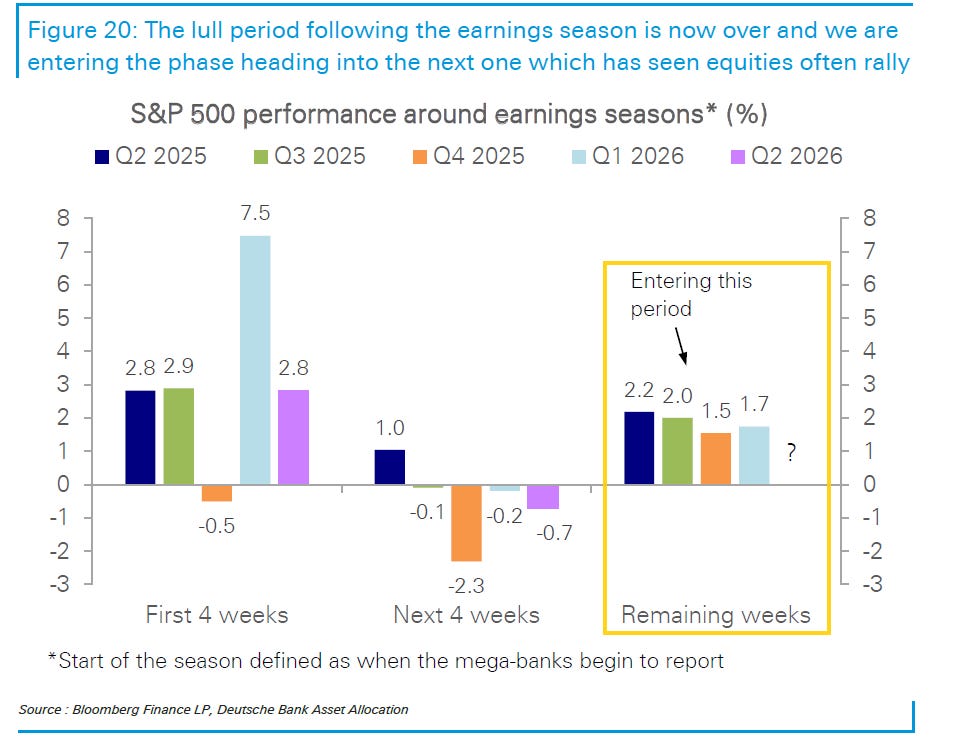
But in some better news, if you recall in prior weeks I noted a “lull” period DB had identified following the end of recent earnings seasons. Well, they say we should now be exiting that:
As we noted last month, the S&P 500 has rallied by about 3% on average during earnings seasons in recent quarters. However, once the bulk of companies have reported in the first four weeks, the following four weeks have typically seen a lull of around 0.5%, as investor focus shifts from exceptionally strong earnings growth to questions about its sustainability.
The past four weeks following the most recent earnings season have been no different, with equities trading in a tight range. However, we are now exiting that post-earnings-season lull period.
The period leading into the next earnings season has, in recent quarters, produced an average equity-market rally of about 2%, as attention shifts back to corporate guidance, which has been extremely robust.The question is whether that pattern repeats through September.
Equities have already absorbed a range of negative catalysts in recent weeks. In the absence of additional negative shocks, this could create an opening for equities to rally as robust earnings return to focus—before midterm-election noise intensifies.
So while things this week are very much touch-and-go, there’s more than a little reason to be ready for a rally if we can navigate the week positively, particularly in the event the FOMC (or something else) serves as a catalyst for a pullback in yields.
Citadel's Rubner looks for "tactical reset" in September:
"I have remained constructive through the summer, and much of that view has played out. Earnings were exceptional. The July reset cleaned up leverage and positioning. Retail returned. Volatility collapsed. SystematicShow more
The August NFIB small business index cooled 1.1 points from the highest since August 2025 in July, but held above its 52-year average of 98.0.
Sales and the economic outlook led the pullback:
▪️ Expect better business conditions: net 10% (-5), still above the net 4% average
▪️Show more
With the 10-year yield approaching 5%, a reminder that the last time we touched those levels (October 2023) we got a quick 6% pullback saved by Janet Yellen's November 2023 Treasury refunding announcement.
Oil and Yields Drive Equity Losses for a Fourth Session
Another leg higher in oil, on top of a firm inflation backdrop, lifted Treasury yields to multi-year highs, hardening Fed rate-hike bets into next week’s meeting, and driving a fourth straight day of equity losses.