A Close Look at 2 Key Consumer Reports
Let’s break down the latest consumer credit report and the important New York Fed Survey of Consumer Expectations.
You've reached your free article limit
You've read 0 of 1 free Pro articles.

We got a couple of consumer reports Tuesday that are worth diving into.
Consumer Credit Jumps in July on Surge in Non-Revolving Debt
Let’s start with the consumer credit report.
US Consumer Credit (USD) Jul: $18.06 billion (est $11.34 billion; prev $14.17 billion; prev R $14.56 billion)
As a reminder this report captures balances outstanding as of a point in time and is not necessarily a reflection of interest-bearing debt — a meaningful share of revolving (credit card) balances gets paid off within the grace period each cycle before any interest accrues, so the outstanding figure should be taken in that context. Also this does not include mortgage debt.
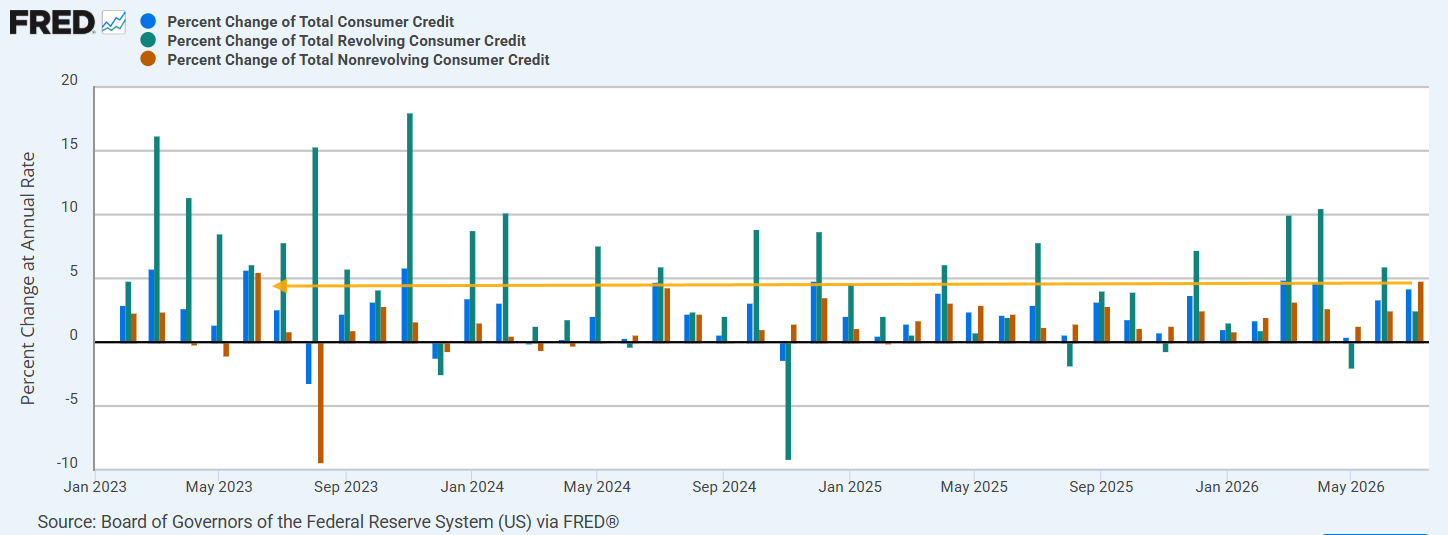
The consumer credit report from the Federal Reserve for July saw a much larger-than-expected $18.06 billion increase (+4.19% SAAR), above June’s revised $14.56 billion and well above the $11.34 billion consensus.
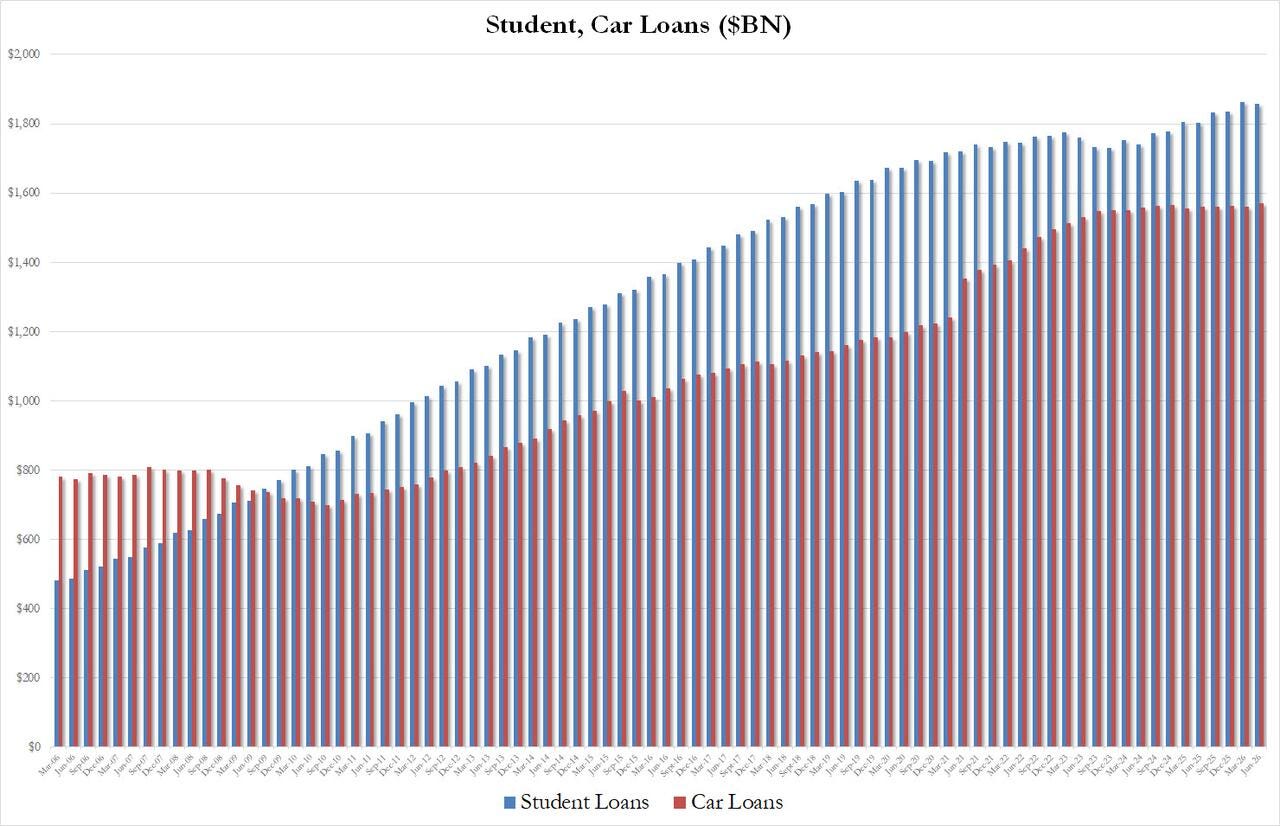
The gain was driven by nonrevolving credit (mostly student and auto loans, roughly three times larger than revolving debt), which jumped $15.26 billion (+4.80% SAAR), the biggest one-month increase since June 2023. Revolving credit (mostly credit cards) also increased but a much more modest $2.80 billion (+2.48% SAAR).
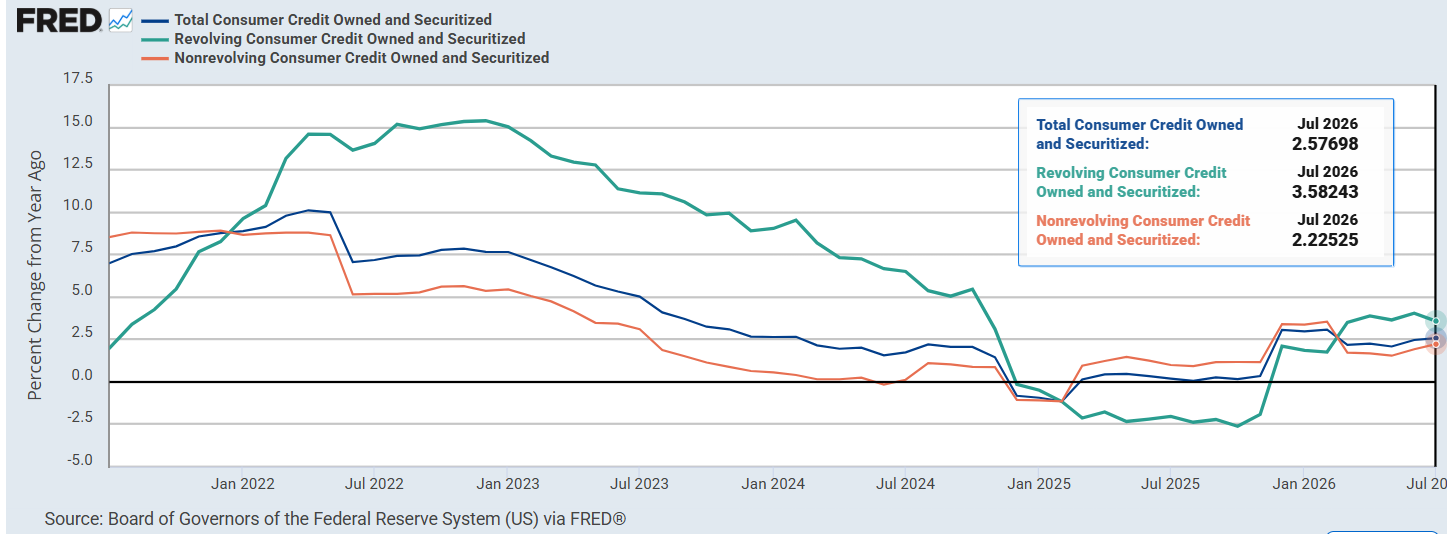
On a year-over-year basis, revolving credit remained the leader at +3.58%, nonrevolving +2.23%, and total +2.58%, all relatively modest especially when adjusted for inflation.
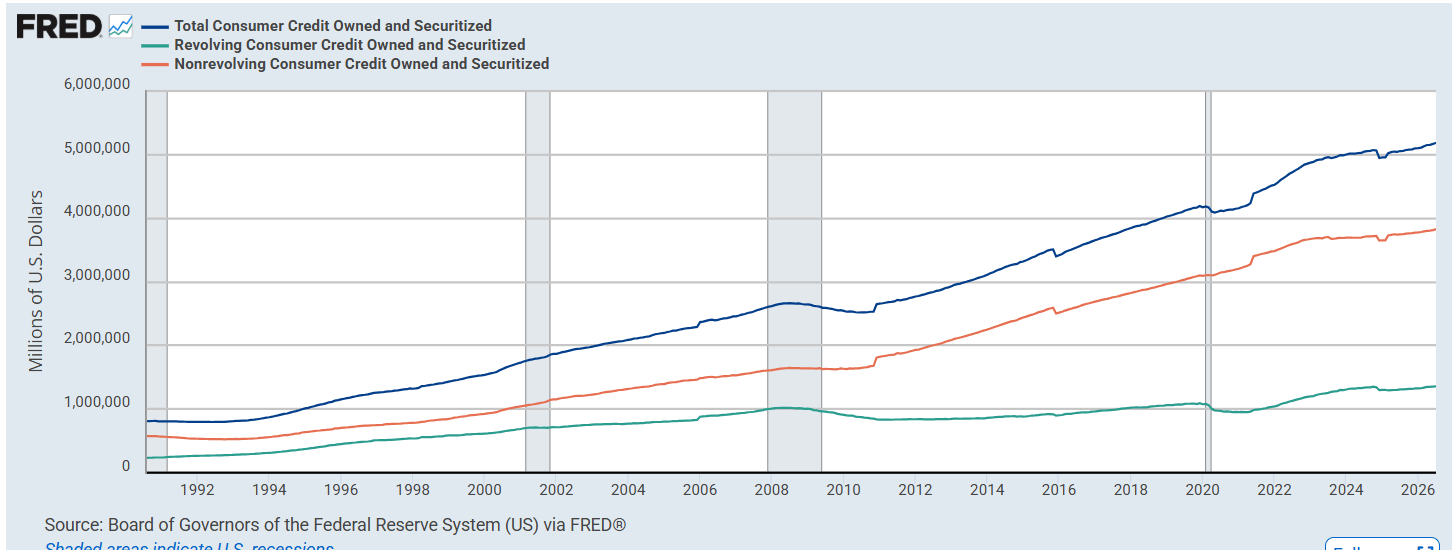
All three set fresh all-time highs in July.
NY Fed Consumer Survey A Mixed Picture
Now let’s look at the New York Fed’s Survey of Consumer Expectations.
This is a survey I like much better than the more widely cited University of Michigan survey because it follows the same rotating panel of roughly 1,300 household heads each month — respondents stay in for up to a year, with a similar number rotating in and out — which makes the month-to-month changes more meaningful than surveys that draw a fresh sample every wave (like UMich). It’s also about twice the size of the UMich survey (so smaller sampling error). This edition was fielded from August 3 to August 31.
Big picture, August was mixed.
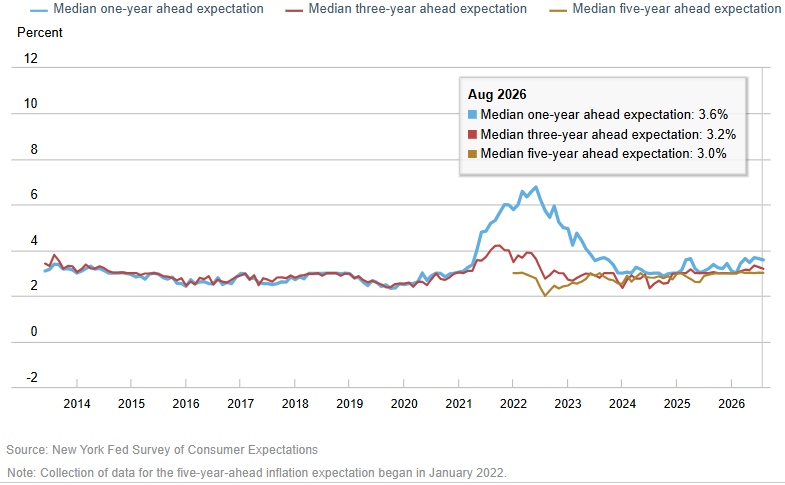
On inflation, median one-year and five-year expectations were unchanged at 3.6% and 3.0% (the one-year holding there for a second month), while the three-year measure ticked down a tenth to 3.2%.
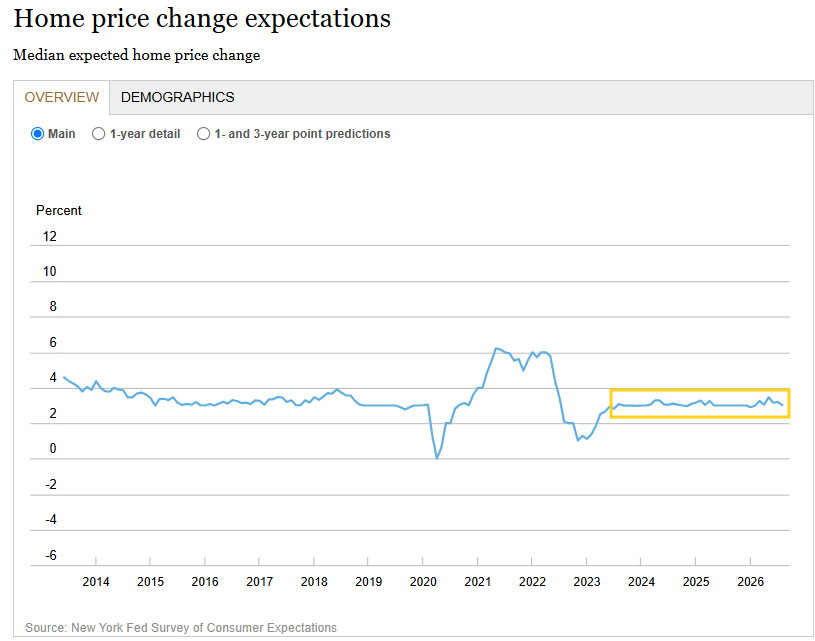
Expected home-price growth fell two-tenths to 3.0%, just under its 12-month average of 3.1%, with the decline concentrated in the Northeast. These have been little changed the past three years.
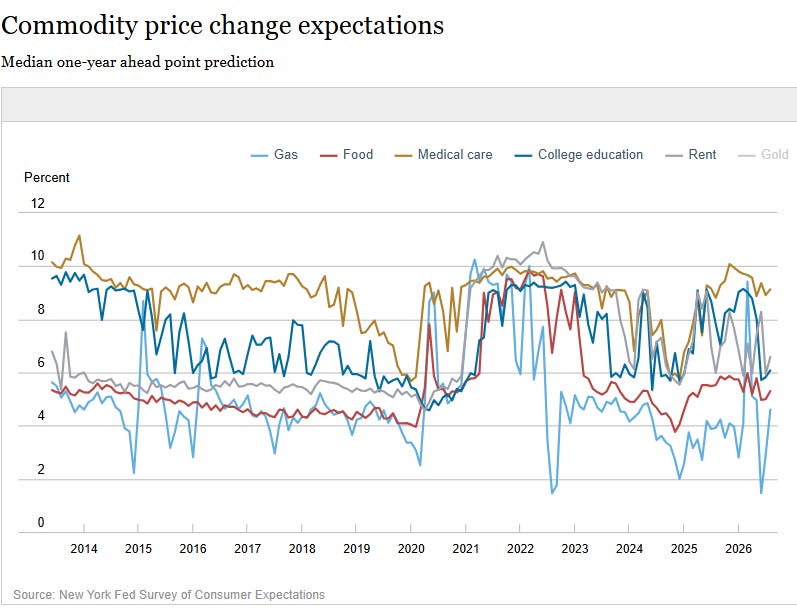
Expectations for everyday costs, though, mostly firmed: the median one-year-ahead expected change rose 1.7 points to 4.6% for gas, 0.3 to 5.3% for food, 0.2 to 9.1% for medical care, 0.3 to 6.1% for college tuition, and 0.7 to 6.6% for rent (gold ticked up a tenth to 4.7%).
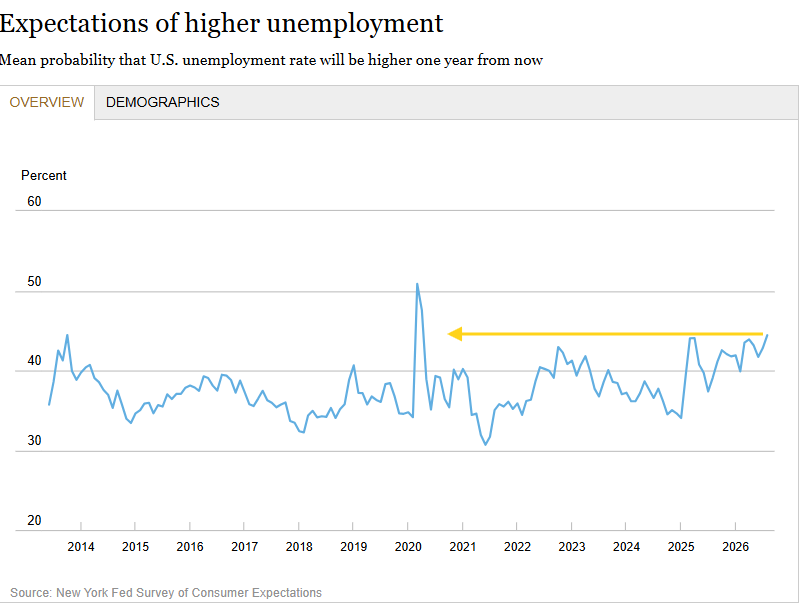
The labor-market picture was also mixed. On the negative side, the mean probability that the unemployment rate will be higher a year from now jumped 1.6 points to 44.4% — its highest reading since April 2020 (above the prior post-pandemic peak of 44.1% set in April 2025) — with the increase broad-based across age, education, and income groups.
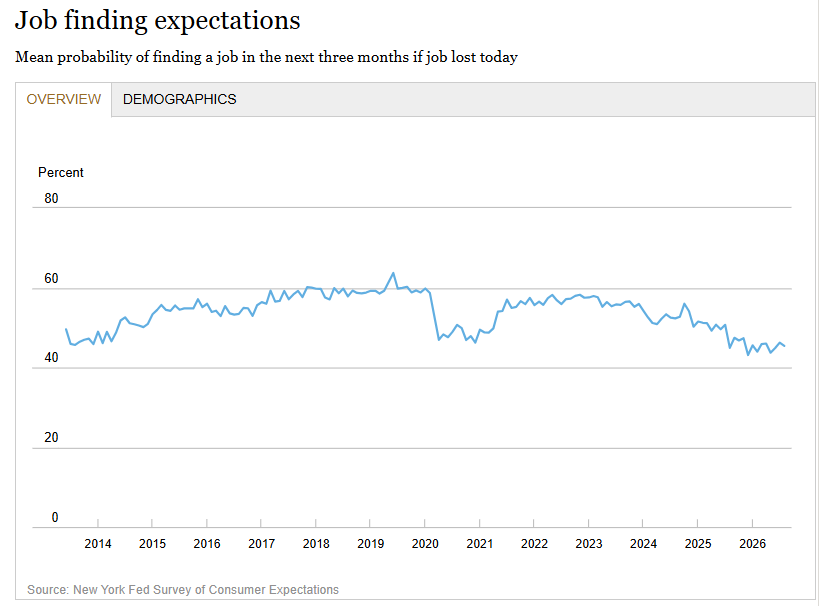
Perceptions of job-finding prospects also slipped, with the mean probability of finding a job if one lost their current position falling eight-tenths to 45.4%, just below its 12-month average.
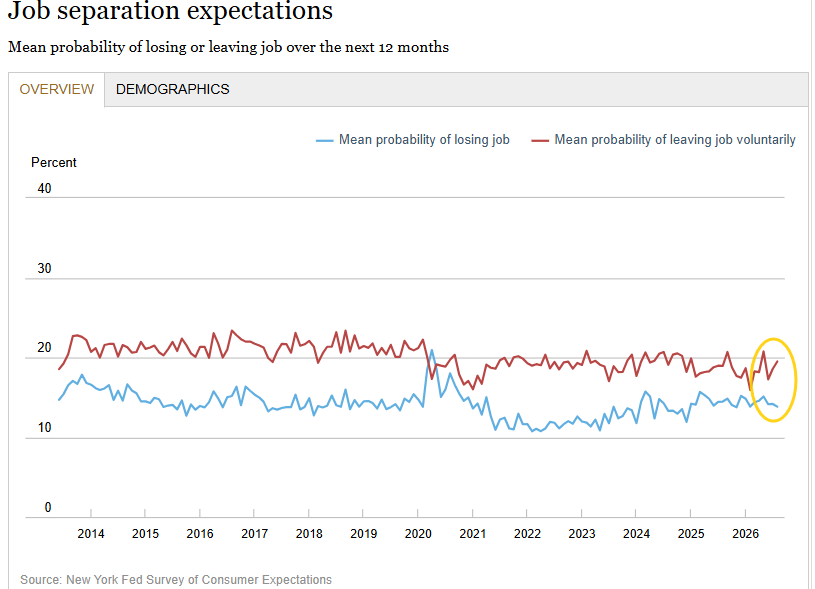
Working the other way, the perceived probability of losing one’s job fell four-tenths to 13.8%, the lowest since February 2026, and the expected quit rate rose nine-tenths to 19.5%, above its 12-month average of 18.4%; both moves were driven by respondents with at most a high-school degree and household incomes under $100,000.
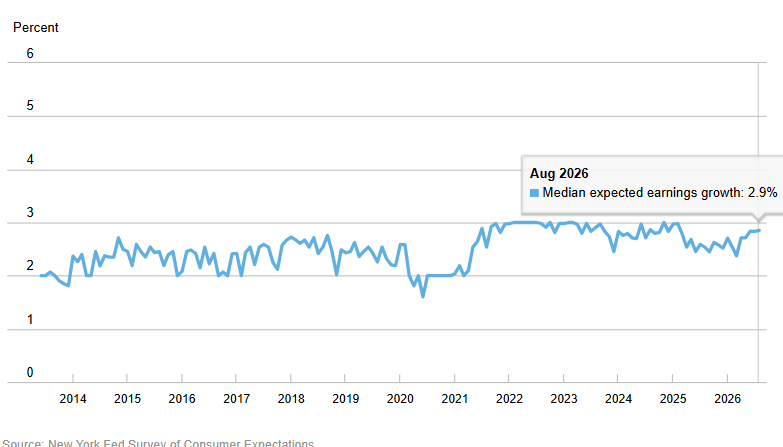
And expected earnings growth edged up a tenth to 2.9%, the best since February 2025.
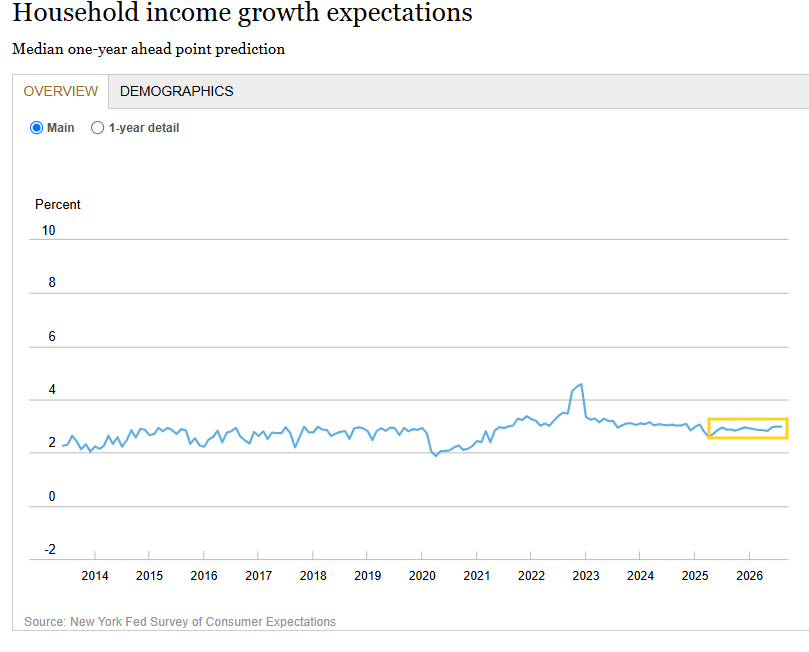
Despite the higher expected earnings growth, expected income growth held at 3.0%, where it has sat in a narrow 2.8%–3.0% band since mid-2025.
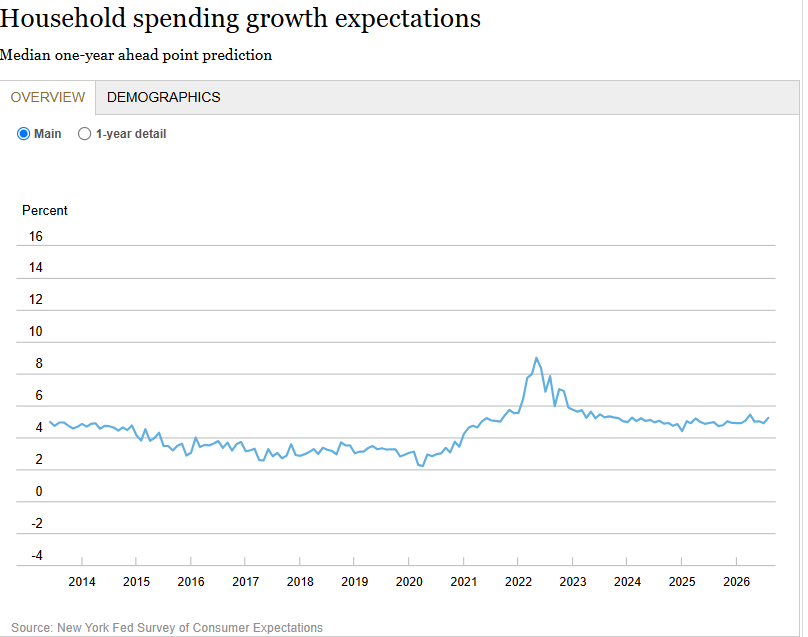
While expected spending growth rose three-tenths to 5.2%, above its 12-month average of 5.0%.
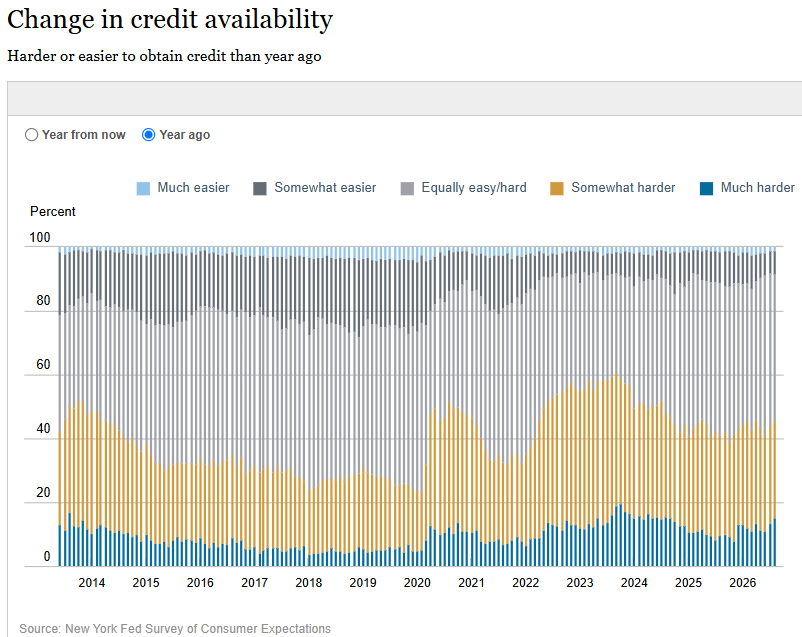
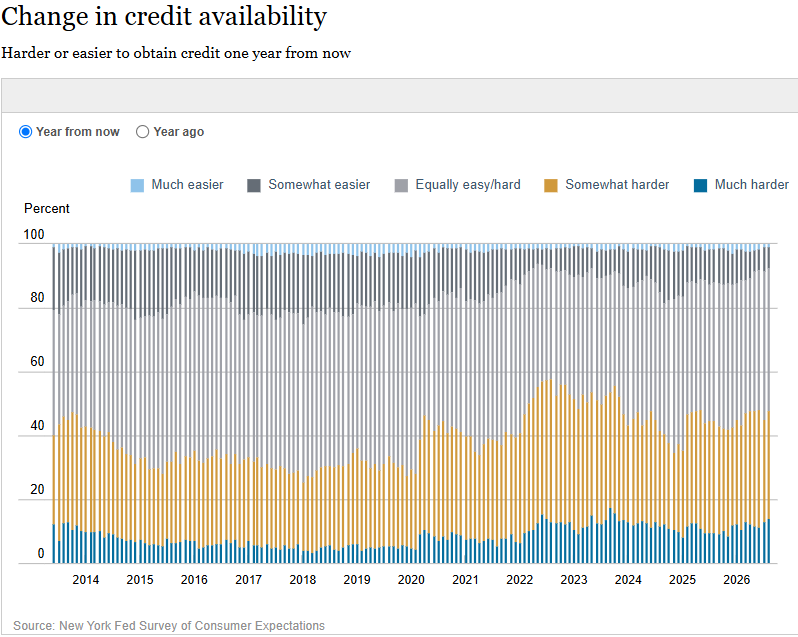
Perceptions of credit access relative to a year ago, though, deteriorated again, with a larger net share of households saying credit is harder to get, and expectations for future availability worsened as well.
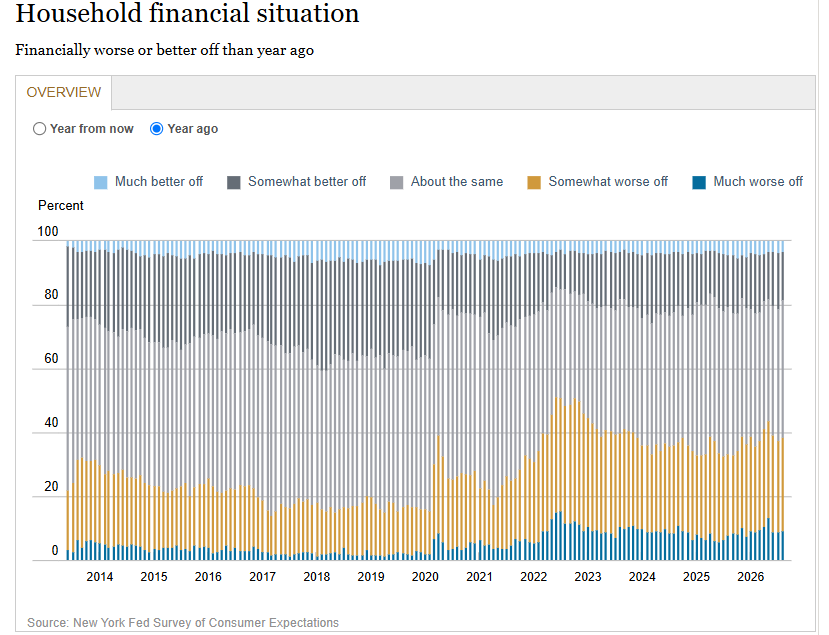
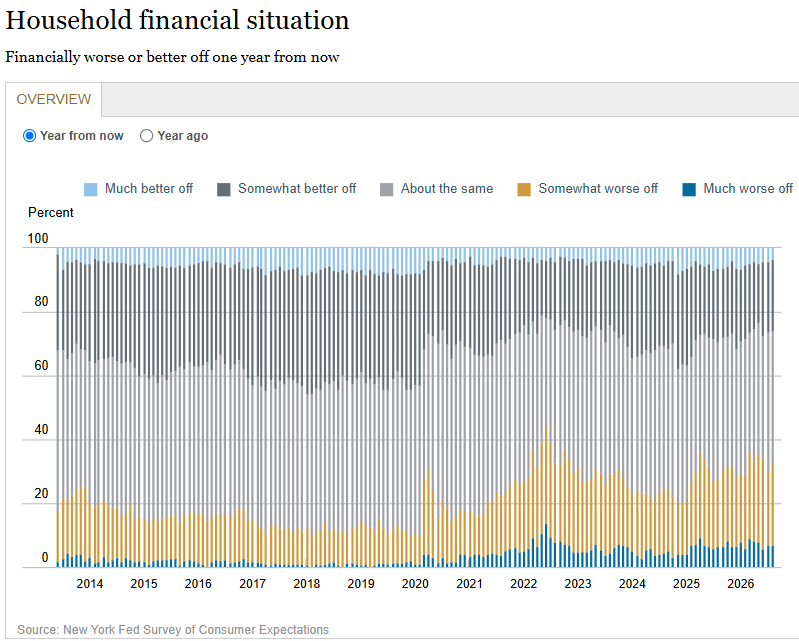
Assessments of households’ own financial situations also deteriorated on both counts, with larger shares reporting being worse off than a year ago and expecting to be worse off a year from now.
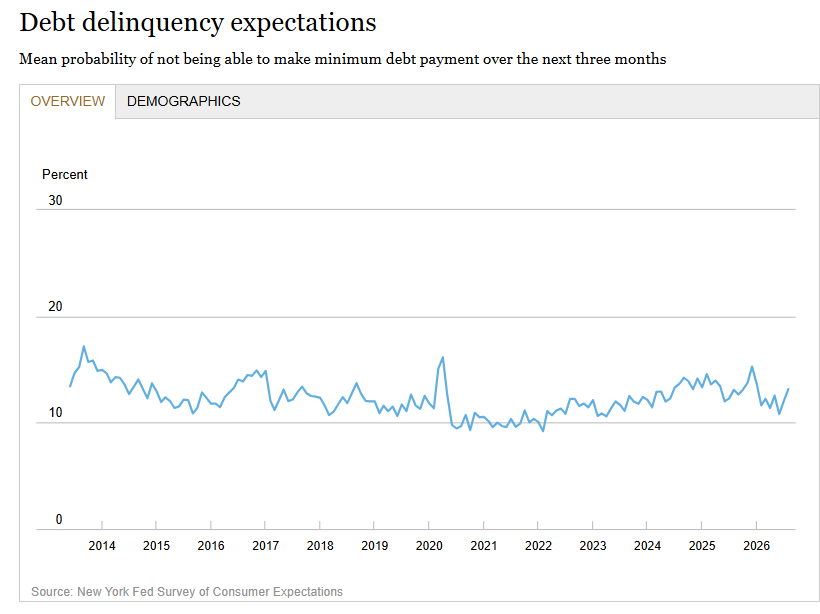
And the average perceived probability of missing a minimum debt payment over the next three months rose 1.2 points to 13.2%, the highest since since January and above the 12-month average of 12.7%.
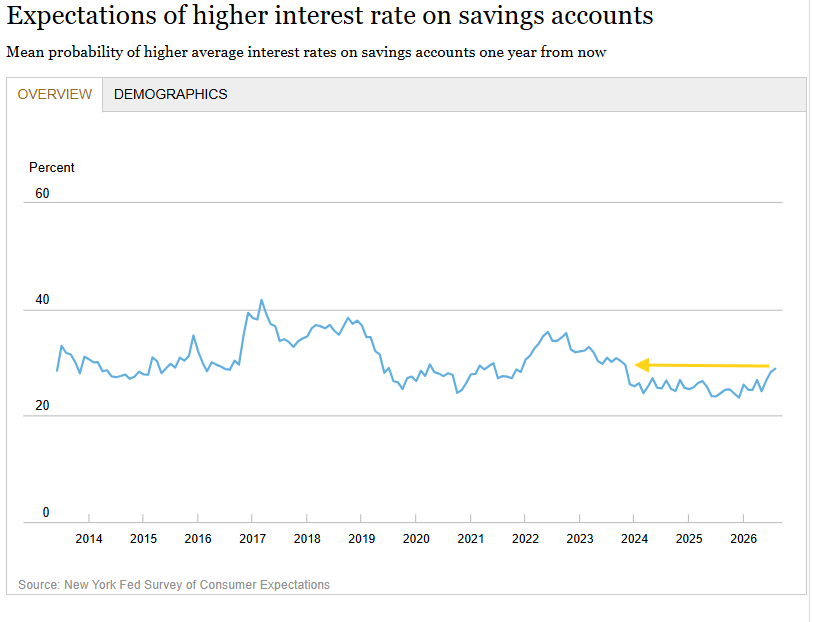
Positively, though, the mean perceived probability that the average interest rate on savings accounts will be higher in 12 months increased by 0.6% to 28.8%, the highest since November 2023.
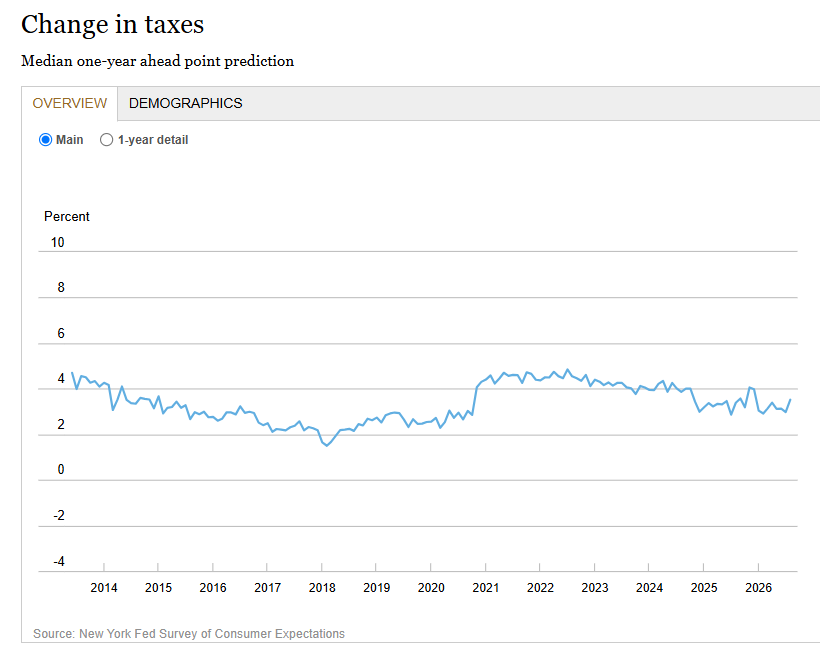
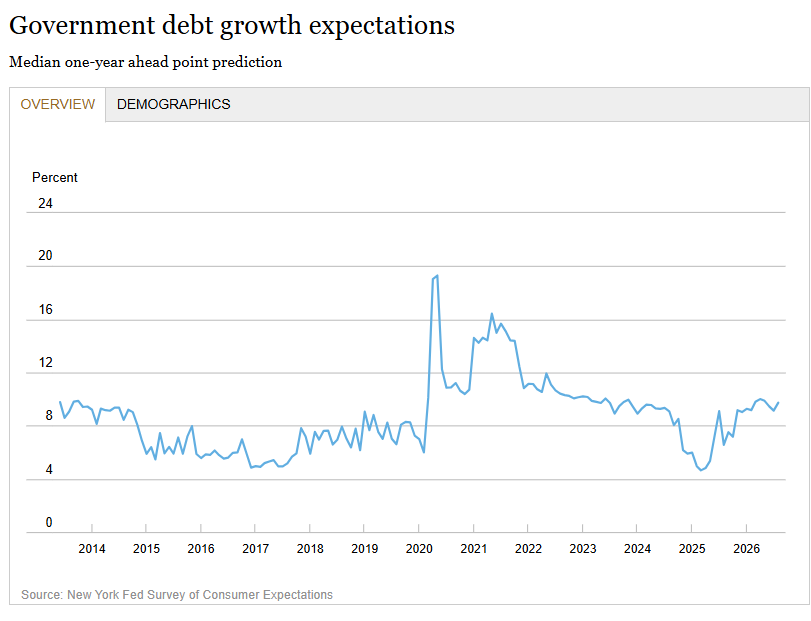
Households also, though, expected taxes to increase in the next year (up half a point to 3.5%, the highest since December 2025) and government debt as well (up six-tenths to 9.7%, still above its 12-month average of 8.8%).
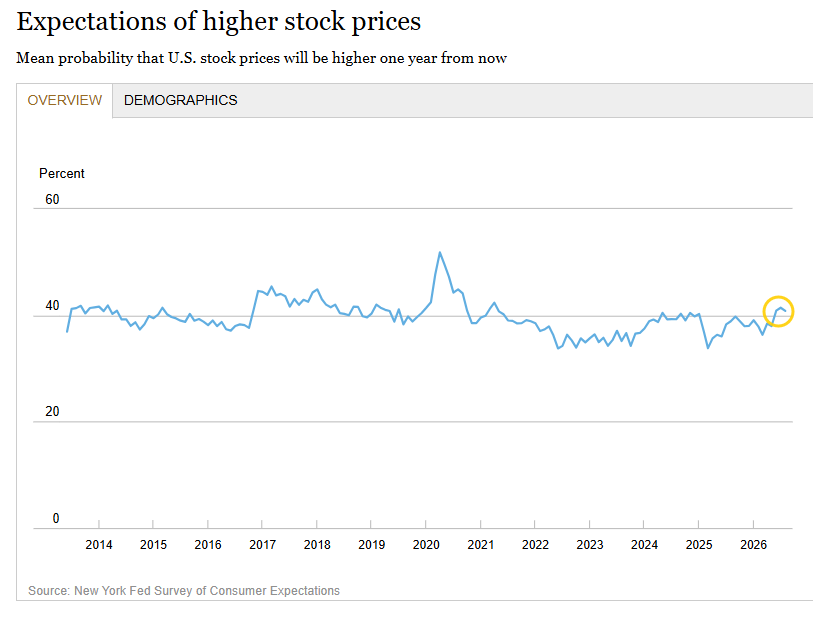
Finally, the mean perceived probability that U.S. stock prices will be higher 12 months from now edged down half a point to 40.9% from the highest since April 2021.
https://www.newyorkfed.org/newsevents/news/research/2026/20260908
