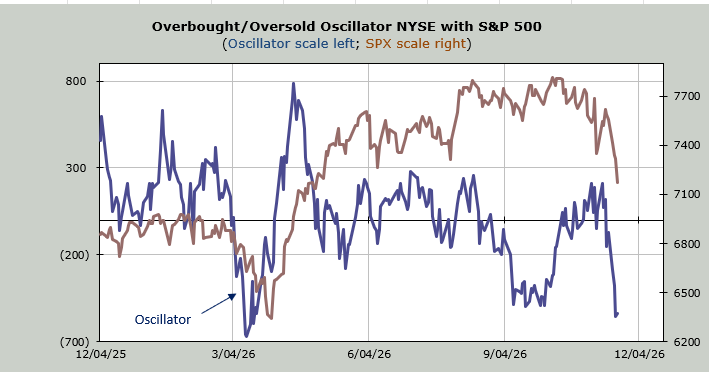
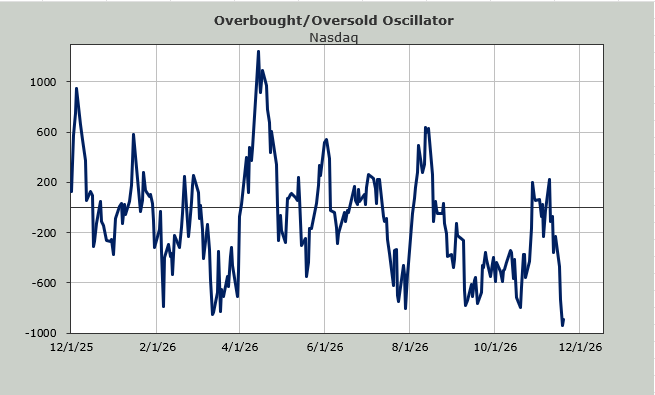
The Odds of a Relief Rally May Be Rising Fast
Put/call ratios, investor exposure, and sentiment gauges have shifted dramatically, setting up conditions that could favor a short-term rebound in stocks.
You've reached your free article limit
You've read 0 of 1 free Pro articles.

I had an interesting question yesterday that I would like to address. I will paraphrase, but essentially, the person wanted to know why technicians (and while he used that term, I believe, since he was speaking to me, he meant ME!) feel they need to line up all the indicators when (according to this person) we often never get the perfect setup for a rally.
For me, it is because for the forty-plus years I have been doing this, I have been a slave to my indicators. If they line up, then I am good to go with what they say. Can my own interpretation be incorrect? Of course. No one gets it right all the time. But I like to play the odds, and for me the odds say if I wait for the indicators to line up, my odds are better.
I don’t know why he thinks we often never get the perfect setup. My indicators were plenty bullish in late March, and they were bullish on the SOX again in late July. I would also point out that those same indicators were not bullish on the broadening-out story that was widespread in early August.
As for this point in time, I have been talking about sentiment being complacent for months on end. In the last two weeks, we have finally seen that change. I would say most of those sentiment indicators are not extreme, but they show a much different bias than we had even a week ago.
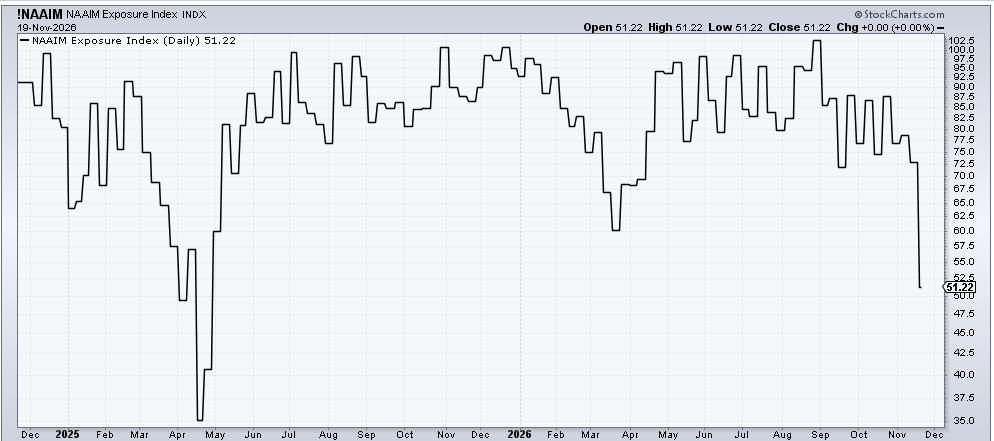
The Investors Intelligence bulls are still at 41%, and the bears are too low at 24%. AAII is similar: I don’t see an extreme there. The National Association of Active Investment Managers (NAAIM) who were on margin in September have really pulled in their horns as their exposure now sits at 51. That is lower than the spring, although not quite as low as the Tariff Tantrum. So, no, it’s not extreme, but it is a giant shift.
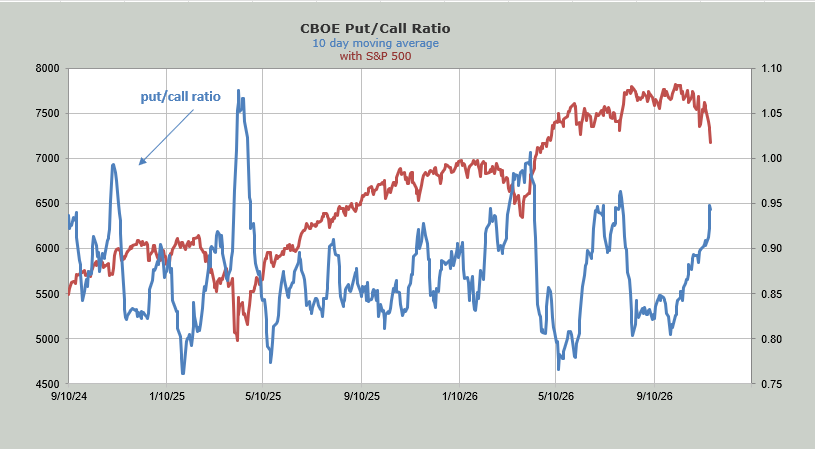
The ten-day moving average of the put/call ratio is finally closing in on the reading we saw in late July. I have been waiting for months for this to lift, and it finally has.
The DSI for the S&P is now at 10, and Nasdaq is also at 10. The last time these got this low was early April 2025, during the Tariff Tantrum. Before that was late September/early October 2022. I want to remind you that the DSI for bonds got to single digits in September, but bonds still had one last fling down (rates up) before it mattered.
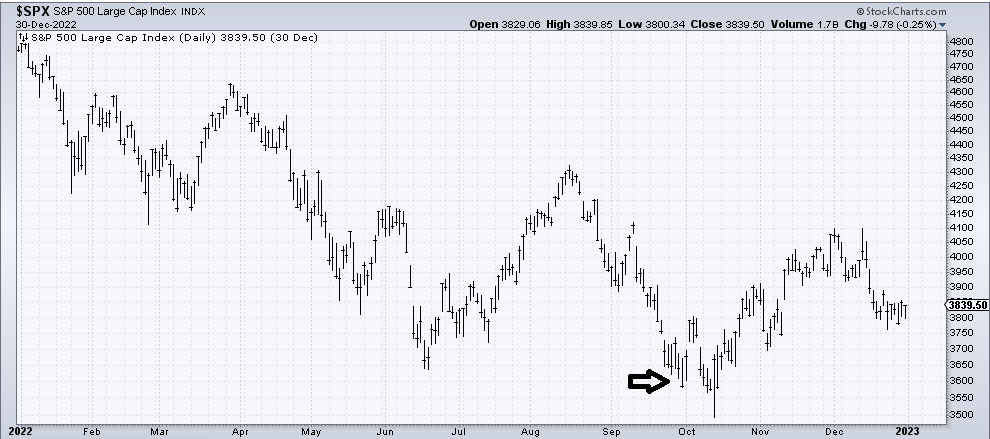
So here is a chart of 2022. I’m using this because I have used 2022 before with you (another bear market period). The arrow shows the time when the DSI got to 9 for both the S&P and Nasdaq. The rally didn’t last, but we did get a rally, six percent in a few days.
My indicators are set up to get short-term oversold midweek next week. I think we get an oversold rally. I also think you shouldn’t get married to it. You trade it.