A Thin Margin For Error Ahead of the FOMC
Equities fall for 6th time in 7 sessions bringing key downside levels closer as breadth deteriorates, oil approaches 4-year highs and long-term yields hit the highest in nearly two decades
You've reached your free article limit
You've read 0 of 1 free Pro articles.

Quick Summary
- Stocks fell for a second straight session (and 6th in 7) as another jump in oil and 10 and 30-year yields closed the extended session at the highest levels since 2007, keeping pressure on equities ahead of a highly uncertain FOMC decision (outside of the first expected hike in over three years).
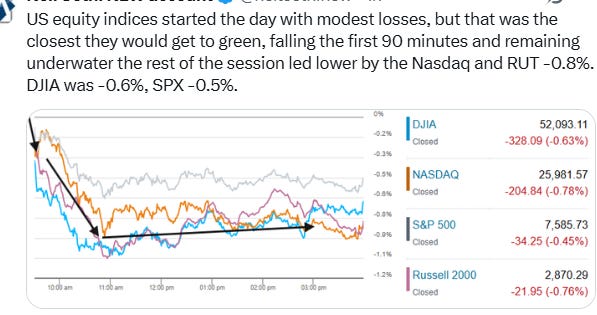
- Indices opened with modest losses, but that was as close to green as they got, led lower by the Nasdaq and Russell 2000 (both -0.8%), with the Dow Jones Industrial Average -0.6% and the S&P 500 -0.5%.
- An early bounce in chips and AI names faded (the PHLX Semiconductor Index finished +0.4% after being up ~2%), and breadth stayed weak with just 2 of 11 sectors higher.
- Oil surged again — WTI futures +4.4% to ~$106, its highest since May (cash prices closed at the highest since 2022) and nearly $20 higher on the month, with Brent near $109 — while the 10-year yield closed at ~5.00% and the 30-year at ~5.37% both for the first time since 2007.
- Fed funds futures priced roughly a 92% chance of a quarter-point hike Wednesday (CME FedWatch) with another hike by December fully priced.
Market Commentary
Equities:
- “There’s been a lot of spending and a lot of buildout in the AI space…The market has been pretty optimistic about the way it prices the future growth of everything tied to the AI story,” Charles Rinehart, chief investment officer of Johnson Investment Counsel, said. “This is a good reminder that things don’t go up in a straight line.”
- “There’s a lot of reasons for traders to take risk off the table,” Jake Behan, head of capital markets at ETF provider Direxion said, with investors wondering if they “still want to be in a crowded chip space with this slowdown question overhanging right now.”
- Increased volatility and recent headlines don’t mean that chip names are suddenly a bad investment. Nancy Tengler, CEO and chief investment officer of Laffer Tengler Investments, sees the selloff as “more likely to be a hiccup” than the end of AI trade. “The AI genie is out of the bottle,” Tengler wrote in a Monday note, highlighting that AI adoption is occurring across diverse industries outside of tech and leading to productivity improvements.
- “Different risk premiums are piling up on the bond market,” said Mabrouk Chetouane at Natixis Investment Managers. “With that backdrop, equity markets are no longer rising but stalling. For markets to bounce from here, we would need both some kind of visibility from the Fed tomorrow and solid third-quarter earnings.”
- “Treasury yields are closing in on an inflection point where, historically, stocks and bonds have mutually amplified portfolio risk. That points to a regime shift of higher bond and stock volatility and wider credit spreads.” — Simon White, BBG macro strategist.
- “Of course the bond selloff is weighing on tech and growth stocks,” said Louis Puga at Societe de Gestion Prevoir. “There are really two worlds at play here: on one side healthy corporate balance sheets and profits, and on the other side countries running big deficits and putting pressure on the bond market.”
- “While earnings have so far offset the drag, the approaching 5% threshold in 10Y yields marks a historically important inflection point, beyond which rates have typically become a more persistent headwind for equities,” a team of Barclays analysts said. “With inflation risks lingering and yields moving higher, the cushion provided by earnings growth may become increasingly difficult to maintain.”“Our base case remains constructive on equities, supported by continued earnings momentum, but the risk of a sharper repricing grows if yields move materially above current levels,” they added.
- “The combination of higher interest rates and elevated oil prices is like asking equities to run a marathon with ankle weights strapped on,” said Darrell Cronk at Wells Fargo Investment Institute. “Higher rates increase the discount rate investors apply to future earnings, while higher energy costs drain purchasing power from consumers and pressure profit margins.” The result is a market that must “work harder” to generate earnings growth just as investors become less willing to pay premium valuations, he added.
- “If the Fed follows the futures market and hikes rates, our sense is that stocks are likely to see downward pressure over the near-term,” said Chris Senyek at Wolfe Research. “However, we’ve found that over a longer time horizon — six to 12 months after the first rate hike — stocks typically recover and push into positive territory.” “Despite potential equity market weakness, we do not believe that this will mark a “top” for markets,” Senyek said in his note, adding that the technology sector can continue to work, given tailwinds from AI megatrends, very strong earnings results, and a resilient U.S. economy.
- “If the frontier labs truly believe AI is powerful enough to pose an existential threat, then AI must also be powerful enough to solve some of humanity’s largest problems,” Bank of America’s Benjamin Bowler wrote in a Tuesday note to clients. “AI’s potential is rising as fast as its risks, motivating the need for risk-managed upside exposure to US equities.”
Bonds:
- “There are a lot of underlying factors that make for a sustained selloff in rates as the path of least resistance for now,” said Zach Griffiths, head of investment-grade and macro strategy at research firm CreditSights. Ten-year yields could rise toward 5.5%, he said.
- “The scope for long-end yields to fall is somewhat limited given that we don’t see signs of weakness in the real economy and supply/dynamics in the Treasury market are very different relative to 2007,” Phoebe White, head of US rates strategy at UBS Group AG, said via email. “Structural demand for US Treasuries, particularly among foreign official investors, is materially weaker.”
- It’s “very hard for the market to be bullish duration given the persistent pressure from the energy complex and the fact that yields have been grinding higher for months,” said Izaac Brook, rates strategist at RBC Capital Markets. “I do think the 5% level will bring buyers in — you can see a bit of a bounce right now. But the rates market is still at the mercy of what’s happening in the Middle East.”
- “A Fed hike and the ongoing move higher in oil will take US yields higher again, and the flirt with 5% in the Monday session should be seen as the norm rather than the exception,” said Martin Whetton, head of financial markets strategy at Westpac.
- “Could things get even more sinister? Yes, where a break above 5% on the 10-year yield does nothing more than bring 6% into focus,” said Padhraic Garvey, head of research for the Americas at ING Groep NV. “Such a journey from 5% to 6% would be a far tougher one for the wider market to stomach.”
- “With investor sentiment already deeply bearish on bonds and speculative short positions in 10-year Treasuries near record highs, the move appears increasingly overextended,” according to Larry Adam, chief investment officer at Raymond James. “That suggests yields may be closer to a peak than the start of a new, sustained leg higher.”
Fed:
- “If they don’t hike, it’s going to be pandemonium,” said Ed Al-Hussainy, a portfolio manager at Columbia Threadneedle. In that scenario, long-term bond yields will surge as inflation risks mount, he said.
- “It would be very difficult for the Fed to leave rates unchanged this week without eroding its inflation-fighting credibility,” said Vail Hartman, a strategist at BMO Capital Markets. “The market is vulnerable to not only an unexpected hold, but also a dovish hike that entails a more patient takeaway from the dot-plot or press conference.”
- “After years of inflation overshooting target, the Fed’s credibility is under scrutiny,” wrote Jenny Zeng at Allianz Global Investors. Warsh’s “recent comments leave little doubt that restoring price stability remains the priority. September is the meeting where that commitment is put to the test.”
- “Markets want at least a little bit of guidance so that they can get their head around,” Melissa Brown, global head of investment decision research at SimCorp said. “I think if Warsh were to say, ‘We remain concerned about inflation, and we’ll act accordingly,’ I think that’ll be fine. The concern is that he just doesn’t say anything.”
- “The odds of a serious Fed policy mistake are uncomfortably high and rising,” warned Mark Zandi, chief economist at Moody’s Analytics, in a post on X. It’s hard to slow economic growth without layoffs, rising unemployment and igniting a “self-reinforcing negative cycle,” said Zandi
- Although the likelihood of a rate increase has certainly gone up in recent weeks, Michael Pearce, chief U.S. economist at Oxford Economics, said the September decision could still go either way. “We’re sticking with our forecast that the Fed leaves rate on hold,” Pearce said in a note to clients.
- Michael Strain, director of economic policy studies at the American Enterprise Institute, said that the market is reading the Fed wrong and that the “center of gravity” among Fed officials still supports keeping rates unchanged. Without higher energy prices and tariffs, underlying inflation would be closer to 2.5%, not far above the Fed’s 2% target, he said.
- Although core inflation remains “uncomfortably high” and renewed energy-price pressures could slow further progress, inflation has moderated considerably from its 2022 peak, according to Brock Weimer at Edward Jones. “Against this backdrop, we expect any renewed Fed tightening to be limited in scope and duration,” he added. “Importantly, we do not expect a modest additional increase in interest rates to derail the broader economic expansion or the equity bull market.”
- Rick Rieder, BlackRock’s Global Fixed Income chief investment officer, expects the Federal Reserve to increase interest rates on Wednesday — although he doesn’t necessarily agree with the move. “I wouldn’t [hike rates],” he said in an interview with CNBC’s “Halftime Report. “[M]oving the funds rate 25 basis points — Are you really going to do anything for inflation? What’s driving inflation today is interest rate insensitive. Obviously, you’ve got war, you’ve got energy prices, you’ve got education, insurance costs, healthcare. It doesn’t really do much.” While he is still underweight long-dated bonds, he has “dabbled a little bit” and added exposure. Those investors who want to follow suit should be cautious, he warned. “When the 10-year [Treasury yield] hits 5%, 95% of the time in history when it does, it’s a really good forward investment environment in terms of buying interest rates,” he explained. “That being said, I still think rates could move a bit higher, assuming they hike.” What he really likes right now is the very front end of the curve.
Stock and Sector Breakdown:
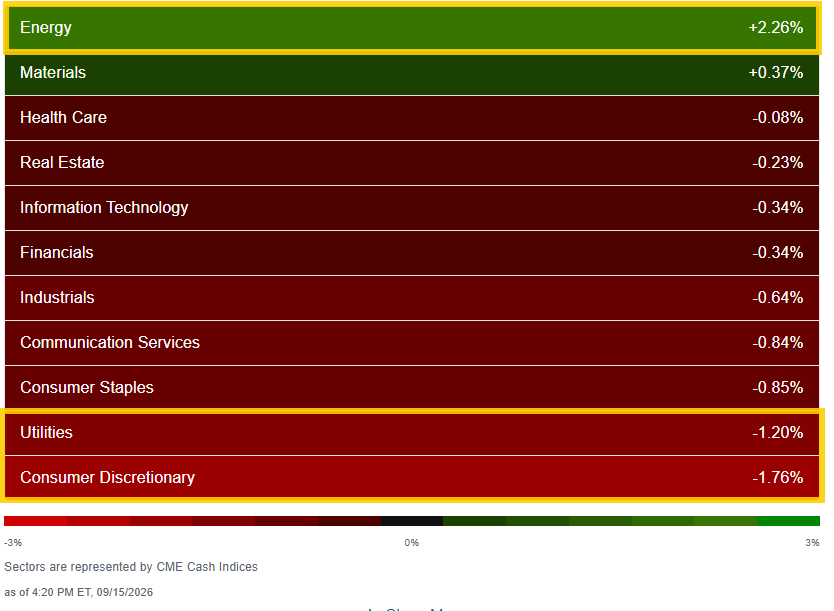
Sector breadth remained weak with just 2 of 11 sectors higher (after three Monday), but unlike Monday, just one was up over 1%, Energy. Materials was +0.4%. Five sectors down more than that, with two (Utilities and Consumer Discretionary) down more than 1%. Industrials (down 10% the past month) and Utilities (which are testing their liberation day low) continued their recent weakness.
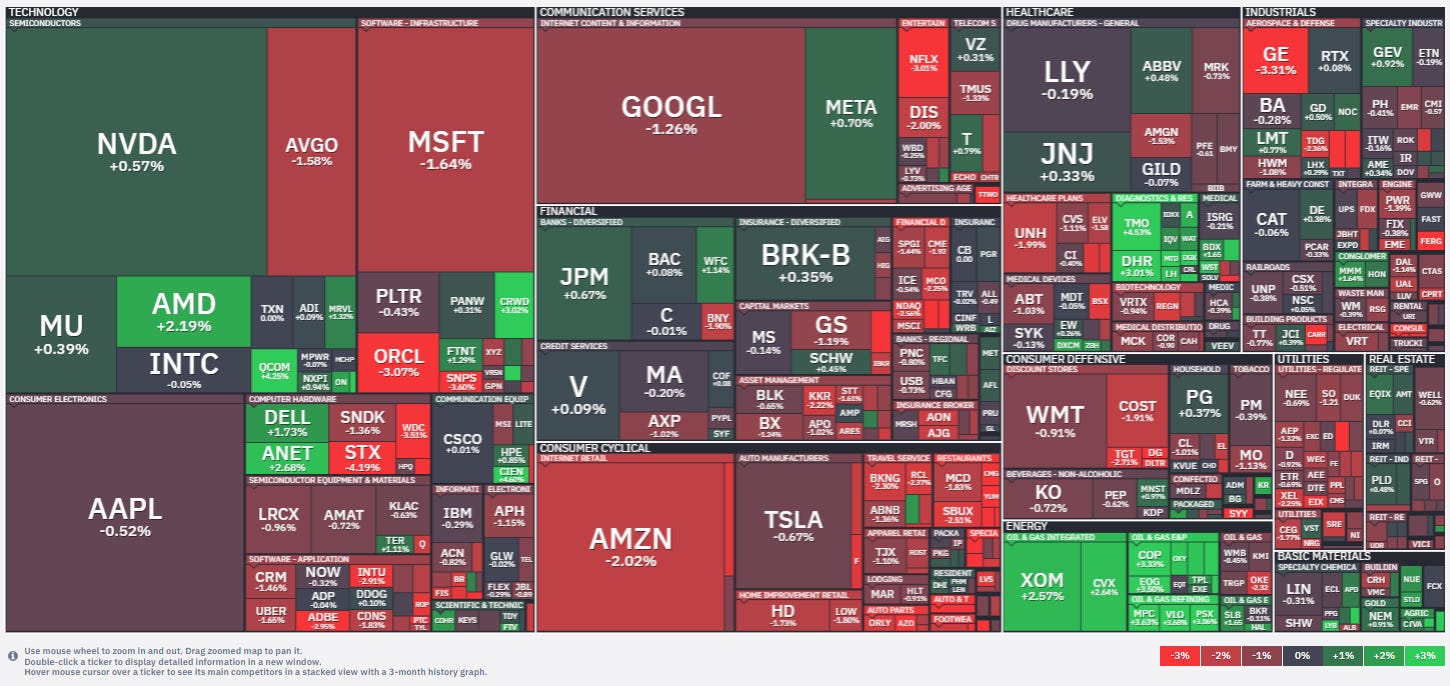
Consumer stocks and homebuilders were pressured by the elevated rate environment, while Chipotle Mexican Grill (CMG) -5.94% and Carvana (CVNA) -5.62% were among the group’s notable individual laggards.
Technology stocks offered some relative support after yesterday’s sharp semiconductor selloff, although the early rebound in chip stocks lost considerable momentum as the session progressed. The PHLX Semiconductor Index (SOX) +0.4% finished modestly higher but eased from early gains of as much as 2.0%. Skyworks Solutions (SWKS) +13.55% led all S&P 500 components on no particular news but investors remain optimistic about its pending merger with Qorvo that will close “this calendar year.” Advanced Micro Devices (AMD) gained 2%. Qualcomm (QCOM) advanced more than 4%.
Weakness in crypto-related names intensified during the afternoon after the U.S. Senate failed to advance the Clarity Act in its first procedural vote. Coinbase Global (COIN) -10.10% finished as the worst-performing S&P 500 component. But a rebound in the banking sector helped offset some of that weakness for the financials sector. Wells Fargo & Co. (WFC) was +1.1% after Chief Financial Officer Michael Santomassimo said that the lender’s net interest margin is expected to be better than initially expected.
With fewer sectors up over 1%, the number of large SPX winners (up over 3%) dropped back to ~20 from ~55 Monday and ~45 Friday. But the number of large losers (down over 3%) also fell back to ~30 from ~65 Monday but just 3 Friday.
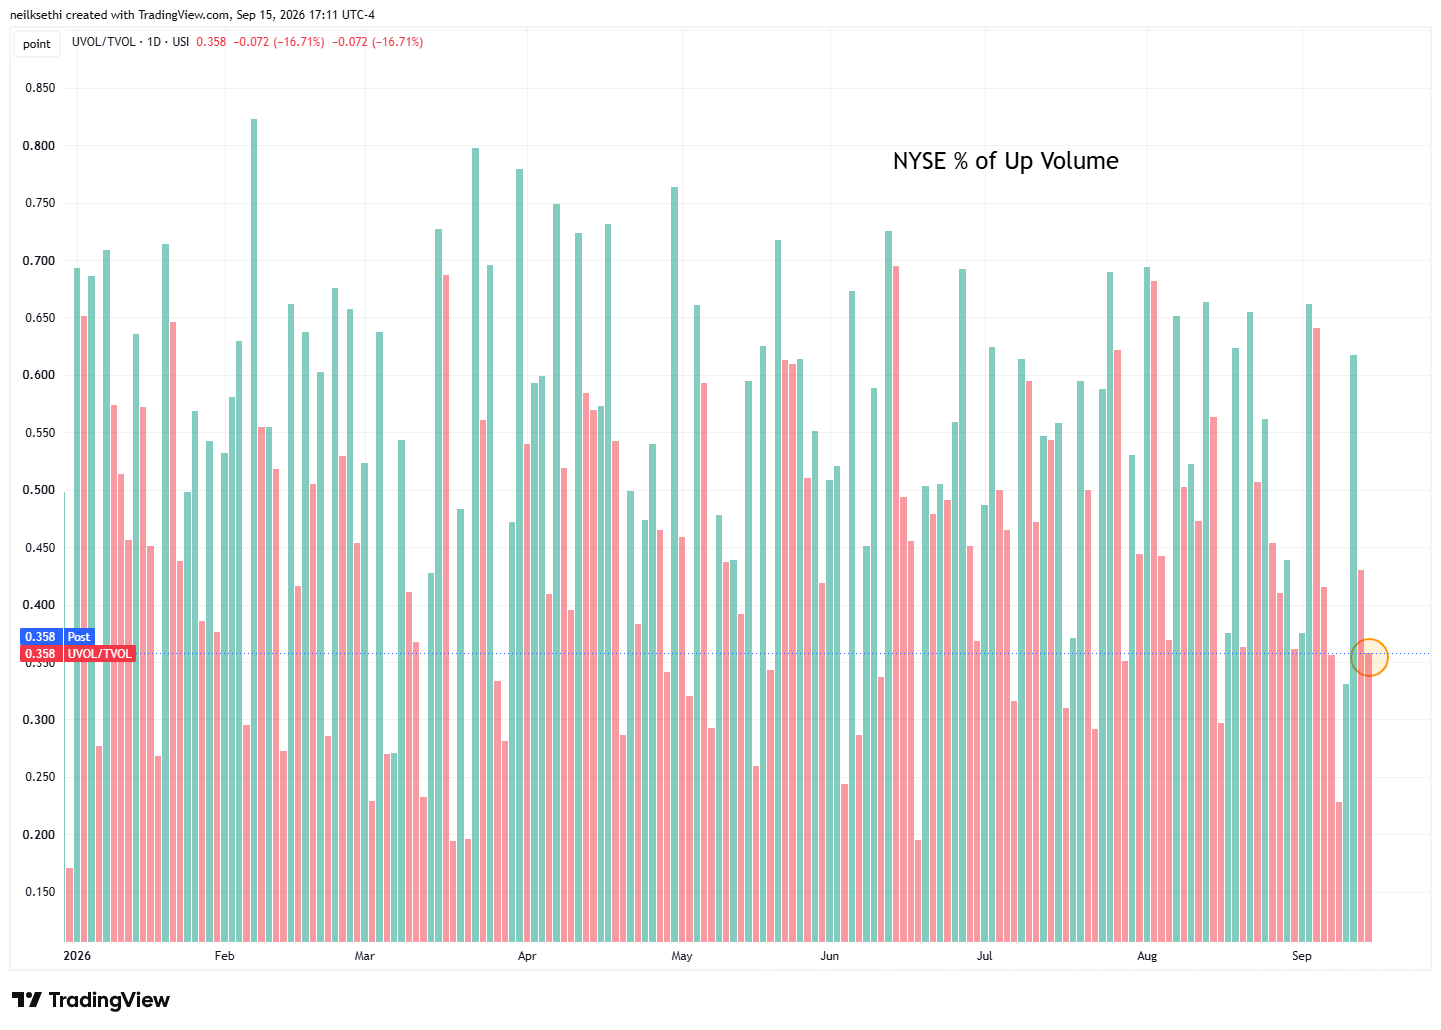
Breadth metrics not great Tuesday.
First, despite a smaller loss on the NYSE (-0.32% vs -0.52%), positive volume (intensity of buying in stocks up on the day) fell back to 35.8% from 43.0% Monday.
In addition, new 52-week highs minus new lows fell to the least since April 2025 on the NYSE and just off the least since March on the Nasdaq.
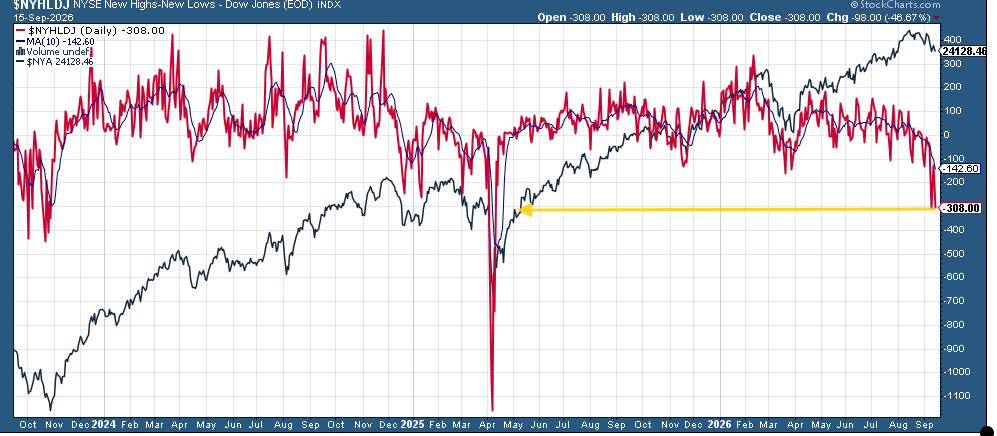
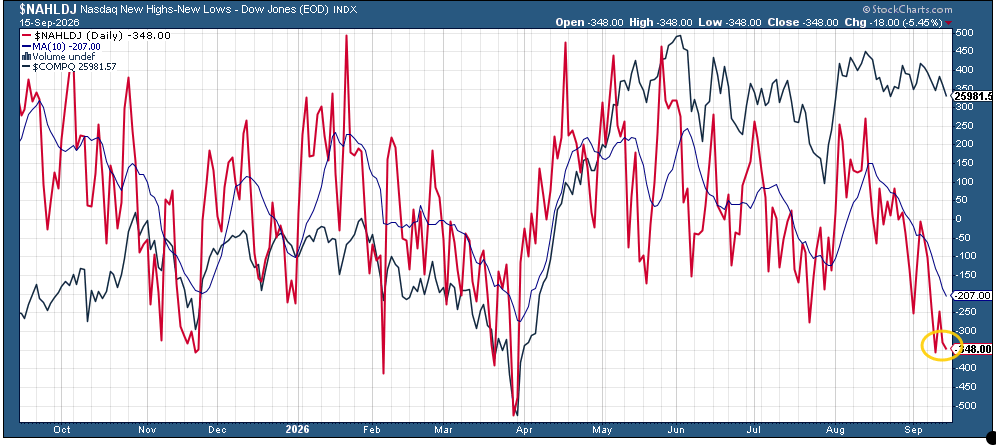
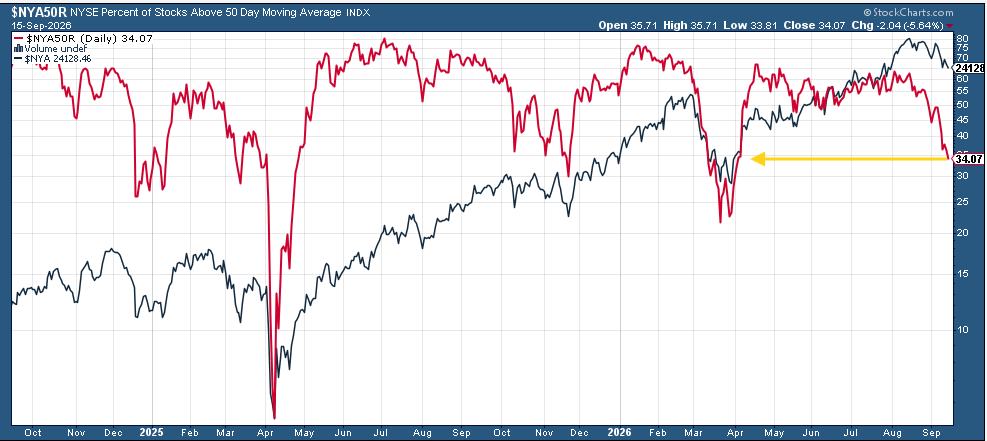
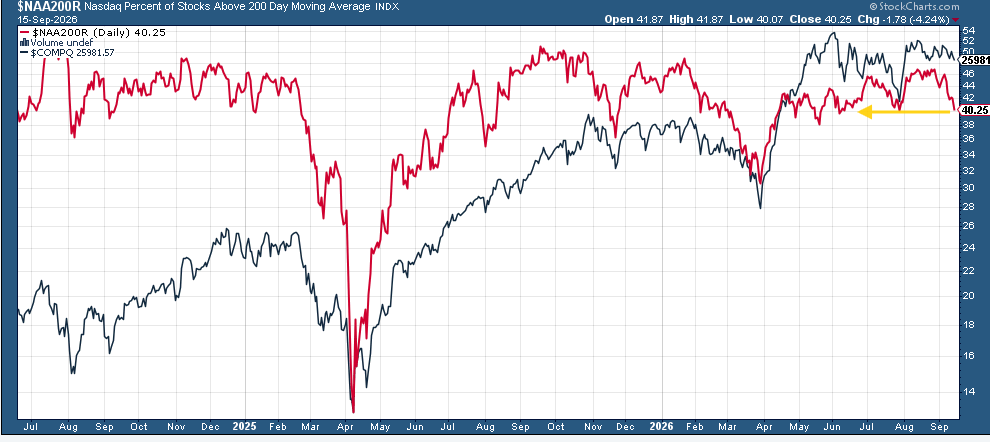
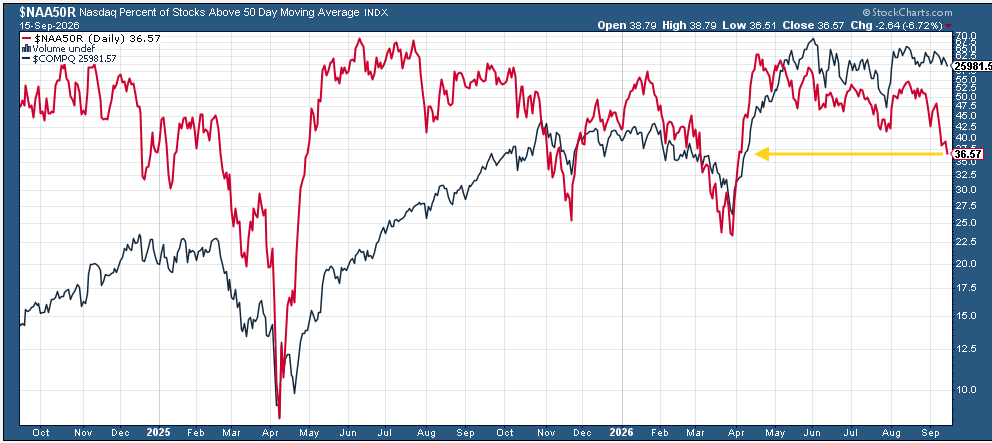
While the percent of NYSE and Nasdaq stocks above their 200 and 50-DMAs broke to new multi-month lows (20-DMAs just held their recent low).
NYSE
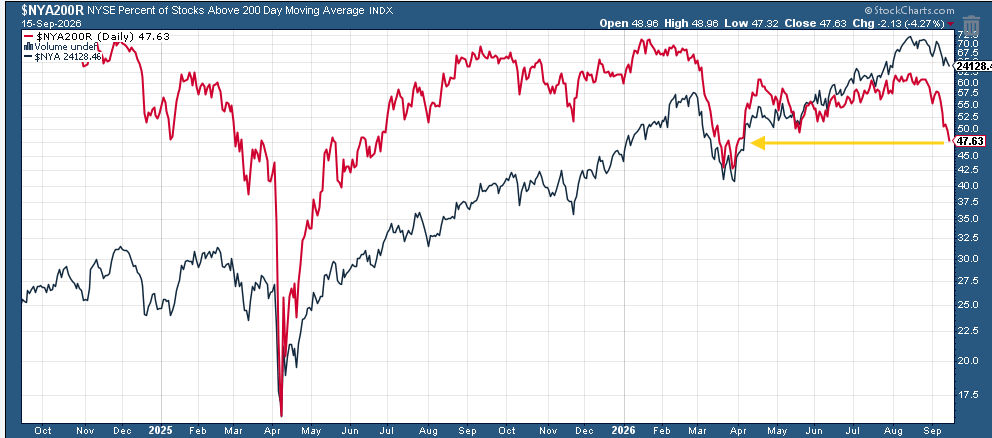
Nasdaq
Some stock-specific commentary from TheStreet Pro today:
- Chris Versace – Axon’s Notes Offering Brings Additional Share Pressure
- Stephen Guilfoyle – CrowdStrike Just Popped. Here’s My Plan and Why I’m Upping the Price Target(great call by Sarge on (CRWD) now at an all-time high & Buying More Rocket Lab After $1.9 Billion Acquisition Update
- Ed Ponsi – Fuel for Growth: 3 Big Energy Stocks Get New Price Targets
- Alex Frew McMillan – Will the World’s Most Successful Stock List U.S. Shares?
- Bob Lang – Chart of the Day: American Express Settles In
- James “Rev Shark” DePorre – The Waiting Game: Here Are 12 Stocks I’m Waiting to Add
A Look At The Charts
Note on all charts the colored lines are moving averages (the average price over the lookback period (days on the daily charts, weeks on the weekly charts)):
20 = green
50 = purple
100 = blue
200 = brownException is monthly charts where blue is 10-month moving average and brown is 20-month moving average.
MACD = Moving average convergence/divergence line, a measure of momentum that compares longer term and shorter term momentum to gauge if a move is strengthening or weakening. This is probably my favorite individual indicator (it’s also the favorite of Katie Stockton, a very fine technician).
RSI = Relative Strength Index (basically what it sounds like) = measures the strength of the move comparing gains to losses over the given lookback window (I use the standard 14 periods).
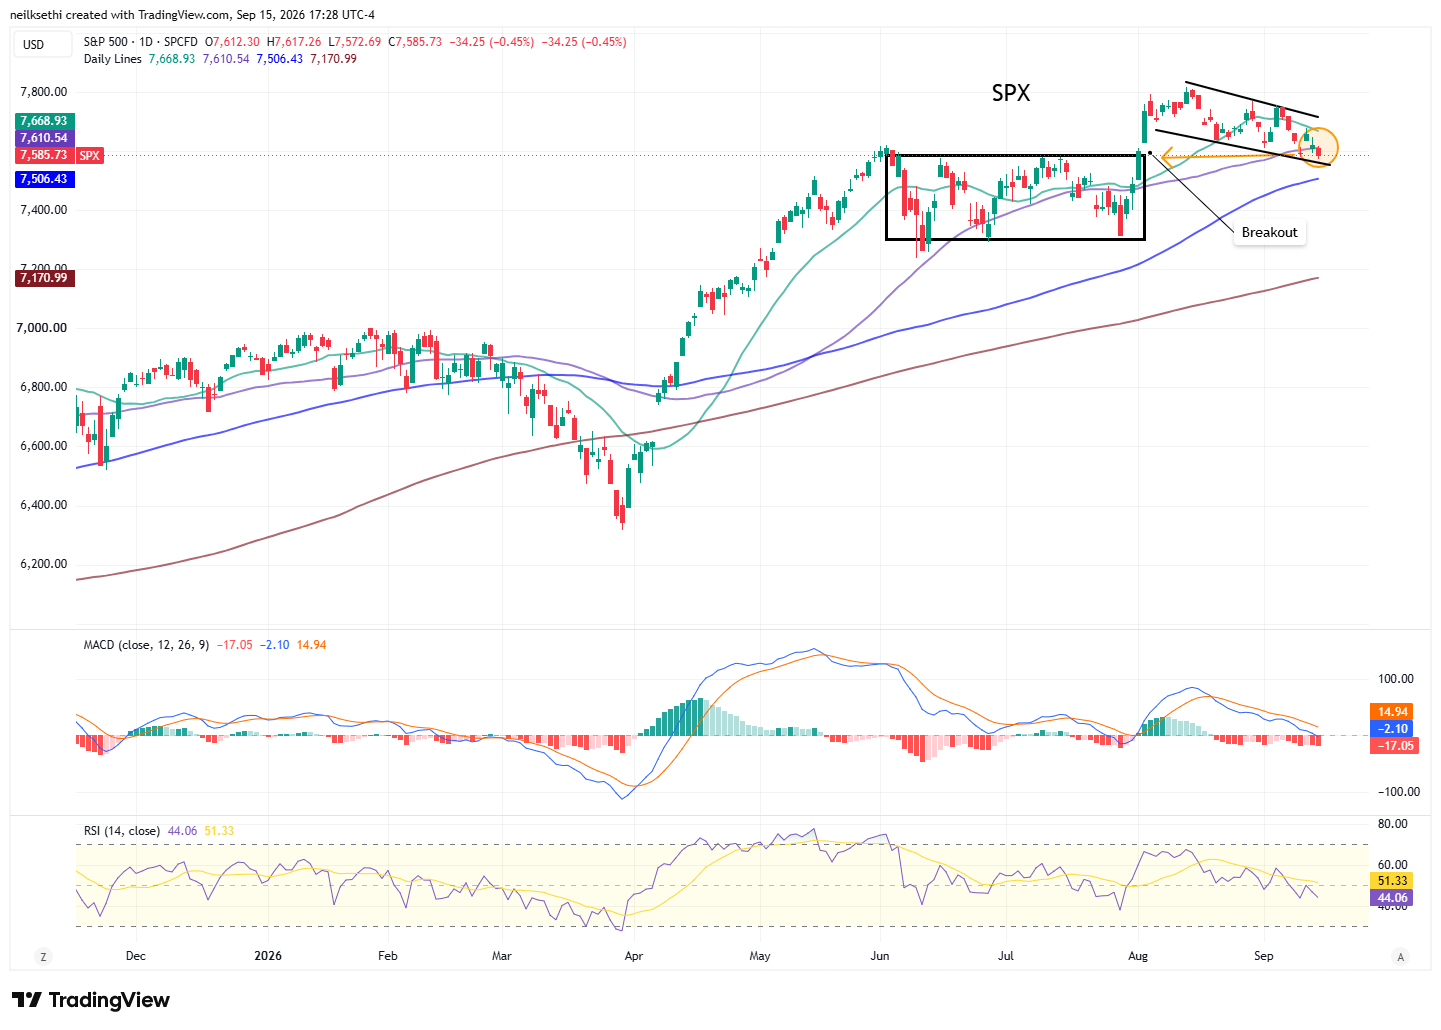
SPX fell back under its 50-DMA. Daily MACD remains in “sell longs” positioning, and RSI is under 50. So as I said Tuesday/Wednesday last week “just caution flags – nothing yet to turn bearish, but that probably changes short term if the 50-DMA doesn’t hold.” As I added Thursday, “For now I’m taking some comfort in the fact it doesn’t seem CTA selling thresholds have hit, and Tier1Alpha (see below) finds the 7575 level (which we closed above) good support. If we breach that I will exit my SPX index longs until we recover the 50-DMA.” We’re right there, so we’ll see what happens tomorrow.
And here’s some analysis from BofA’s technician Paul Ciana (I added the breakout, flag, and consolidations to the chart): “The current consolidation on the daily chart is evolving into what may be a bull flag pattern. A breakout above 7,760-7,770 would confirm the pattern and strengthens the case for continued upside. Conversely, a break below 7,500 would represent a meaningful deterioration in the technical backdrop, raising the risk of a pullback toward 7,314-7,294 and potentially the rising 200-day SMA approaching 7,200.”
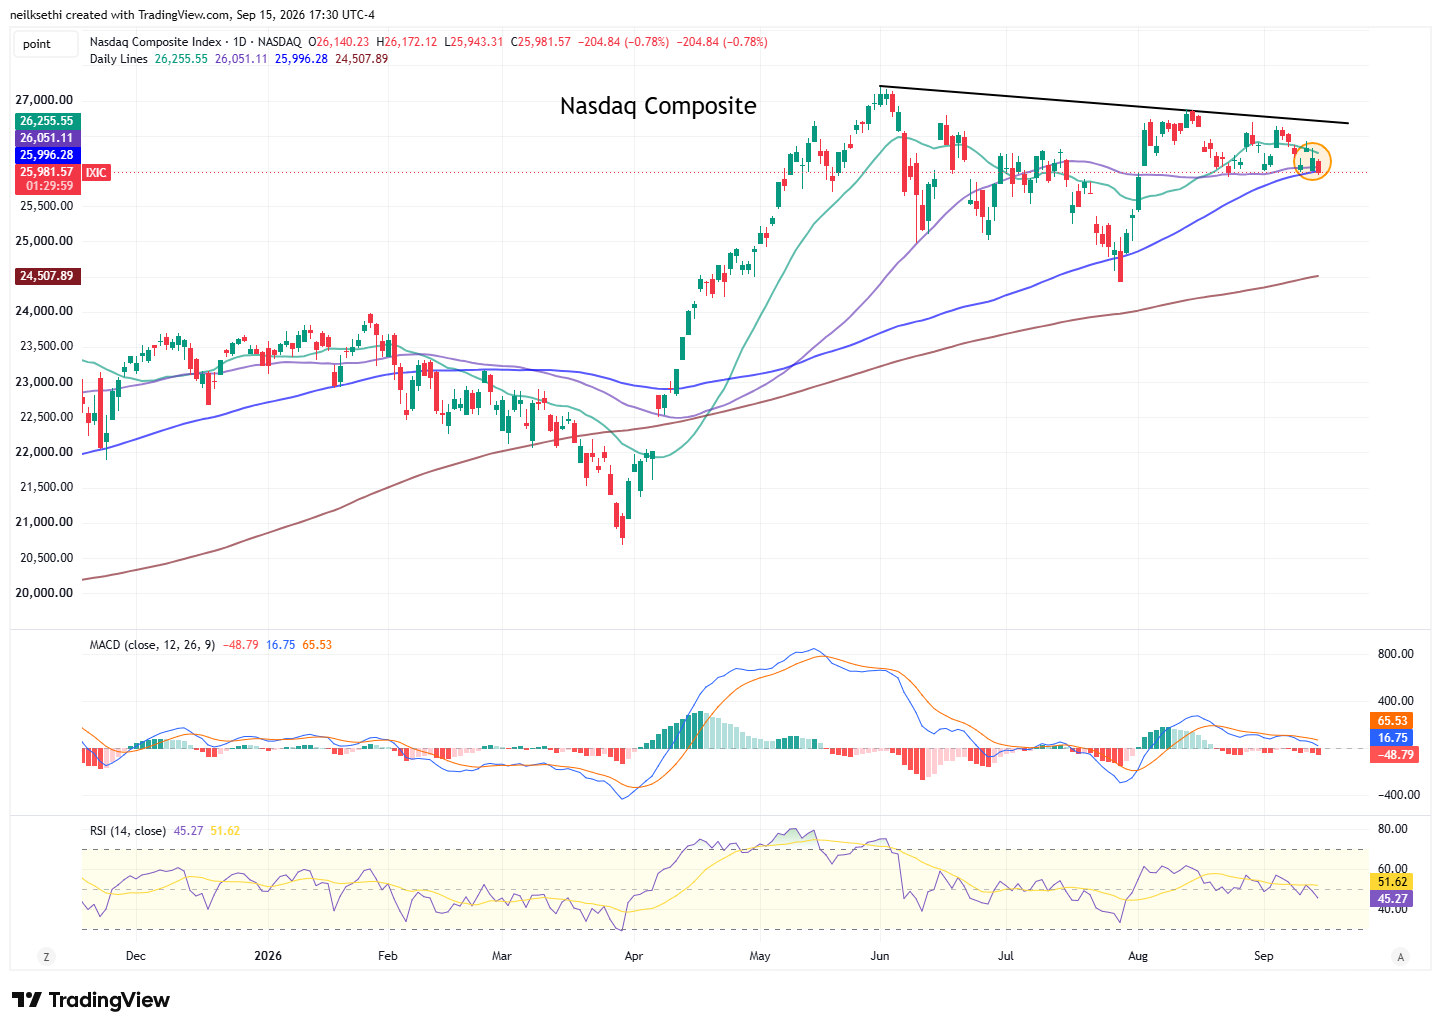
Nasdaq Composite a similar story to the SPX but sitting on its 100-DMA. As I said Thursday “Holding here as well for now.” A break of the 100-DMA, and I will start to cut back.
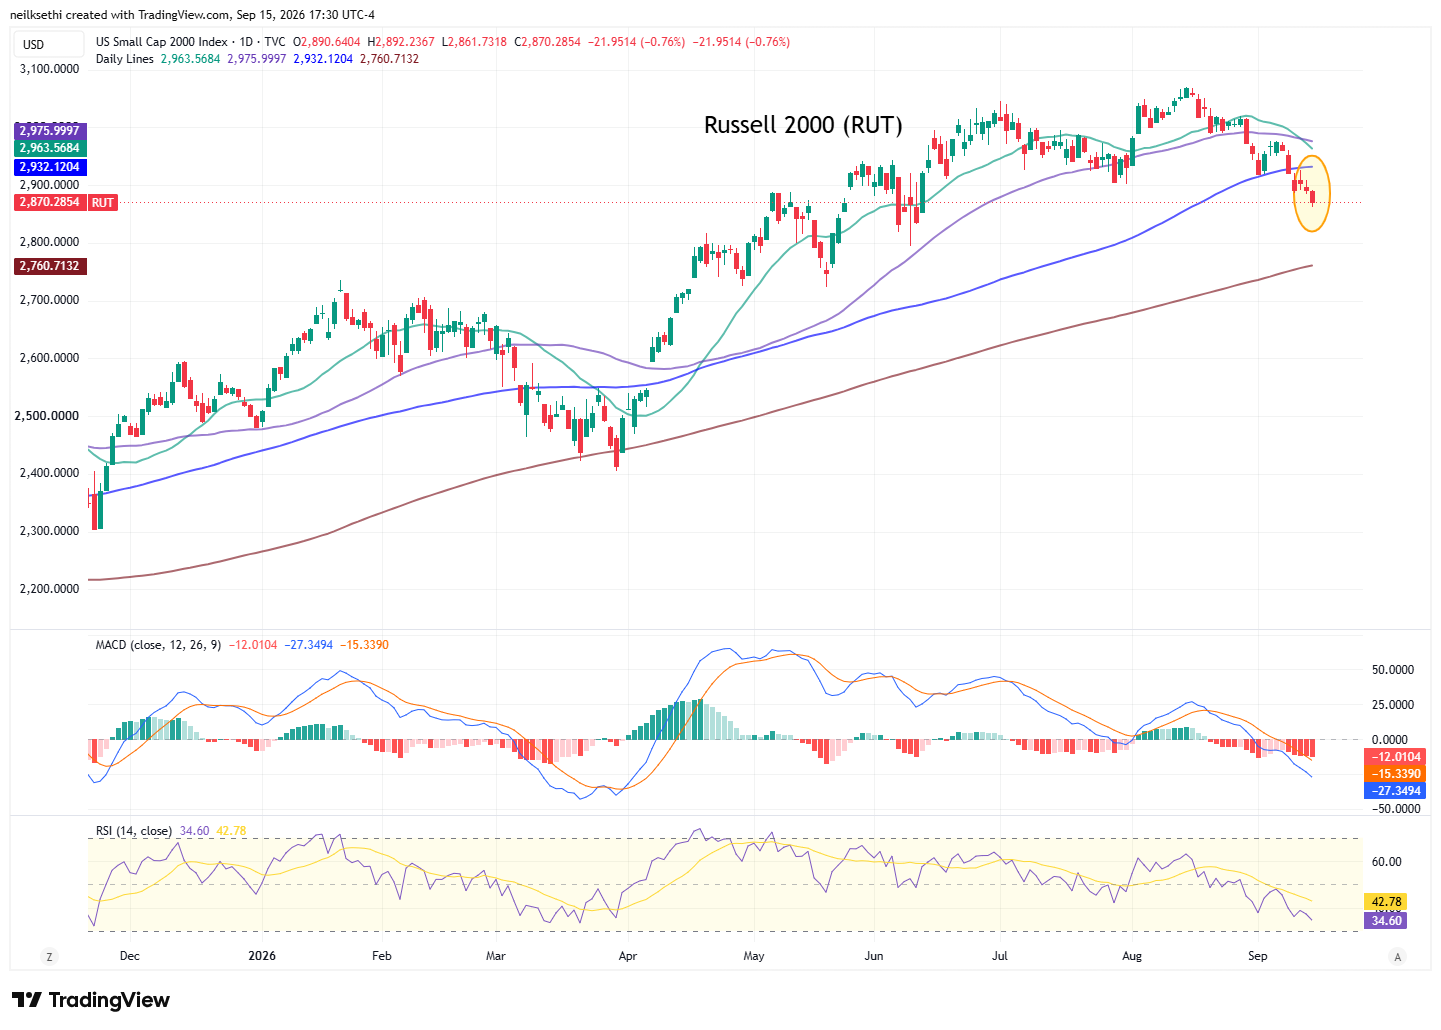
The Russell 2000 (RUT) I said Wednesday was “much more problematic,” and that remains the case. As mentioned last Tuesday its MACD is now in “go short” positioning, and its RSI is now below 40. As I said Wednesday “I am not long this index, but … I’d be out until it at least recovered the 100-DMA.”
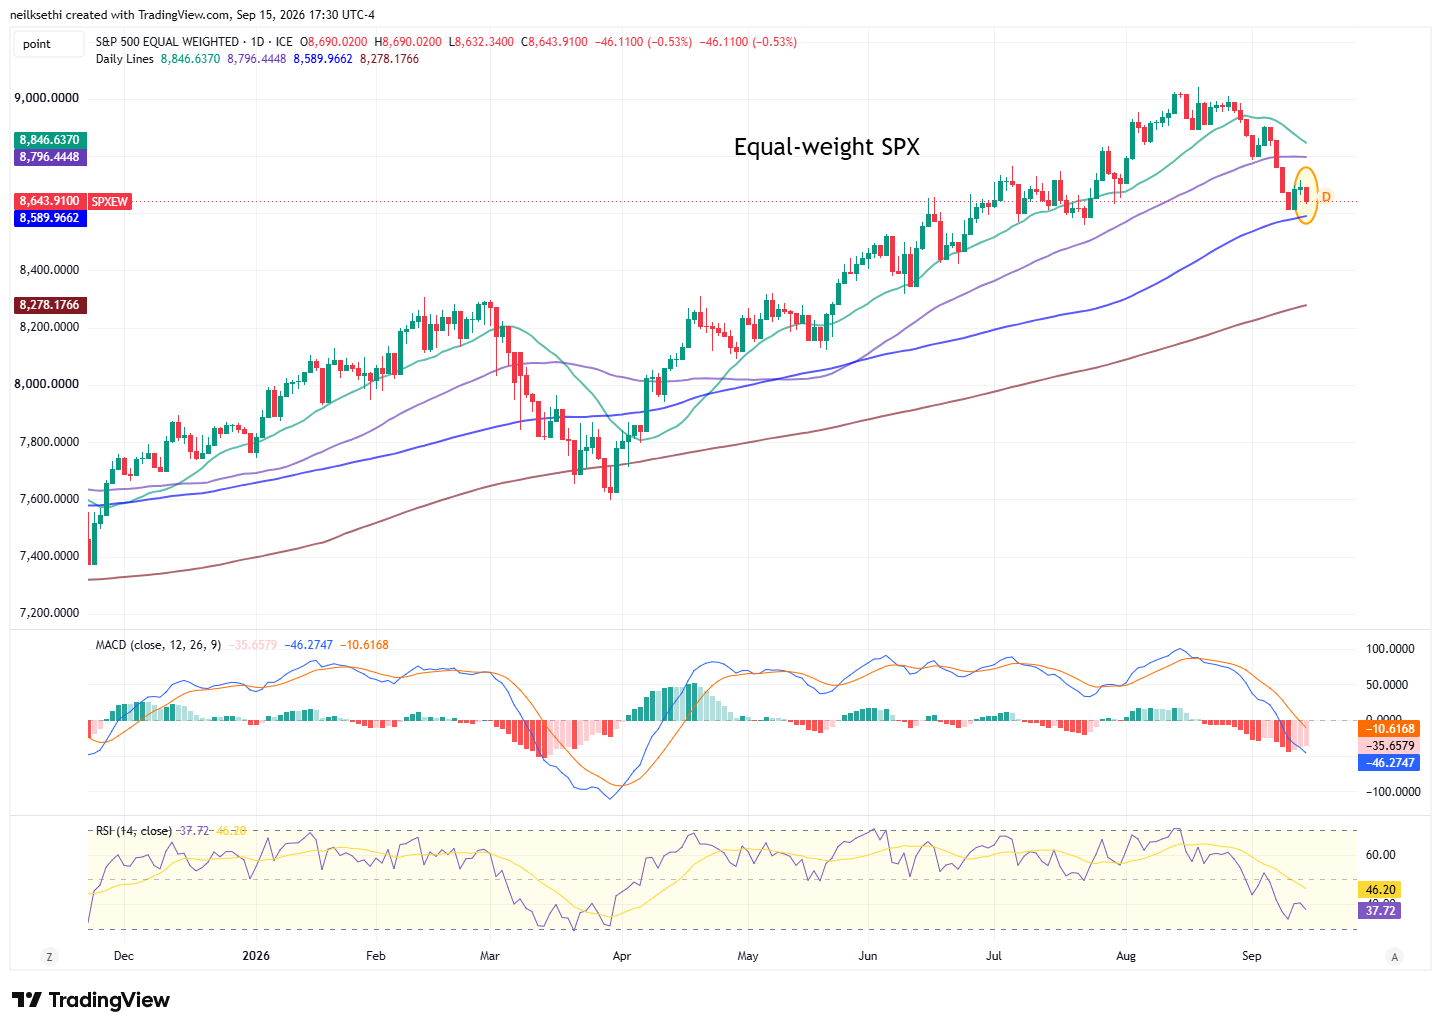
The equal-weighted SPX I noted Friday was no longer the most concerning chart “as the RUT has taken that role,” but I mentioned last Tuesday “I did take off most of my holdings in (RSP) for now. I’ll be looking for a tradeable bottom to form.” As I said Friday “I had thought the 100-DMA might offer some support, and this is a nice start, but we’ll need to see a lot more before adding.” Today was not necessarily a step back as it did not make a lower low, so consistent with a bottoming formation.
Treasury yields bear steepened mildy with the longer end moving higher while the short end was little changed (bearish because it implies Fed rate hikes):
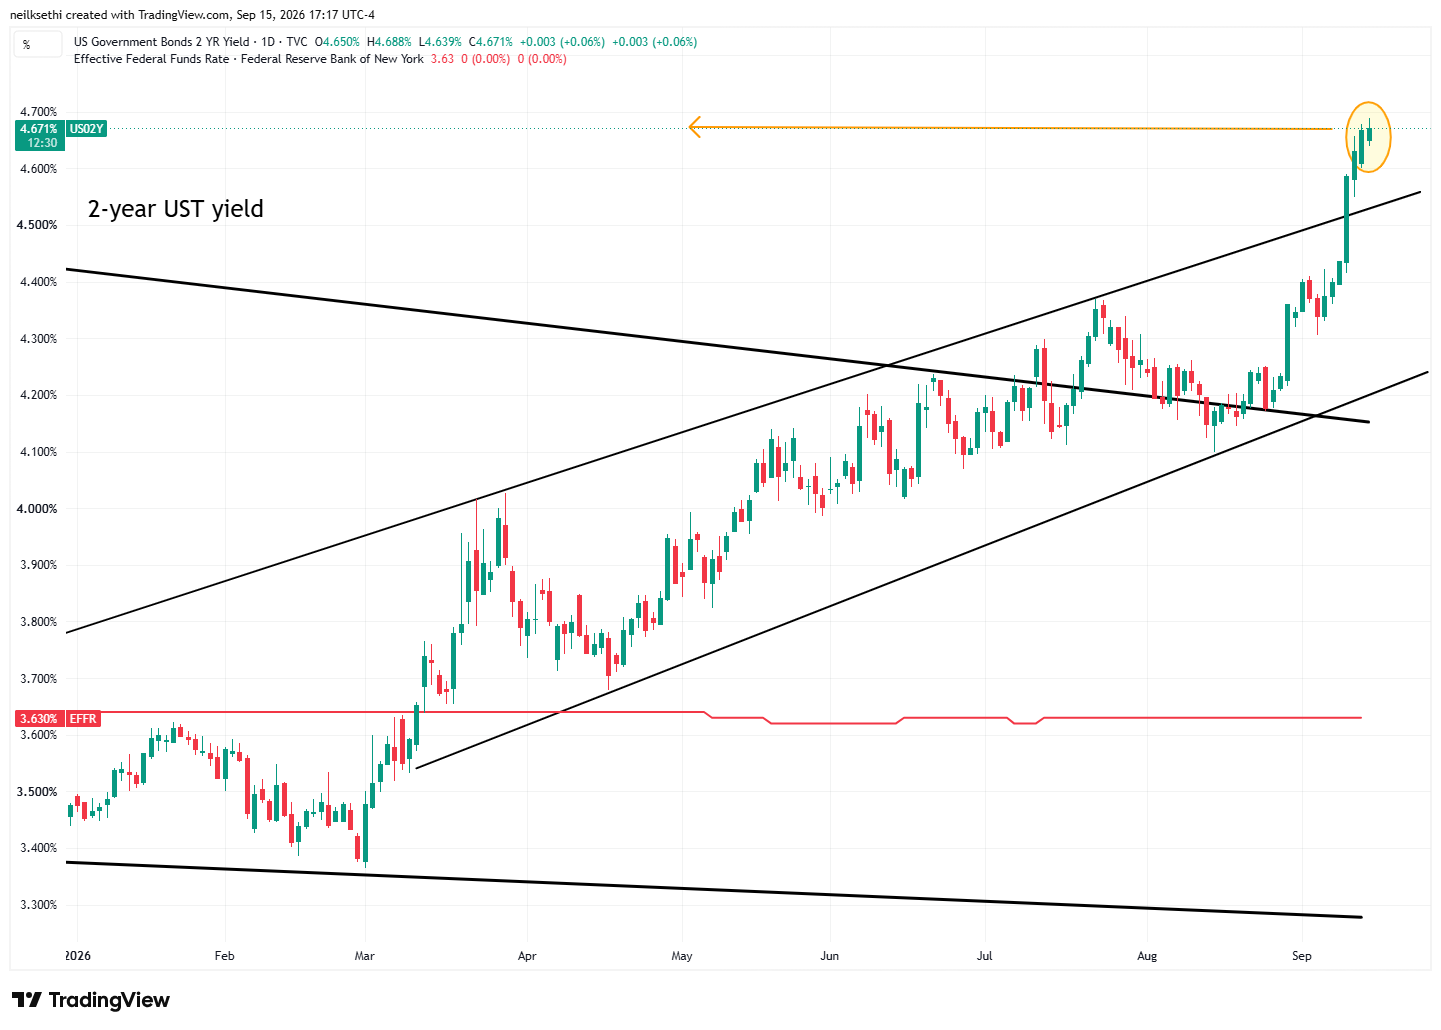
The 2-year Treasury yield remained at 4.67%, the highest close since July 2024. It’s now well above its trend channel, which I had said Friday was “signaling either it’s breaking out or it’s become extended and is in need of a pullback.” So far seems like the former. Still, as I mentioned “we’ll likely not find out for sure which until Wednesday.”
It is over 104 basis points above the Effective Fed Funds rate (red line), screaming for rate hikes. That’s the furthest above the EFFR since November 2022 when the Fed was in the middle of its historic tightening campaign.
Ahead of the Fed meeting FOMC rate hike expectations were little changed. The September meeting eased to a 92% chance. Two rate hikes this year remain fully priced (actually 52 basis points) and through 2027 there’s nearly four hikes priced (96 basis points). As I said Friday, “don’t see how the Fed doesn’t hike next week absent some sort of media tip that they are planning on not going.”
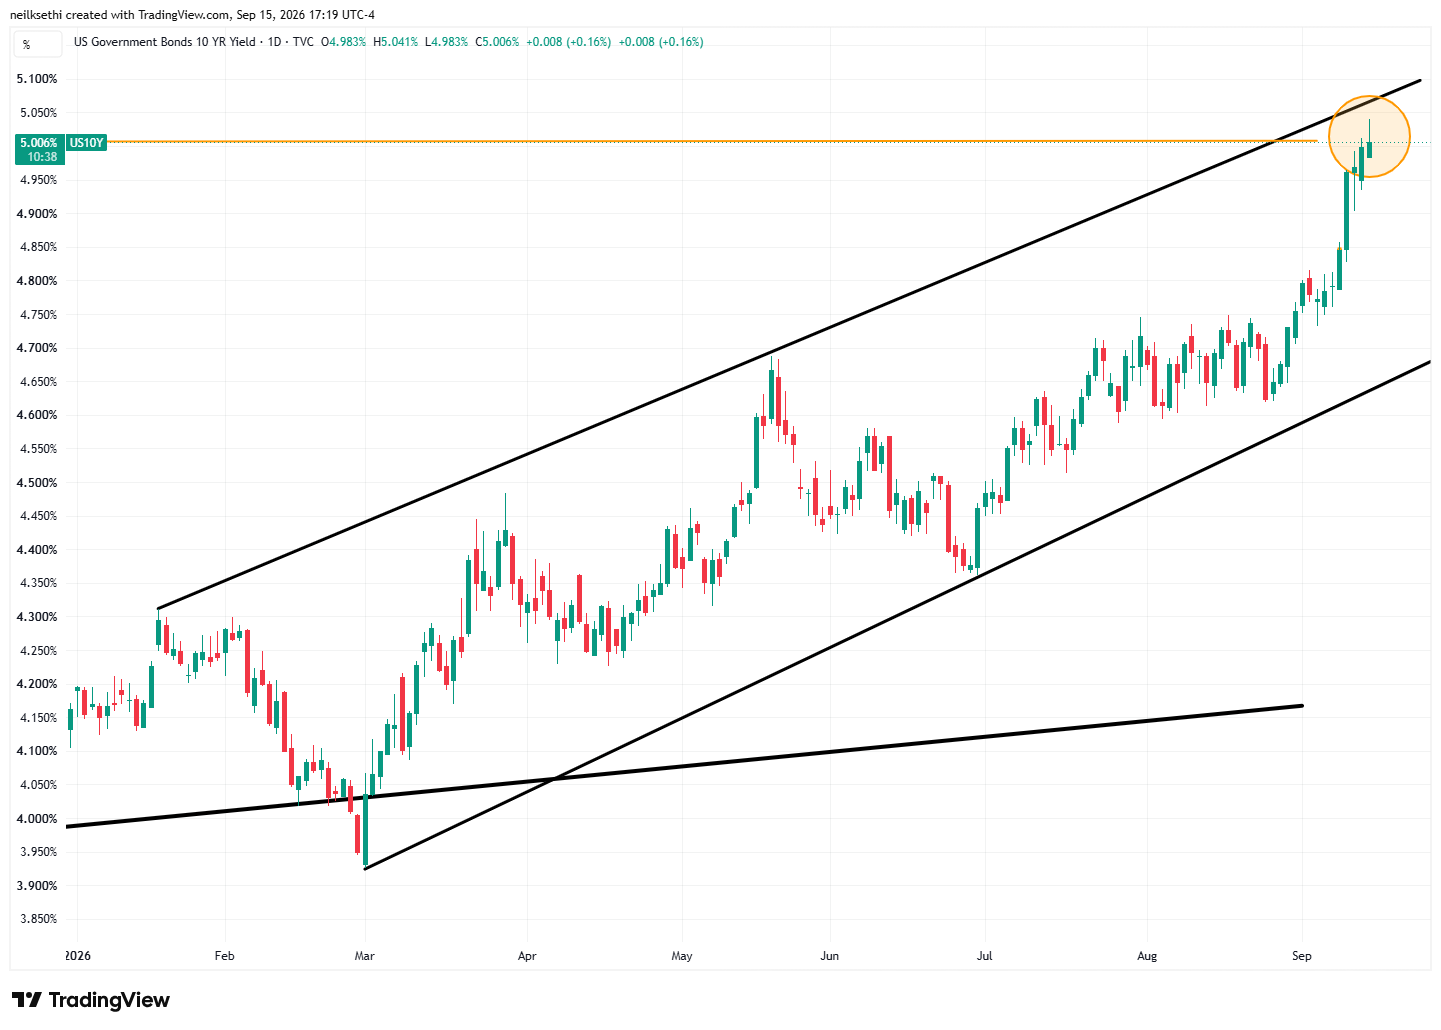
10-year yields at one point hit 5.04% for the first time since 2007 as noted in the morning update (see charts there) before again easing back but still ending the extended session at 5.006%, the highest close since then.
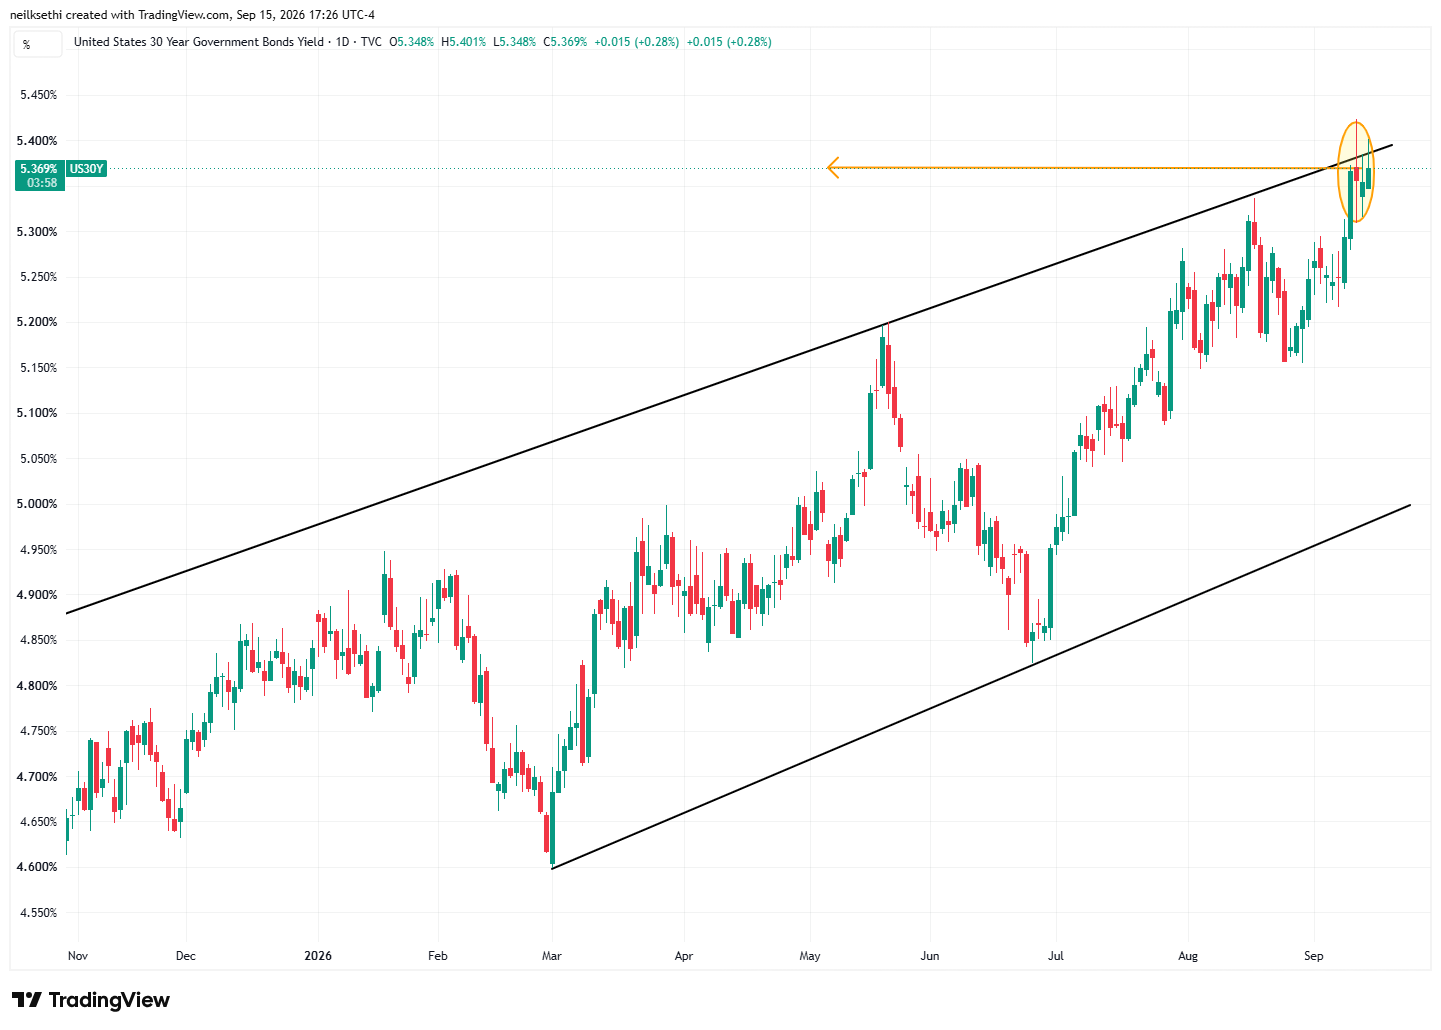
30-year yields edged up two basis points to 5.37%, but that was enough for the highest close since 2007 (July) as well. It remains right at the top of its uptrend channel.
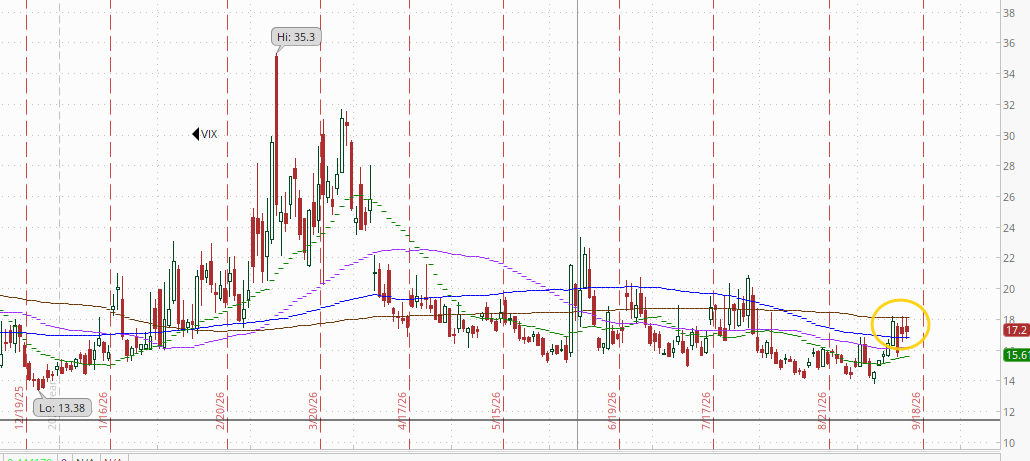
VIX again failed at its 200-DMA for a third session ending little changed at 17.2. That’s consistent with ~1.08% average daily moves in the SPX over the next 30 days.
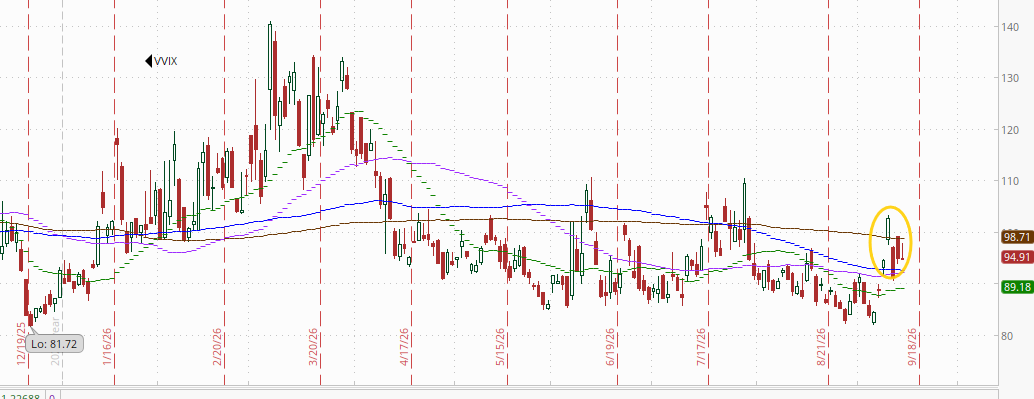
The VVIX (VIX of the VIX) a similar story unchanged at 94.9.
The current level is consistent with “moderate” daily moves in the VIX over the next 30 days (historically, normal is 80-100). Above 100 is the level flagged by Charlie McElligott as indicating higher stress.
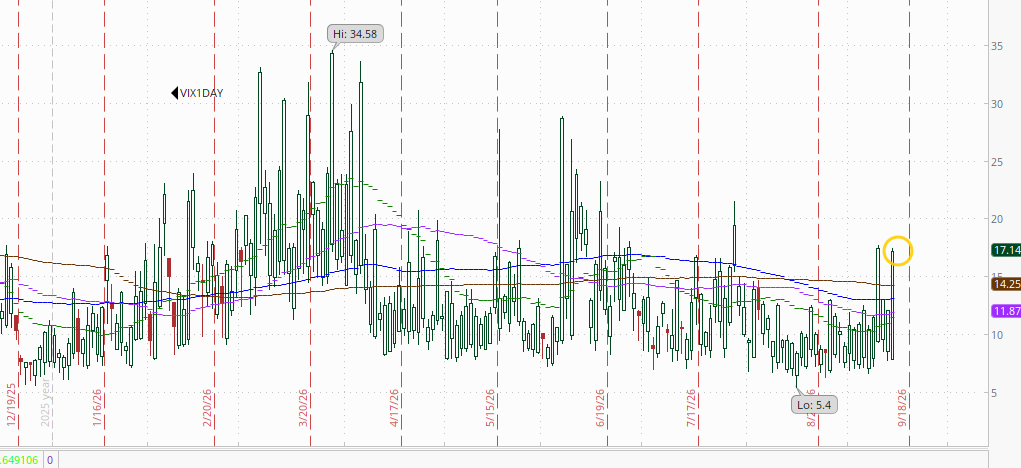
While the 1-day VIX shot higher per my note yesterday “as the FOMC comes into the picture,” to 17.1, right around levels pre-CPI day. The current reading isconsistent with a move of 1.07% in the SPX next session.
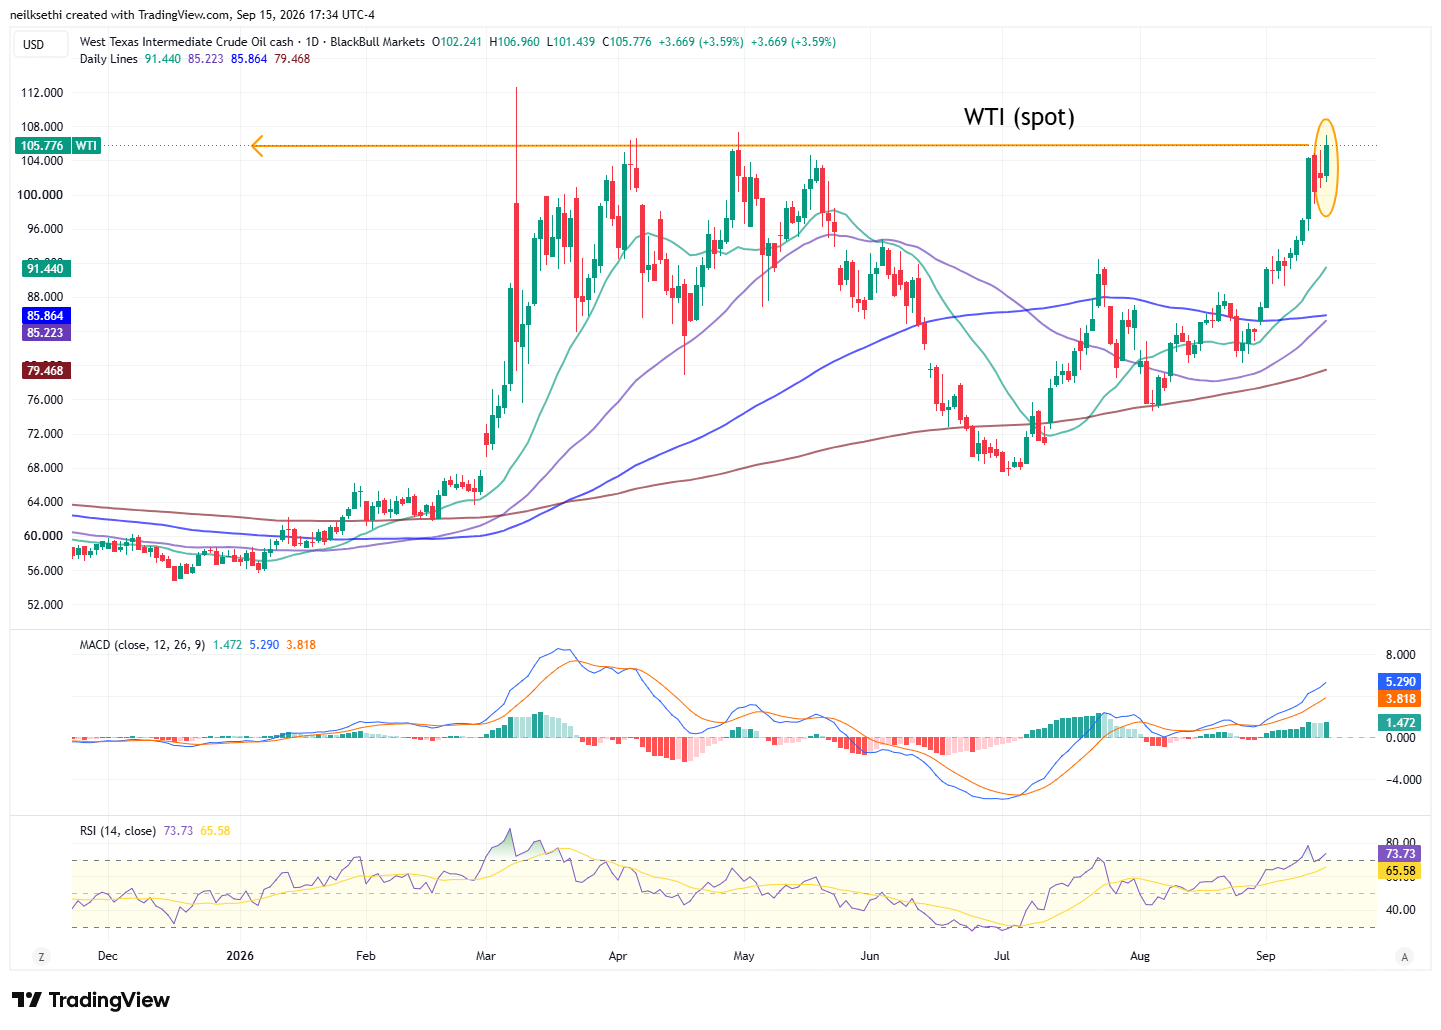
WTI (cash) up another 3.6% to a new post-2022 high at $105.78.
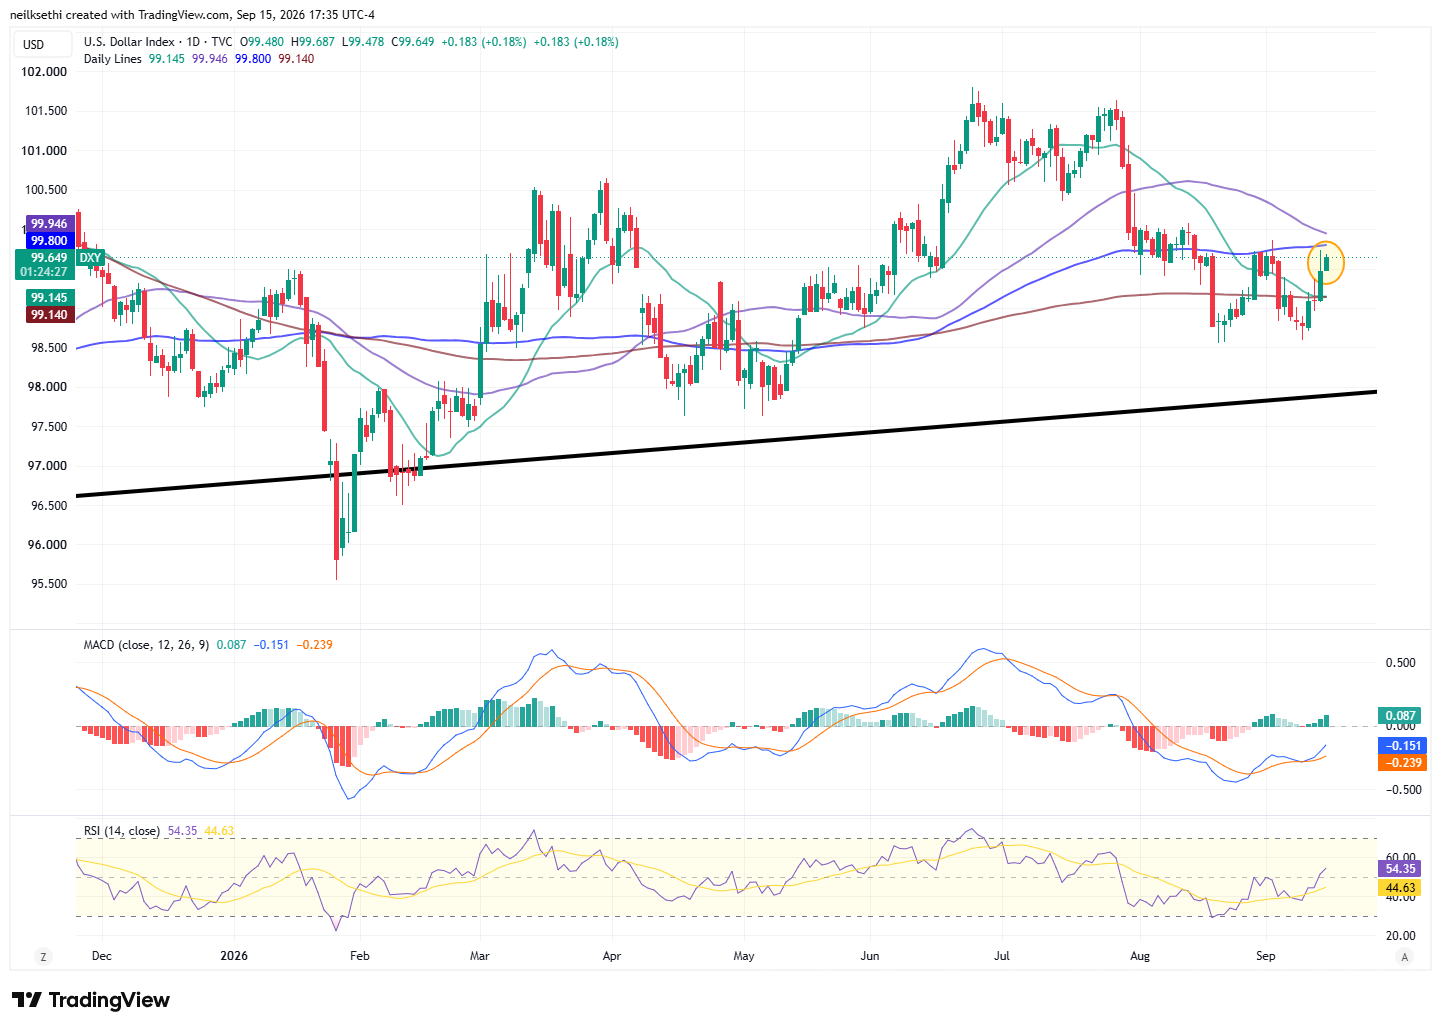
The DXY dollar index (which is fixed weighted with a heavy (57%) weighting vs the euro), continues to struggle with the same resistance area as two weeks ago. As I mentioned Monday, “It will need another catalyst to get through that.” This likely moves a lot tomorrow.
The daily MACD remains positive and the RSI is now above 50. If it can get through the 100 level it could really run.
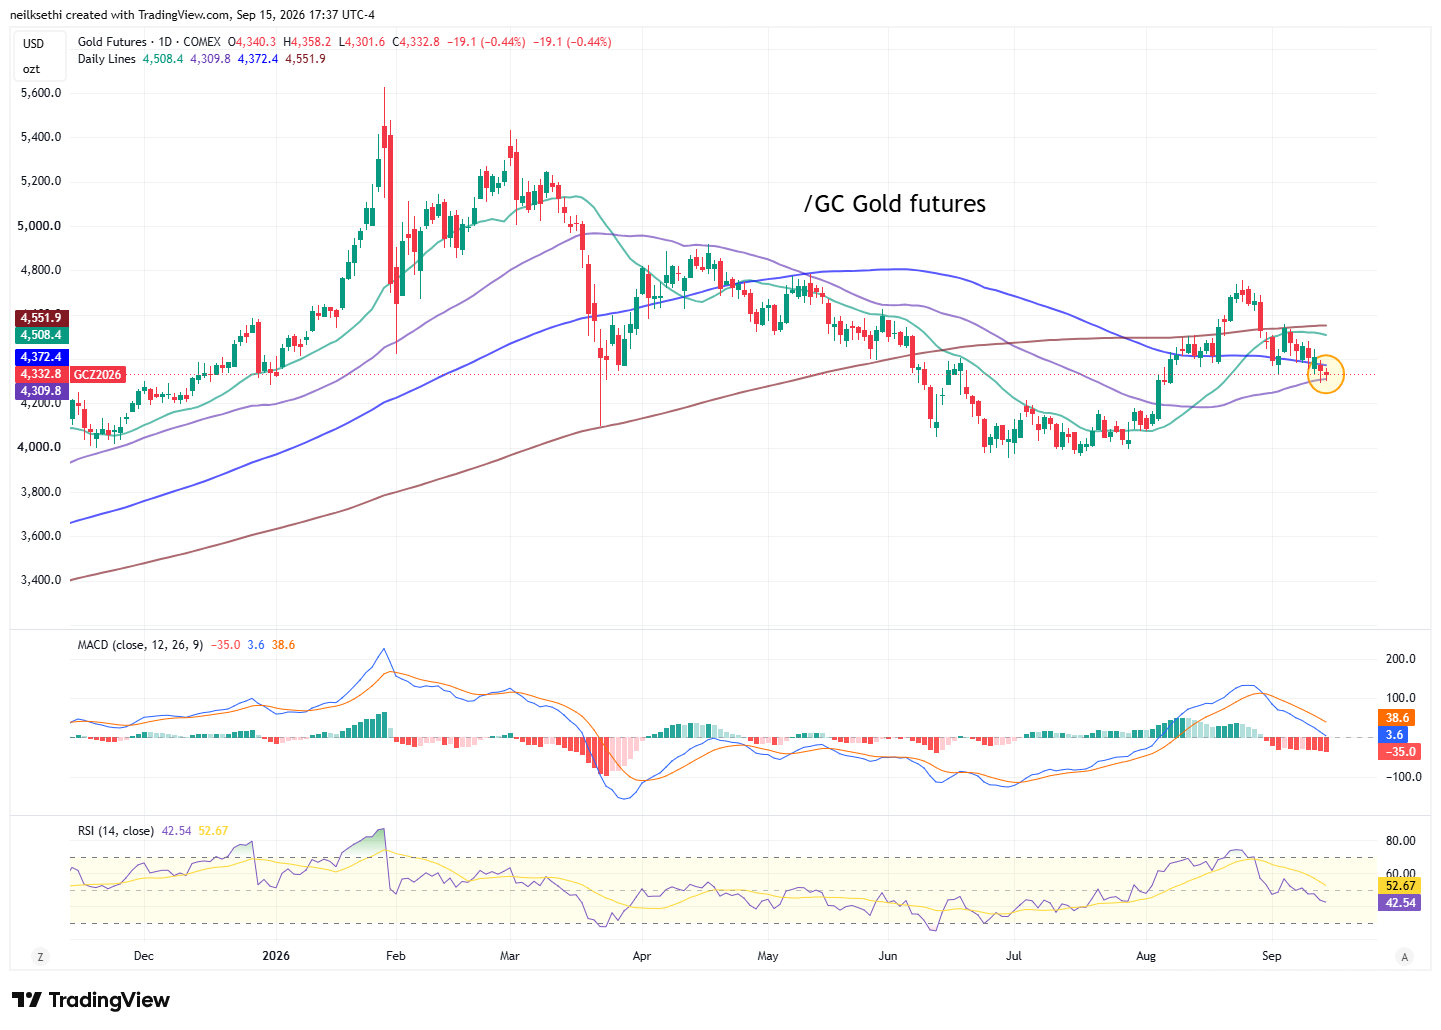
Gold futures (/GC) continued to hold the 50-DMA. The daily MACD remains negative and the RSI is under 50. As mentioned at the start of the month, “I will wait for it to get back over the 200-DMA to add back what I took off when it fell below.” That said, if it can continue to hold here and the technicals firm up, I may take a shot. Long way from that now though.
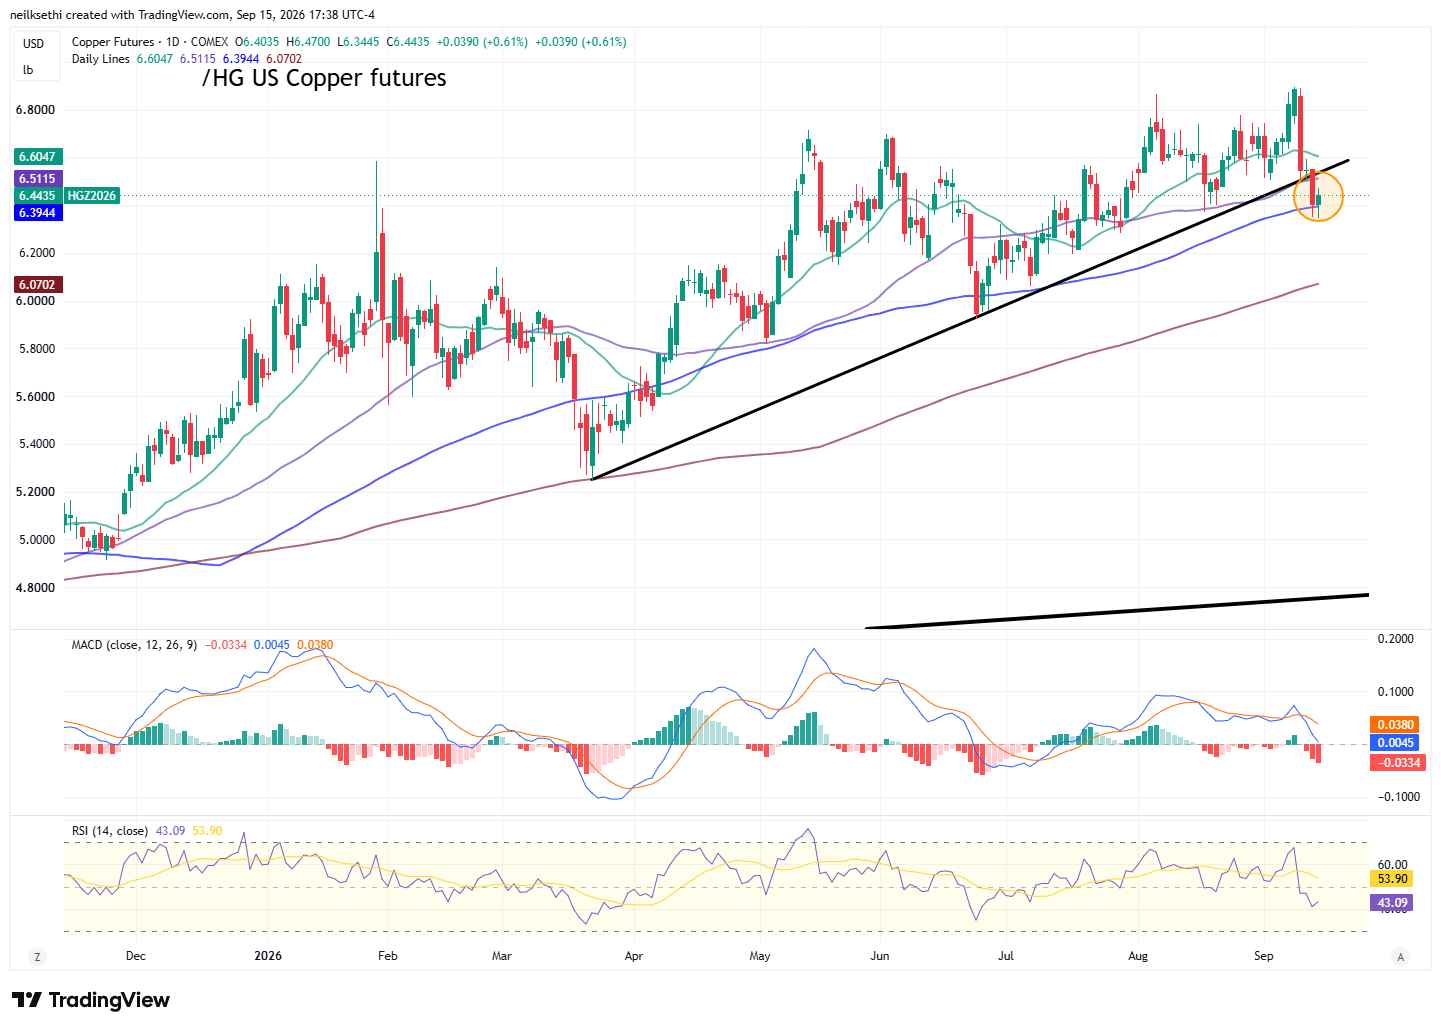
US copper futures (/HG) able to hold the 100-DMA. As mentioned Monday though “Technicals turned much more bearish, so as promised I took off half until it reclaims the 50-DMA. If it breaks the 100-DMA I might take off more.”
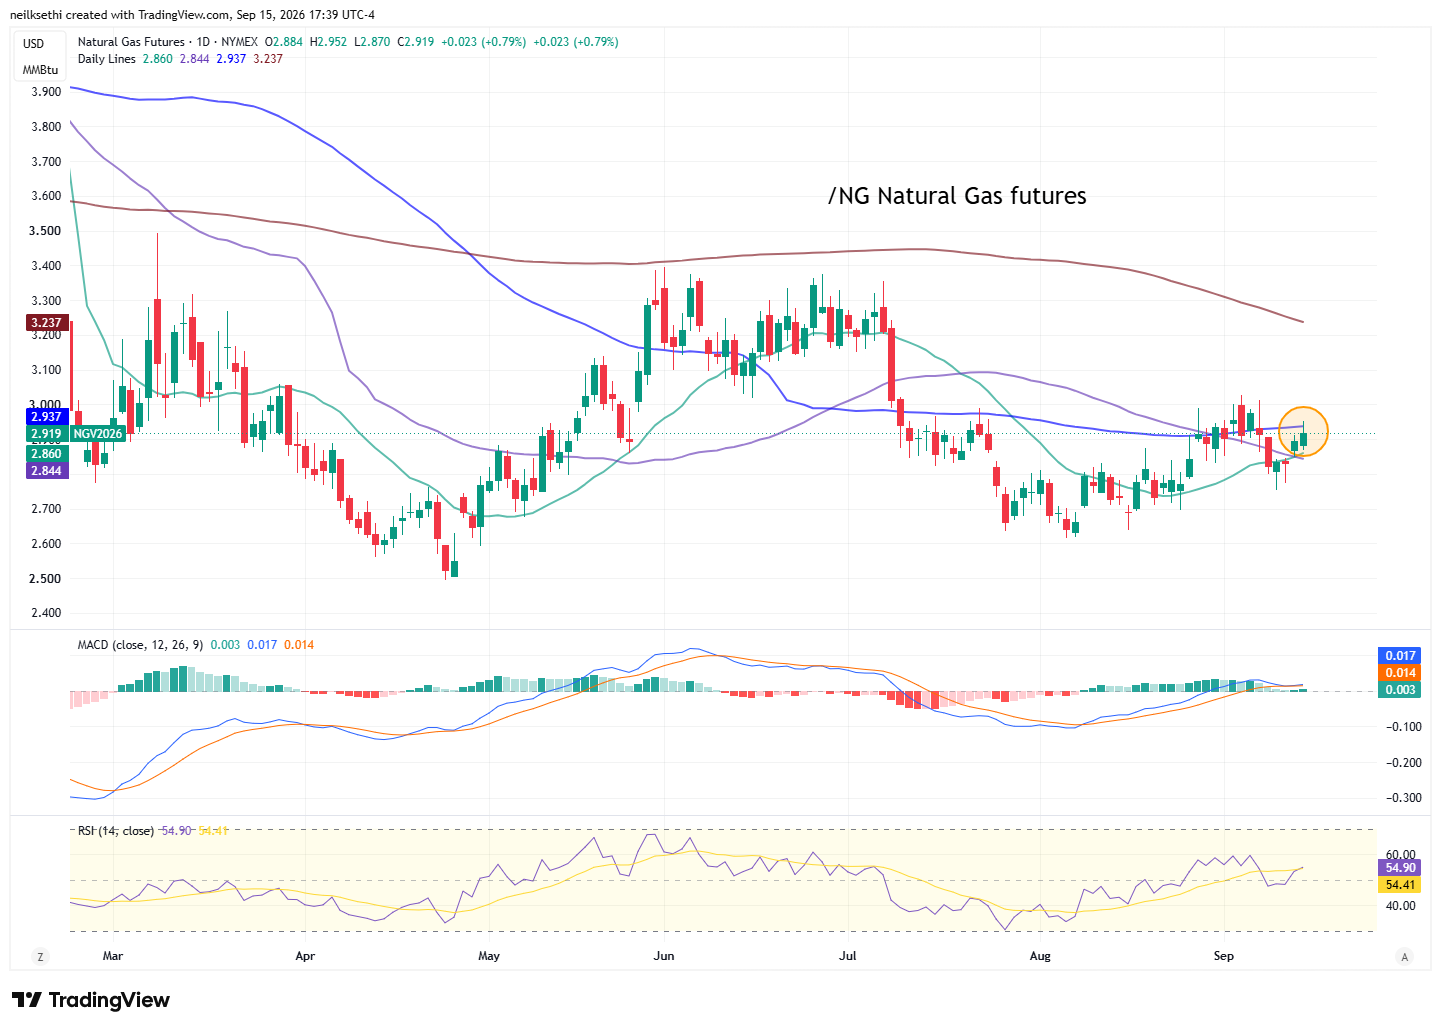
US natural gas futures (/NG) as noted last week “now back to trading in their range since the start of July.”
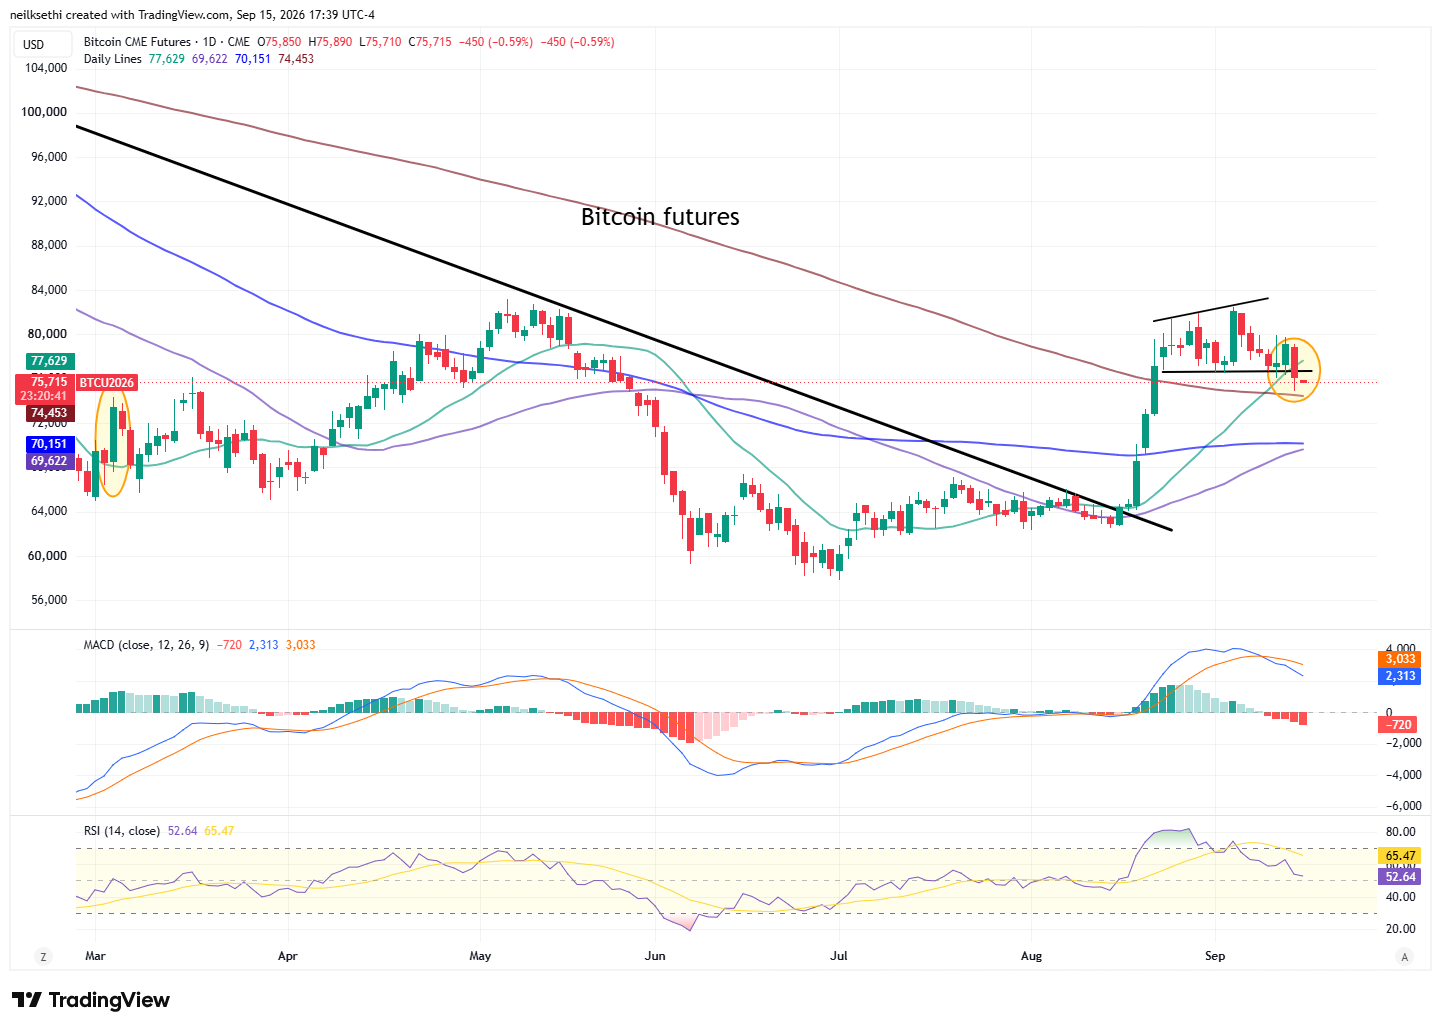
Bitcoin futures fell back nearly 4% after the Clarity Act failed to pass. I had said I would sell if they broke the bottom of the bull flag, but they seemed to find support at the 200-DMA, so I trimmed a little but kept most of the position to see if they can regather strength. Daily technicals are deteriorating though so it won’t take much to convince me to exit and wait for a better reentry spot.
More From TheStreet Pro:
- James “Rev Shark” DePorre – Investors Are Not Optimistic About the Fed
- Chris Versace – Rise in Diesel Prices Becomes Headwind for Margins and Earnings
- Bob Byrne – Wall Street Fears an AI Slowdown. I’m Not Buying It
Miscellaneous:
Wrap-Up – The Market Supports Are Thinning
I noted Monday:
I wrote at length in the Week Ahead about the narrowing margin for error, and from all appearances this morning things were headed very much in the wrong direction, but as we’ve seen more often than not the past four years, markets proved more resilient than expected with investors simply taking the AI-selloff as an opportunity to buy into the rest of the market, particularly names which had been beaten down due to AI concerns (software, hyperscalers, etc.).
That does fit with the “oversold” breadth metrics I noted, so there does seem to be some scope for this to continue I suppose, especially with an almost empty calendar again tomorrow in the US.
We also might very well see a bounceback in AI names if investors rethink how much slowing there really might be.
And while we did get some bounceback in the AI names, the rest of the market fell back, not unexpected on a day that oil prices and bond yields are at or near multi-year (in some cases multi-decade) highs.
Equities are pressing against key support levels and downside pressures are building ahead of what can only be expected to be a volatile reaction no matter what we get with the FOMC tomorrow. One way or the other, tomorrow will serve as a near-term clearing event, and we should hopefully have a better grasp on where things are headed.
The Day Ahead – Here We Go
After a very light start to the week (at least in terms of the calendar) we hit the accelerator Wednesday.
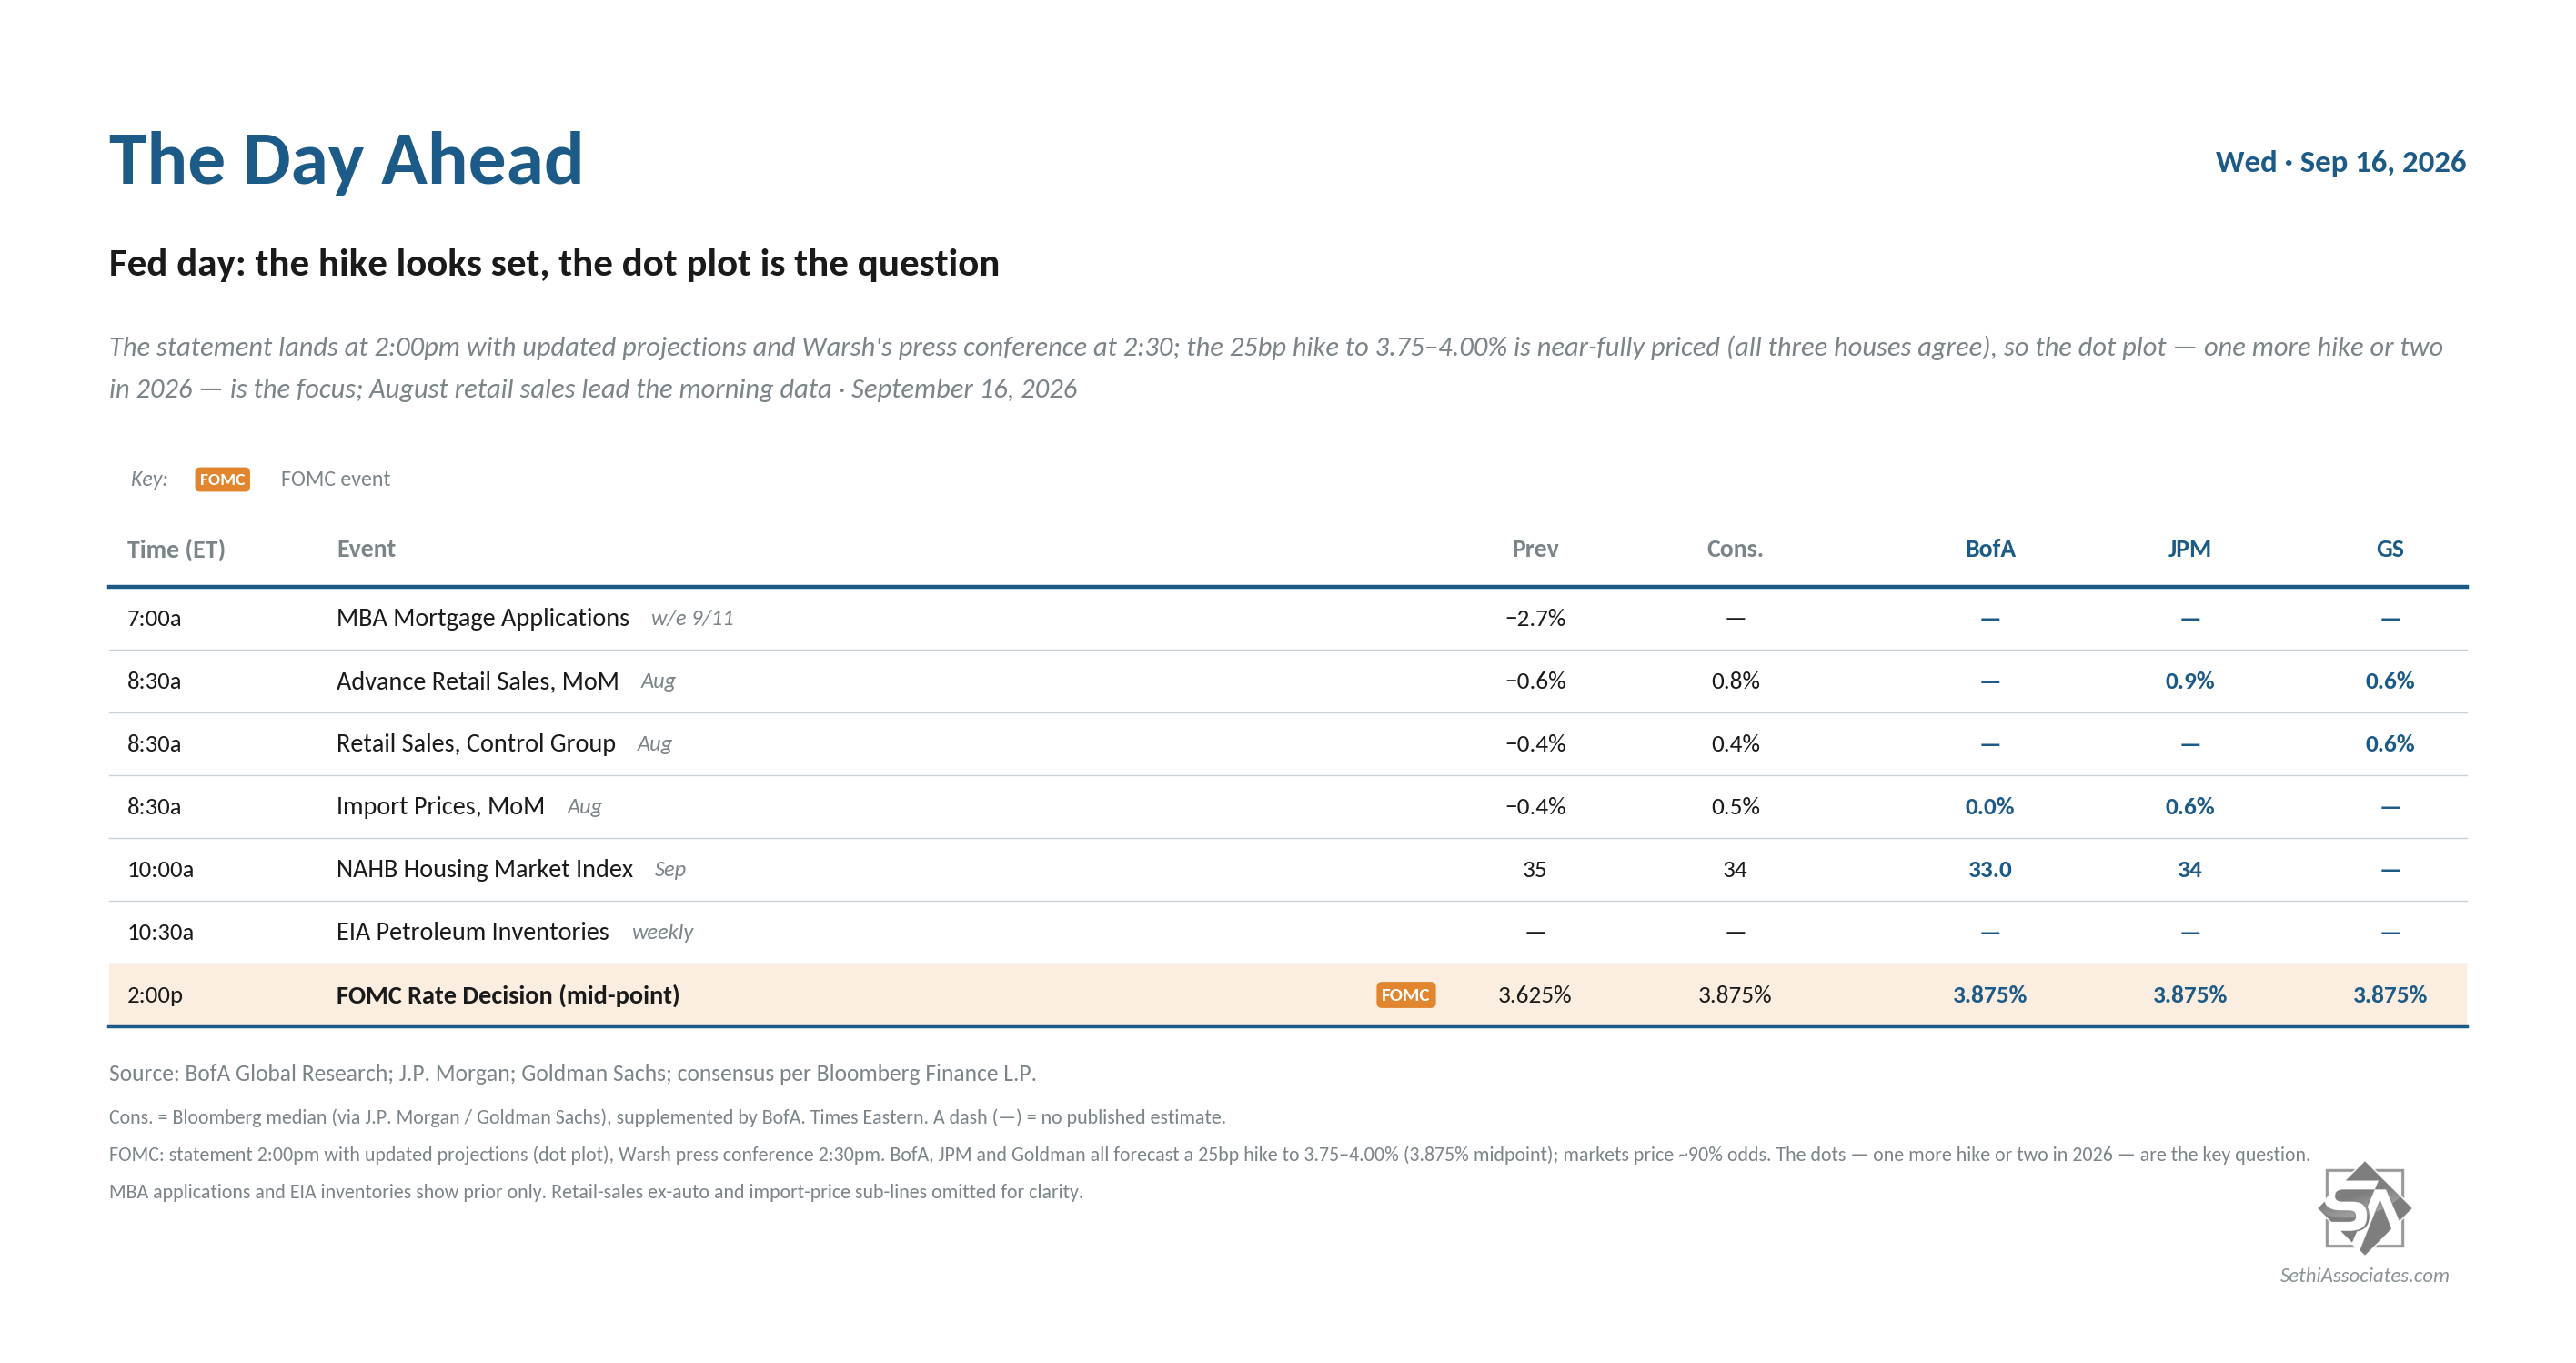
US economic data picks up with one of our most watched second-tier reports in retail sales (for August). We’ll also get August import prices as well as the September NAHB (home builder) housing market index along with weekly mortgage applications and US petroleum inventories.
But that all takes a back seat to the September FOMC decision. As I wrote in the Week Ahead: “Endless digital ink has been spilled in the lead-up, but it appears that, like it or not, Chair Warsh is boxed in to delivering the hike the market has now almost fully priced in (he did say he wanted the markets to lead not follow, and lead they are). Absent what would be a very surprising decision to hold (or raise by 50 basis points), attention will quickly turn to the future path (how many more hikes). In that regard, we’ll be getting an updated Summary of Economic Projections (SEP), which will have a new dot plot that will tell us a lot based on where the dots are aligned for 2026 (and give us our first look at 2028). It will look a lot different than the last one for sure.” The SEP will also provide updates on the committee’s new expectations for GDP, unemployment, and core PCE prices. And of course there will be the press conference. See the Week Ahead in the Fed section for a lot more on all of these topics.
Non-Bill (>1yr in maturity) US Treasury auctions are off.
No SPX components reporting.
Ex-US highlights are Bank of Canada minutes, UK August CPI, RPI, PPI, July house price index, Japan August trade balance, Eurozone July industrial production, Canada August housing starts.