Howling About Diesel
Wolf Street howls about a possible runaway inflation train.
Position: None
BY Doug Kass · Sep 22, 2026, 3:26 PM EDT
 Doug KassDoug Kass
Wolf Street howls about a possible runaway inflation train.
Position: None
BY Doug Kass · Sep 22, 2026, 3:26 PM EDT
Position: None
BY Doug Kass · Sep 22, 2026, 2:10 PM EDT
I would continue to avoid buying (and “bottom fishing”) in Netflix (NFLX) for the reasons I have previously mentioned:
* Netflix has nearly saturated the domestic market (as well as many other developed countries). These markets are significantly more profitable than the non developed arena.
* Future Netflix sales/profit growth will come from developing country markets that provide substantially less revenue (and income) per subscriber.
* Netflix’s original content programming has been unspectacular over the last 12 months (or more) — and existing content has suffered.
In the past I have been short NFLX, but it is no longer priced as an attractive short.
Position: None
BY Doug Kass · Sep 22, 2026, 1:50 PM EDT
Position: None
BY Doug Kass · Sep 22, 2026, 12:56 PM EDT
Position: None
BY Doug Kass · Sep 22, 2026, 12:16 PM EDT
Position: None
BY Doug Kass · Sep 22, 2026, 12:05 PM EDT
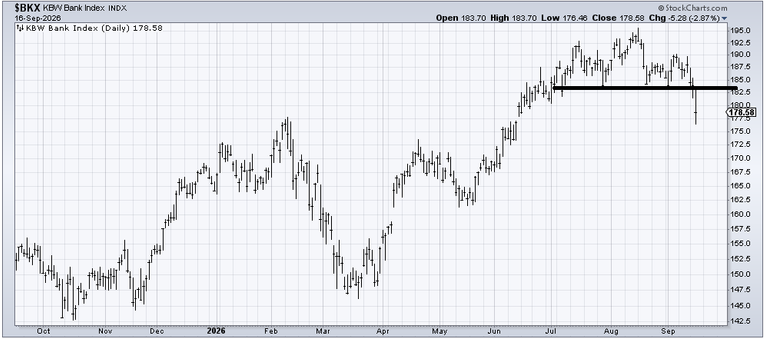
I warned about the breakdown in financial stocks five days ago – highlighting this chart on Sept. 17 :
It was from this column:
* Hint: It wasn’t the Fed’s rate rise…
*As financials go, so goes the market…
“Things seen are temporal; things unseen are eternal.”
– John Calvin
My answer?
The rollover in bank stocks.
So while the business media dwells on what yesterday’s Fed action means for monetary policy over the next six months, my focus is elsewhere…
From The Divine Ms M this morning:
“On Wednesday, the banks finally broke, and folks finally noticed how weak they have been. There is a short-term measured target on the Bank Index around 175, but look at all that resistance it has left overhead now.”
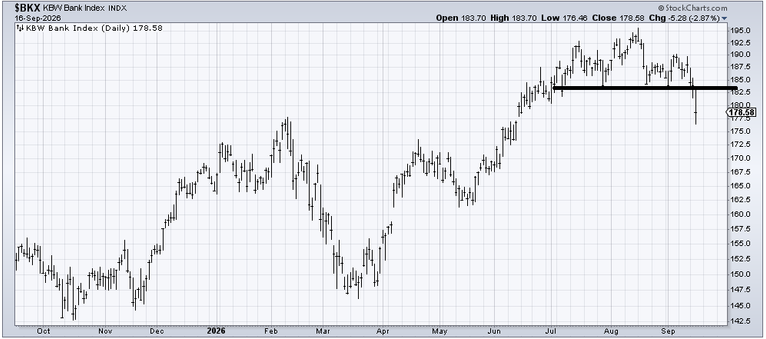
– Helene Meisler “A Lesson in Market Sentiment: Consider Whose Party Is Bigger, Bulls or Bears?“
As financials go — so goes the market.
Position: None
BY Doug Kass · Sep 17, 2026, 6:40 AM EDT
Position: None
BY Doug Kass · Sep 22, 2026, 11:35 AM EDT
Howard Marks’ latest commentary: Shall We Repeal the Laws of Economics – Part III
Positions: None.
BY Doug Kass · Sep 22, 2026, 11:10 AM EDT
Run don’t walk to watch Carter, Guy and Dan on MRKT Call at 11 a.m. for value added views and “optionable” ideas.
And above, all honesty and transparency.
MRKT Call – Tuesday, September 22nd – YouTube
Positions: None
BY Doug Kass · Sep 22, 2026, 10:55 AM EDT
Quote of the Day from his column:
My warning to subscribers remains the same: do not confuse the price blinking on your screen with some immutable statement about economic reality.
This isn’t the stock market of the 1980s or 1990s. We now have zero day options, enormous passive vehicles, algorithmic strategies, volatility products, dealer gamma hedging and trillions of dollars responding mechanically to price.
After more than a decade of zero rates, QE and monetary intervention, I increasingly think we’re staring at a financial mirage, a fiat driven, QE induced hallucination where price temporarily becomes its own justification.
Nothing feels particularly real anymore.
But that’s the funny thing about a mirage, it all looks perfectly real right up until you try to drink the water.
Positions: None.
BY Doug Kass · Sep 22, 2026, 10:45 AM EDT
The following is from Peter Boockvar:
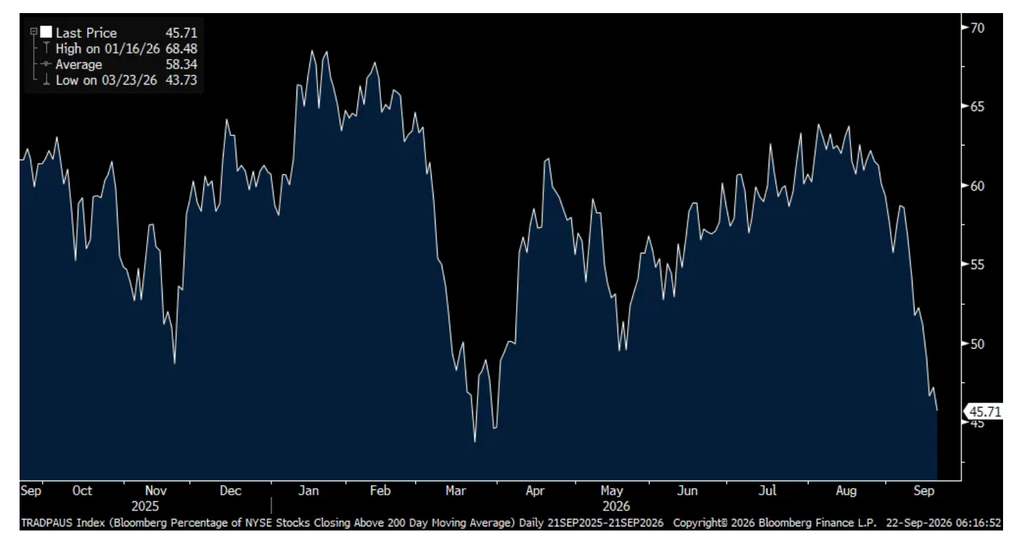
I wish there were more people invited to this party. The excitement around the AI trade and now the potential of agents being our personal assistant I get but it comes with apathy towards most everything else. I say this because yesterday just 46% of the stocks that trade on the NYSE closed above its 200 day moving average. That was down from Friday, lower from about 64% one month ago and the least since March.
Also, I saw this tweet from the very good data miner Jason Goepfert:
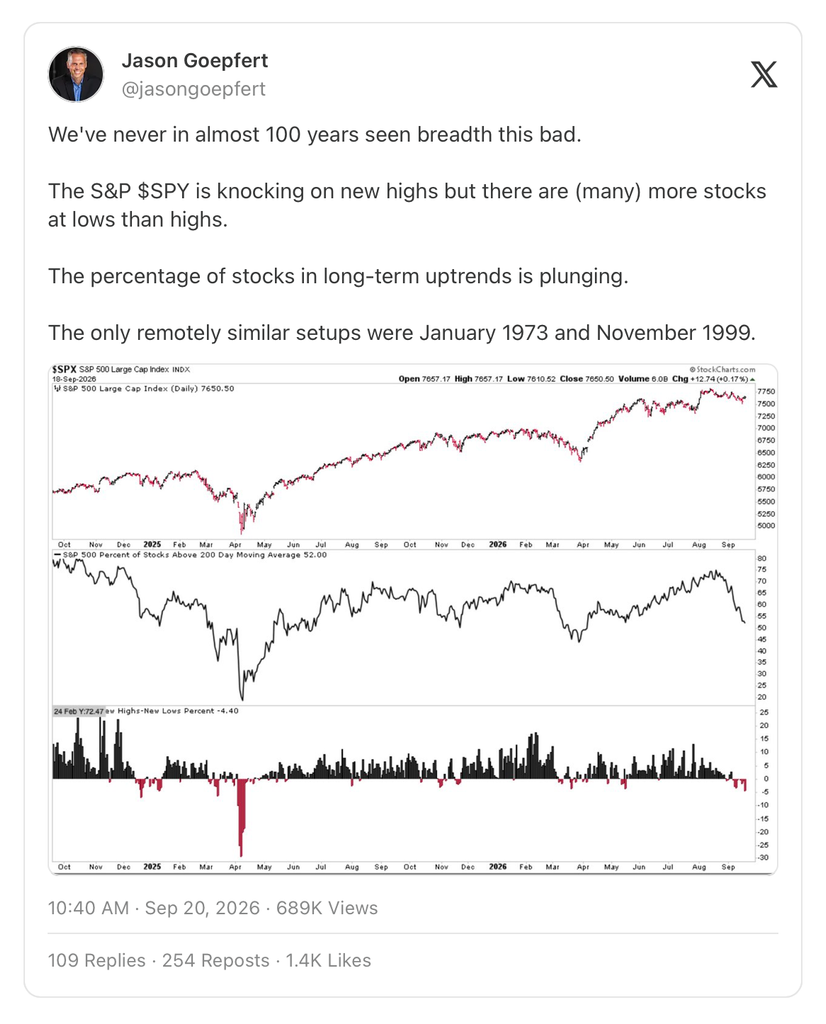
In addition to owning some AI stocks, as a holder of many stocks that aren’t, I certainly hope that the laggards catch up rather than the leaders catch down.
% of NYSE Stocks trading above its 200 day moving average
I mentioned yesterday the price increase that Old Dominion Freight announced. Also out yesterday were price increase announcements on different acetyl chemicals by Celanese of about 4.5%. This chemical ends up in clothing, skincare/cosmetics, pharma products, paints, glues, lumber to name a bunch.
This gets to my point again that wholesale inflation is throughout the supply chain but pricing power of the business that sells direct to the consumer is the determining factor as to the flow thru to consumer prices.
Ahead of the Trump/Xi gathering, I’ll just say this. I think it’s a good thing that the two largest economies get along and unhindered trade takes place between our two nations as we both need each other. That said, we know China has been doing its best to rely less on the US ever since Tariff War 1.0 was launched against them in 2018. The US as we know has only now realized it needs to rely less on China, particularly with rare earth magnets and other key things like pharma ingredients.
Further evidence today of China’s growing presence on the global tech stage, “Alibaba Group Holding has introduced what it called China’s most powerful artificial intelligence chip and teased plans to train an AI model with up to 10 trillion parameters, as top executives reaffirmed the tech giant’s ambition to pursue artificial superintelligence (ASI)” said the South China Morning Post today.
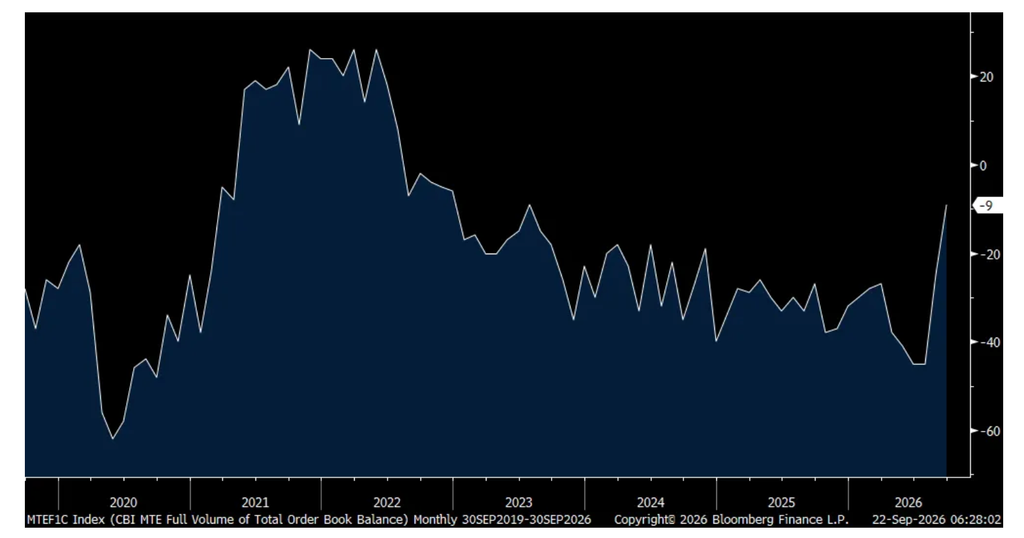
We’ve seen a global manufacturing recovery take place this year after about 3 years of contraction and that was further confirmed today by the nice lift in the UK CBI Industrial Orders index for September which rose to -9 from -25. The estimate was for weakness to -35.
CBI said “There are growing signs that conditions are stabilizing for manufacturers, with a marked improvement in order books for the 2nd consecutive month – taking them to their strongest in more than three years. Output is also now falling only marginally and selling price expectations have eased considerably from the highs seen following the outbreak of conflict in the Middle East.”
That said, “While these are encouraging signs, it is still too early to call this a sustained recovery, with manufacturers continuing to face high supply chain, energy and employment costs.”
CBI Industrial Orders Index
BY Doug Kass · Sep 22, 2026, 10:25 AM EDT
* Apropos to my “Not Broadening” column earlier today…
As the financials go, so goes the market is the “old saying.”
JPM -$8
C -$2
SCHW -$5
GS -$10
MS -$4
Well, financials are truly stinking up the joint!
Positions: None
BY Doug Kass · Sep 22, 2026, 10:14 AM EDT
Positions: None.
BY Doug Kass · Sep 22, 2026, 9:59 AM EDT
* Now sees an increased likelihood of future scenarios in which inflation remains notably above 2%
* While the upside risks to inflation have increased, labor market conditions seem a bit stronger overall
* With the labor market on a better footing, monetary policy can focus on a timely return to price stability, especially after five and a half years of too high inflation
* Somewhat more restrictive federal funds rate will help ensure that inflation durably returns to target
Positions: None
BY Doug Kass · Sep 22, 2026, 9:46 AM EDT
Yesterday’s The Dales Report with Shadd Dales and Andrew O’Connell had alot of value-added information.
Positions: None.
BY Doug Kass · Sep 22, 2026, 9:45 AM EDT
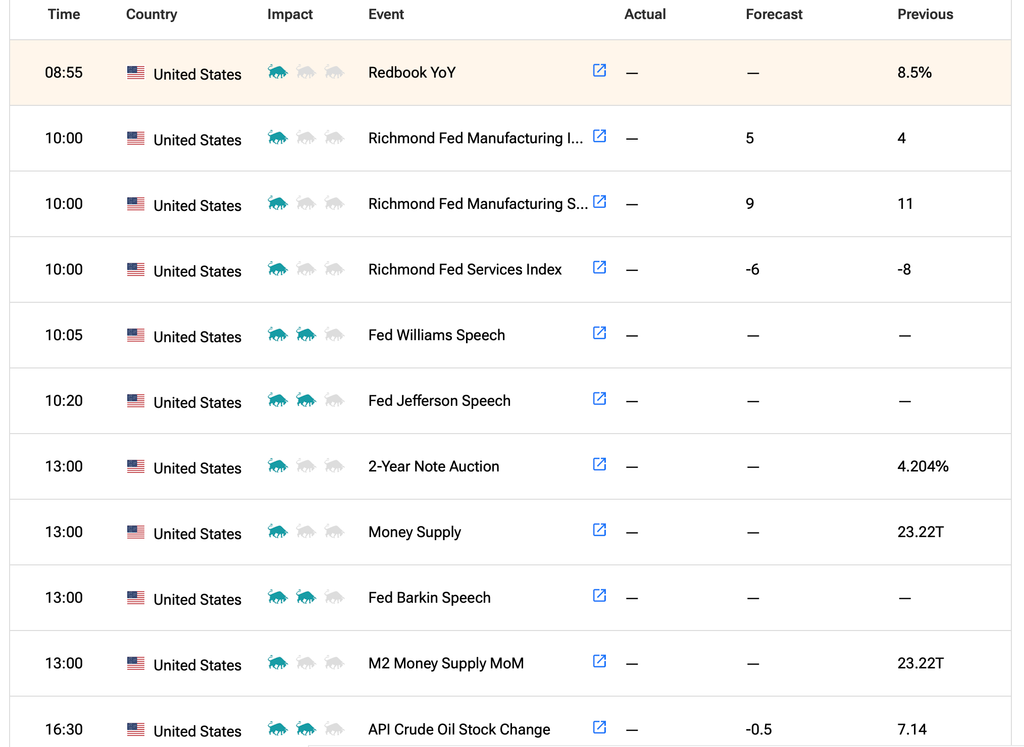
10:05 a.m.: Fed Bank of New York President Williams (Voter) speaks before the 2026 Treasury Markets Conference hosted by the Federal Reserve Bank of New York, NYC (Text expected. Q&A is not. Livestream at https://www.newyorkfed.org/);
10:20 a.m.: Fed Vice Chair Jefferson (Voter) speaks before the 2026 Treasury Markets Conference hosted by the Federal Reserve Bank of New York, NCY (Text available. No Q&A. Livestream at https://www.newyorkfed.org/);
1:00 p.m.: Fed Bank of Richmond Barkin (Non-Voter) will speak at the CFA Society Baltimore, MD (Text posted at speech time at www.richmondfed.org. Audience Q&A expected. No livestream)
Positions: None.
BY Doug Kass · Sep 22, 2026, 9:30 AM EDT
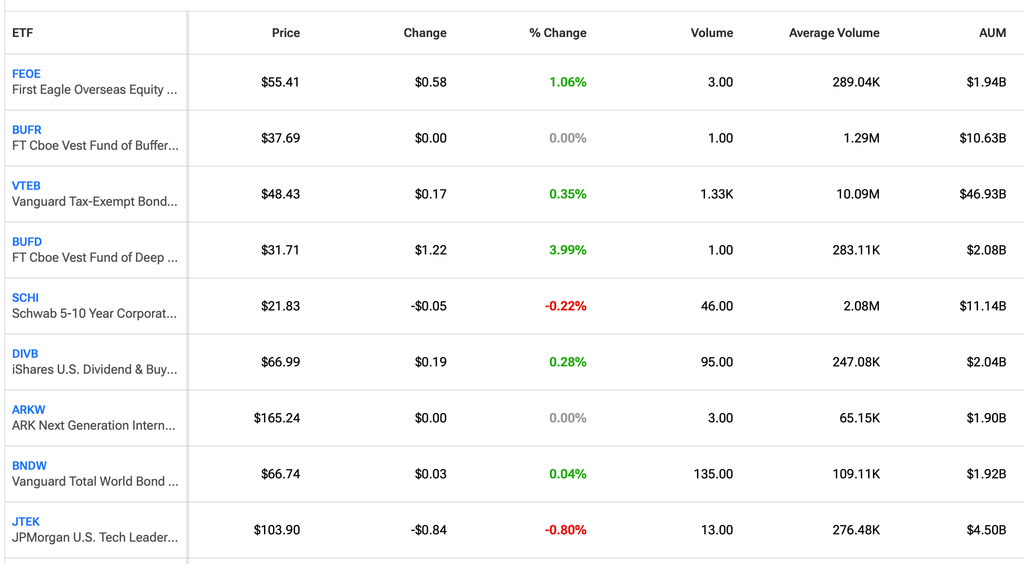
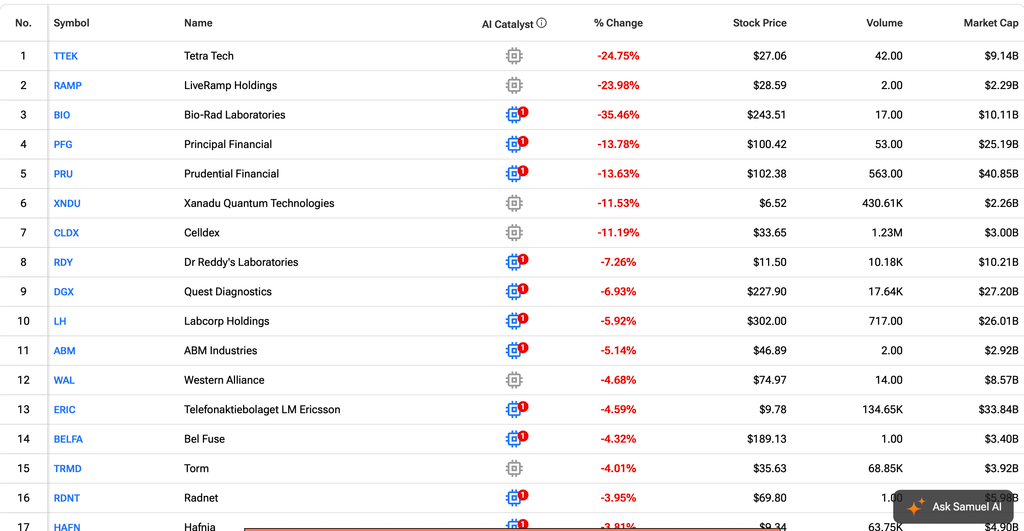
Pre Market ETF Decliners
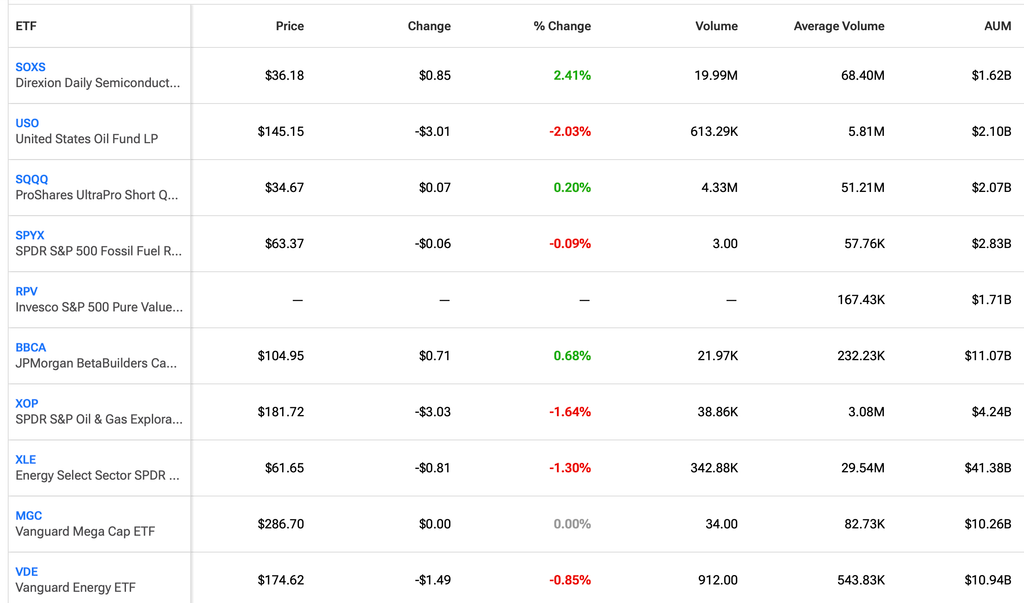
Source: TipRanks
BY Doug Kass · Sep 22, 2026, 9:25 AM EDT
– GRML +44% (extends the high-volume Greenland critical-minerals momentum rally)
– VKTX +25% (positive VK2735 maintenance data showed strong weight loss and high retention with biweekly and monthly dosing)
– VICR +8.7% (raises Q3 sequential revenue-growth guidance to more than 20% from nearly 10% on V4PD-license royalties)
– ONON +8.0% (sets high-teens constant-currency sales growth and 22%+ EBITDA-margin targets through 2029 and authorizes a $1B buyback)
– SHOP +5.1% (no clear fresh catalyst identified; unusually large premarket move in a highly followed stock)
– RCL +2.4%, CCL +3.0%, NCLH +2.7% (cruise operators rise as crude drops, easing fuel-cost pressure)
– FSLR +1.8% (rate-sensitive solar shares benefit as Treasury yields retreat)
– CLDX -20% (positive Phase 3 CSU results trigger a sell-the-news reaction after the anticipated binary readout)
– DAVA -13% (CFO placed on leave amid an internal accounting investigation disclosed in a 6-K)
– LH -6.2%, DGX -6.9% (CMS proposes laboratory reimbursement cuts of up to 15% beginning in 2027)
– VLO -2.1%, PSX -2.0% (energy names fall as crude drops on easing geopolitical risk)
– STX -1.4%, WDC -1.4% (storage names pull back with the semiconductor complex after the prior session’s AI-driven rally)
SOURCE: Trade The News
BY Doug Kass · Sep 22, 2026, 9:16 AM EDT
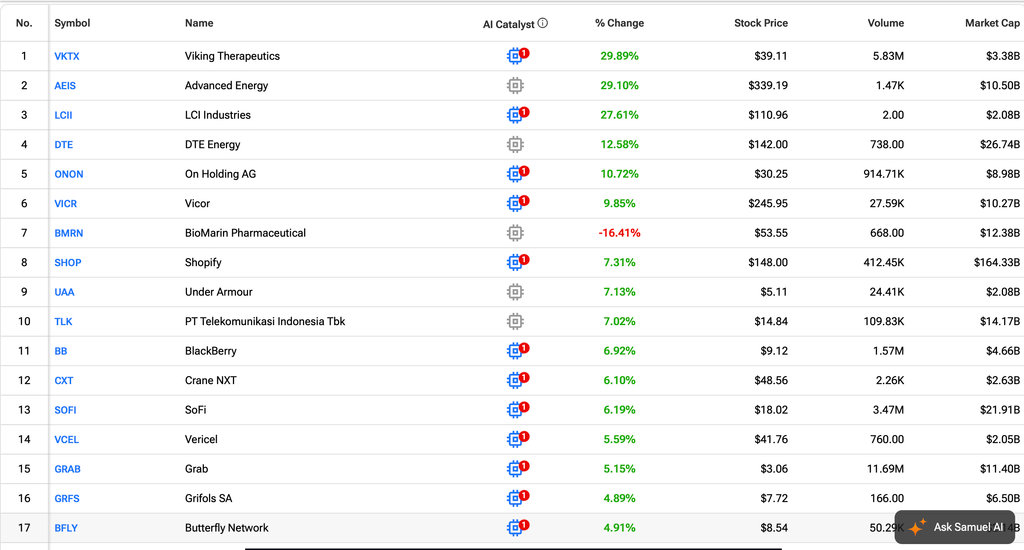
Source: TipRanks
BY Doug Kass · Sep 22, 2026, 9:10 AM EDT
Source: TipRanks
BY Doug Kass · Sep 22, 2026, 8:48 AM EDT
Trulieve (TRLV) has been added to several indexes. Trulieve Cannabis Corp. Added to S&P Total Market and S&P Completion Indices – Sep 22, 2026
Trulieve is the first cannabis stock included in these indexes.
As noted in my Diary I have been adding to this name recently.
Positions: Long TRLV S
BY Doug Kass · Sep 22, 2026, 8:33 AM EDT
Positions: None.
BY Doug Kass · Sep 22, 2026, 8:24 AM EDT
The second column I wanted to repost is the discussion of valuation models that I promised deliver last week:
* But were afraid to ask
* My preferred valuation model indicates that the Fair Market Value of the S&P Index is approximately 6600 – or about 13% to 14% lower than the 7650 close on Friday (precision is not intended!)
* Valuation models are notoriously poor timing tools but in the long run the market is a weighing machine and not a voting machine
* Every valuation model (absolute and relative) yields the conclusion that stocks are overpriced
* Specifically, the relative valuation models (price to sales, enterprise value to earnings before interest, taxes, and depreciation, Shiller CAPE, Buffett Ratio, etc. are all the 90 percentile) are hinting that stocks may be even more overpriced than my models
* Equities have ignored an 80-basis point increase in the Ten Year Treasury note yield since the beginning of the year — this is strange as consensus expectations were for one or two federal fund cuts in January compared to the two to three hikes now anticipated for the full year
* If my AI concerns are realized over the next 15 months, there is downside risk to consensus 2027 S&P EPS expectations $410/share) – so my 6600 fair market value may have to be revised lower
“This is Mrs. Bencours, one of my patients. She thinks she’s a sheep. That’s all.”
– Dr. Doug Ross (Gene Wilder), Everything You Always Wanted to Know About Sex – Woody Allen Movie
Most market valuation models drop into two buckets:
* Absolute Valuation Models that calculate intrinsic value based on fundamental cash flows. (The most popular are discounted cash flow and dividend discount models). I use absolute models in my process. The Gordon Growth Model Explained: Stock Valuation Formula and Greenspan (or Fed) models Fed model are examples of absolute models.
* Relative Valuation Models that price a company against its peer group using financial multiples. (The most popular being price to earnings, price to book and enterprise value to EBITDA). I also use relative models in my process, particularly when they are in the extreme – as the series always mean regresses. Shiller’s CAPE model and the Buffett Indicator are examples of relative models.
As an illustration, the extreme in relative valuation models that exists, is vividly represented in the CAPE:
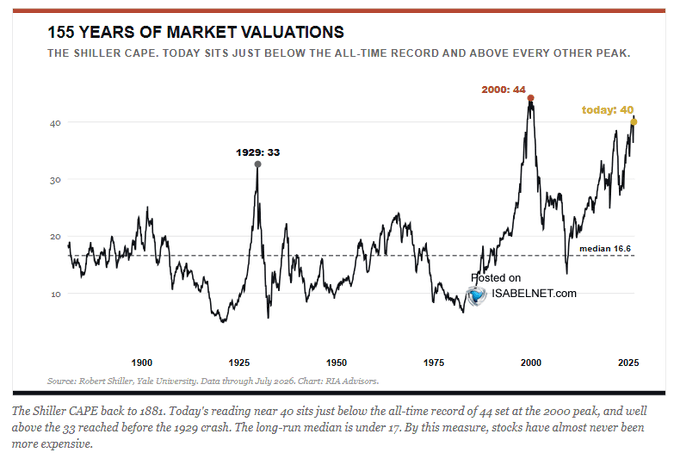
Valuation models are general tools, but not necessarily short-term timing tools to forecast equity prices.
But when in the extreme (as they are now), valuation models warrant attention – as (relating particularly to the relation valuation models (above), in the long run, equities mean regress. Markets, like a pendelum, that overshoot on the upside likely will also likely overshoot on the downside.
That is because there are no new eras, as excesses are never permanent. In every market cycle there will be a hot group of stocks every few years, but speculation fads do not last forever. In fact, over the last 100 years, we have seen speculative bubbles involving various stock groups. Autos, radio, and electricity powered the roaring ’20s. The nifty-fifty powered the bull market in the early ’70s. Biotechs bubble up every 10 years or so and there was the dot-com bubble in the late 90s. “This time it is different” is perhaps the most dangerous phrase in investing.
As Jesse Livermore once wrote:
“A lesson I learned early is that there is nothing new in Wall Street. There can’t be because speculation is as old as the hills. Whatever happens in the stock market today has happened before and will happen again.”
Throughout the last few years I have featured many of the relative valuation models in my Diary, in support of my ursine market view. They have not been good indicators of stock performance since 2023 but in no case in history haven’t these models regressed to the mean.
While I pay I close attention to absolute and relative analyses I am mostly guided by my own model which deals with five different scenarios (ranging from very pessimistic to very optimistic).
In calculating the intrinsic value of the S&P Index I start with attaching a probability to each of five different scenarios (which contain a wide range of outcomes in inflation, interest rates, inflation, economic and profit growth, and I attach valuations to each). I take the valuation implied (hypothetically) of each scenario and multiply by the price/earnings (totaling to 100% probability).
Let’s suppose that the most positive scenario has a probability of 15% and produces a terminal P/E of 30. (We multiply 15% by 30). We do the same calculus for the other four outcomes and total up the valuations and multiply by S&P earnings per share to solve for intrinsic value.
The Ten Year Treasury note started 2026 at approximately 4.20% and is currently 5.00% – an increase of 80 basis points:
The S&P Index started the year with a price/earnings multiple of 22-times (6845 divided by $312/share in 2026 S&P EPS). The current price earnings ratio is 21.2-times (7635 divided by $360/share in 2026 S&P EPS).
Ostensibly, due to the sharp rise in corporate profits (relative to the consensus expectations) over the last 8 1/2 months, investors have generally ignored the rise in U.S. and global bond yields. This is especially surprising considering that we began 2026 with the consensus view that the federal funds rate would be reduced one or two times. Following the recent 25 basis point hike, consensus is now looking for one or two more increases over the balance of the year (for a total of two or three on the year).
The markets have also ignored the models!
The Gordon model indicates that an 80-basis point increase in the risk free rate (Ten-Year Treasury) should lower the S&P’s price earnings ratio by about 5.5points. Standard three stage model indicates a 5 point drop in S&P’s price earnings ratio . The Greenspan of Fed model suggests a four point hit to the S&P’s price/earnings ratio. (All of the above assumes no change in any variables except the change in the 10 year yield). The Equity Risk Premium (which is now an Equity Risk Discount!) indicates similar overvaluation.
Importantly, these (theoretical) price/earnings multiple reductions would yield an even deeper decline in the S&P’s intrinsic value than I have calculated (6,600)!
I observe, input and consider almost every valuation method extant.
Without exception, every model indicates the S&P Index is overvalued.
However, the most meaningful valuation that I depend upon is my own.
As previously noted, my methodology and calculus attaches a probability distribution to five different outcomes (in inflation, interest rates, economic and profit growth, etc.) in order to project the S&P Index’s intrinsic value.
My scenario and probability analysis produces a fair market or intrinsic value for the S&P Index of 6600, compared to Friday’s close of 7650.
In other words, the market is between 13%-14% overvalued. (Other models suggest an even lower fair market value.)
Should my AI concerns be realized, the consensus 2027 S&P EPS forecast ($410/share) is too optimistic and in jeopardy. In turn, my 6600 fair market value would also be too high.
Positions: Short SPY S
BY Doug Kass · Sep 21, 2026, 9:20 AM EDT
Position: Short SPY (S/M)
BY Doug Kass · Sep 22, 2026, 7:00 AM EDT
BY Doug Kass · Sep 22, 2026, 6:40 AM EDT
For those that celebrated the Jewish holiday I wanted to repost two columns from Monday.
The first column is on the deteriorating breadth, updated for yesterday’s performance:
* As previously noted (repeatedly by myself and The Divine Ms M), the market is narrowing — with the Russell not crowing and the equal weighted S&P Index (RSP) rolling over
* Given the narrowing and the valuation model discussion in my upcoming opener, I am planning to expand my short book on the recent rally and strength in the indices
* It feels like deja vu all over again…
Here was Friday’s report card:
SPY +0.30%
QQQ +0.81%
IWM -0.48%
RSP -0.40%
Though S&P futures rose by 21 handles and Nasdaq futures increased by +238 handles on Friday, market breadth continues to have a foul odor as seen by these tweets delivered by Jason Goepfert:
And the correlation between tech stocks and the rest of the market is the lowest in 22 years:
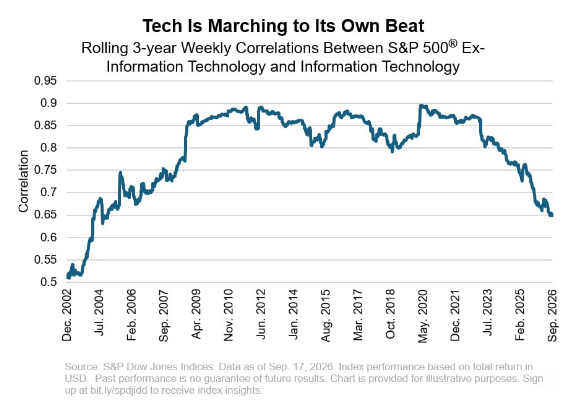
It feels like deja vu all over again.
Position: Short SPY (S), QQQ (S)
BY Doug Kass · Sep 21, 2026, 7:05 AM EDT
Position: Short SPY (S/M), QQQ (S/M)
BY Doug Kass · Sep 22, 2026, 6:30 AM EDT
BY Doug Kass · Sep 22, 2026, 6:15 AM EDT
Position: None
BY Doug Kass · Sep 22, 2026, 6:05 AM EDT
Systematic vs. active:
Position: None
BY Doug Kass · Sep 22, 2026, 5:55 AM EDT
The S&P Short Range Oscillator remains oversold at -5.31% vs. -5.62%.
A couple of subs asked me after yesterday’s amazing ramp higher, how can we still be oversold.
I believe the answer is that the Oscillator is based on moving averages.
I materially added to my short book on Monday — and throughout the day on a scale higher.
Position: Short SPY (S/M)
BY Doug Kass · Sep 22, 2026, 5:45 AM EDT
Despite rising yields, Japan’s net interest payments as a share of GDP are projected to remain among the lowest in the OECD in 2027. Source: Japan Economy Watch richardkatz.substack.com/p/factually-ch…

⏪ ICYMI — Yesterday on TDR’s Trade to Black (presented by @FlowhubCo): 🎙️ Andrew O'Connell @realpristinecap on what it would actually take for cannabis stocks to gap up ⚖️ Rumors swirling that an ALJ Derek Julius rescheduling recommendation could land this week 🎦 WATCH: Show more


Cannabis Stocks: What It Would Take to Gap Up x.com/i/broadcasts/1…
SECTORS: wild day of divergences, especially vs. SEP to-date

Sure, why not?!

In yet another sign of AI’s surging dominance over human minds, OpenAI recently claimed to solve one of math’s biggest questions: the Navier-Stokes problem. But now three mathematicians have showed OpenAI’s work dodges the question rather than solving it. spklr.io/6011ETxdU
📌Equity Systematic strategies remain very bullish, with positioning in the 88th percentile. Discretionary investors have turned more cautious, slipping to the 19th percentile and staying underweight, leaving ample of room to add exposure 👉isabelnet.com/?s=equity @DeutscheBank

.@ChicagoFed National Activity Index, which tracks overall economic activity, cooled in August falling to -0.04 vs. +0.08 prior (rev. up from -0.08) … 3m moving average increased to +0.01 vs. -0.01 prior … 39 of the 85 individual indicators made positive contributions

Even broadening the parameters so we can get more signals doesn't improve the outlook much. Out of 83 dates with similar or better participation, the S&P rallied over the next year only 16% of the time.

We've never in almost 100 years seen breadth this bad. The S&P $SPY is knocking on new highs but there are (many) more stocks at lows than highs. The percentage of stocks in long-term uptrends is plunging. The only remotely similar setups were January 1973 and November 1999.


