While the Others Rally, This VIX Indicator Screams Caution
It’s an either/or market. The others made their move today, but the VIX may be ready to pop.
You've reached your free article limit
You've read 0 of 1 free Pro articles.
The Market
So, we got the others to rally. It truly is—remains—an either/or market.
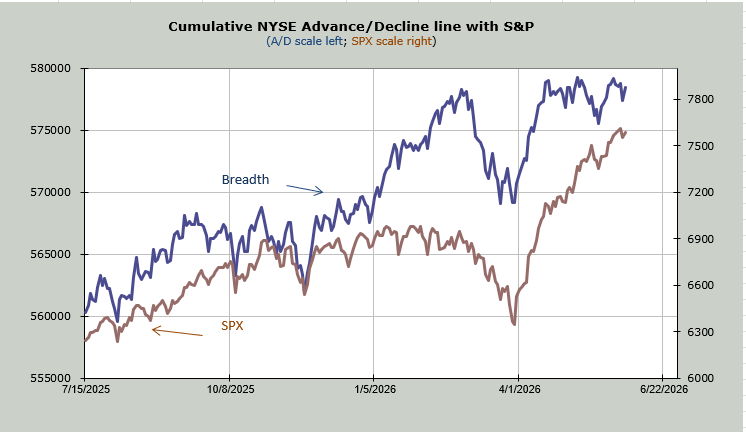
And not one indicator changed today. For example, yesterday’s NYSE saw 77% of the volume on the downside. Today’s rally saw that reading at 66% on the upside. We could not even gain back what we lost.
Breadth, meaning the advance/decline line, lost 1420 issues yesterday, and today it gained 1100. That’s a net loss over two days. Oh, it’s not huge, not even close to huge. All it does is reinforce that breadth has been lagging in the last two months. Basically, ever since mid-April, breadth has slopped and chopped while the S&P has leapt and soared.
As we explored the other day, the question was if we can see group rotation. I offered up that I saw potential in the metals and mining area (XME, with Alcoa having been my pick), XLE (with Chevron having been my pick), and XLF (with Citi having been my pick). To that, I would add I still think the Utes are okay down here.
The metals did not move much today. Neither did energy. But gosh, did they love the financials today, with the banks having their best day since January. My rule of thumb is that when everyone loves a group/stock as they did in January with the banks, and it doesn’t do what they thought it would do, they tend to go silent and forget about it—which tends to be a good time to buy.
But now we find ourselves with the DSI for the VIX at 10. As you know, single digits and I scream from the hill tops, ‘something has to give’. Perhaps this will be the one time it doesn’t matter. Maybe it will take another week or two to matter; we’ve seen that before. In early July 2024, the DSI for Nasdaq topped 90, but it wasn’t until late in the month that Nasdaq realized it! Stay on your toes.
New Ideas
I want to do two follow-ups today.
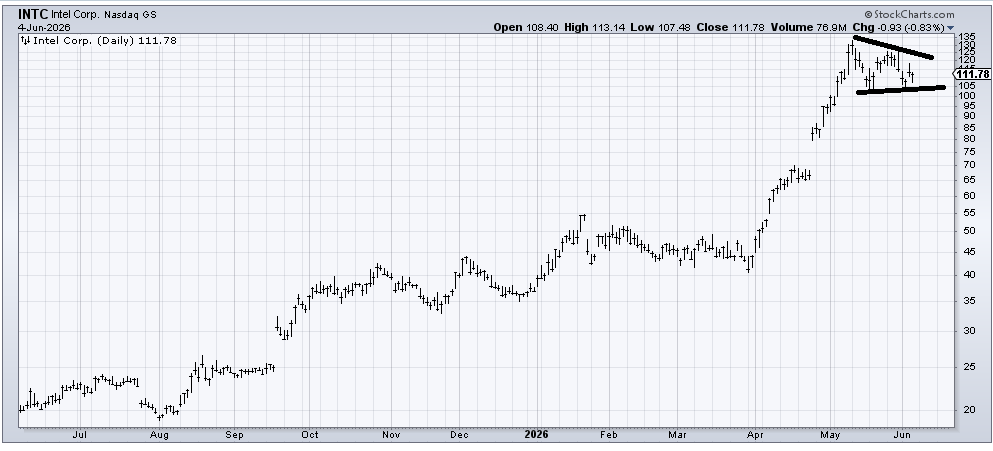
First, let’s look at Intel (INTC). I have not liked the chart for about a month now, and on Sunday, with the stock at 115, I said I thought it was vulnerable to 105. It tagged 104 on Wednesday. For me, that’s enough. If the chart is going to shape up again, then this 105 area will need to hold, and the stock will need to go sideways and rebuild as it did in the first quarter of this year. Call me neutral on Intel now.
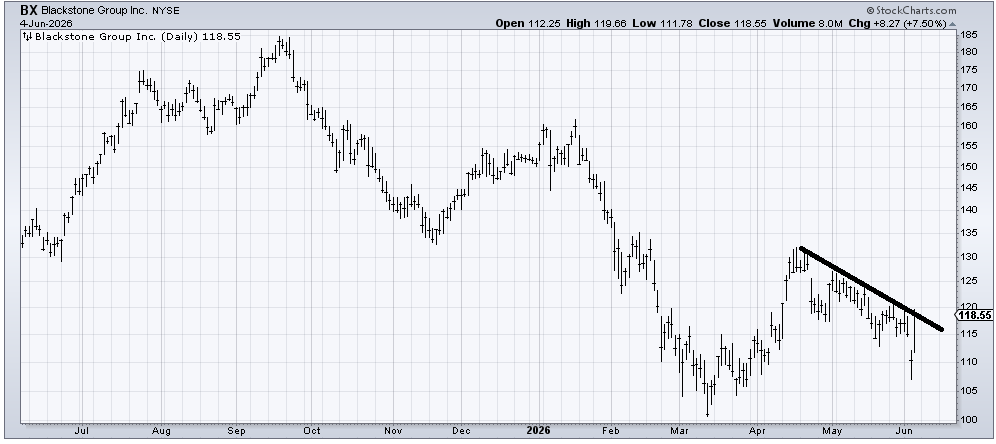
Yesterday, I was asked about Blackstone (BX), and I did not like that it had broken down, but allowed that it was oversold and at support. Along with the other financials, it bounced today—right to resistance. If the financials can keep running (I think Citigroup is getting a little short-term overbought, but it is still ok) and BX can cross this downtrend line, I will like that action.
Today’s Indicator
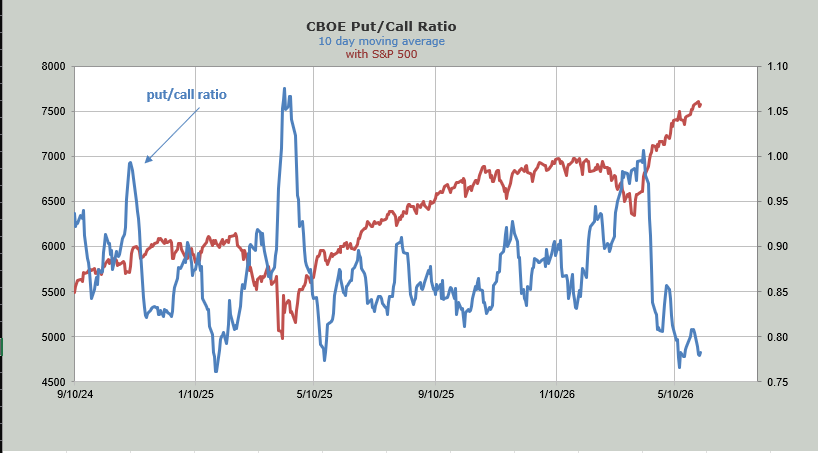
The 10-day moving average of the put/call ratio got extreme in mid-May and on this trip up in stocks, but back down in the indicator, it appears to be making a higher low. This is still showing options traders are giddy.
Q&A/Reader’s Feedback
Helene welcomes your questions about Top Stocks and her charting strategy and techniques. Please send an email directly to Helene with your questions. However, please remember that TheStreet.com Top Stocks is not intended to provide personalized investment advice. Email Helene here.
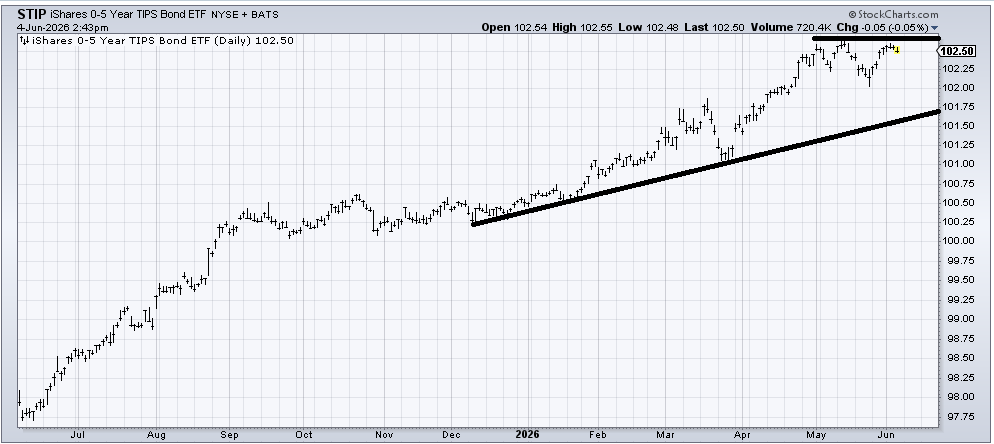
I don’t know if inflation protection bonds like STIP respond to chart reading, but what I would say right now is that this may be a giant sideways period right now. I would watch 102—that prior low—especially if it comes down to that zone in early to mid-July, because I expect the uptrend line to be around 102 about 4-6 weeks from now so if it were to break that area, it would break a prior low and an uptrend line at the same time and therefore it will have done something wrong (very wrong).
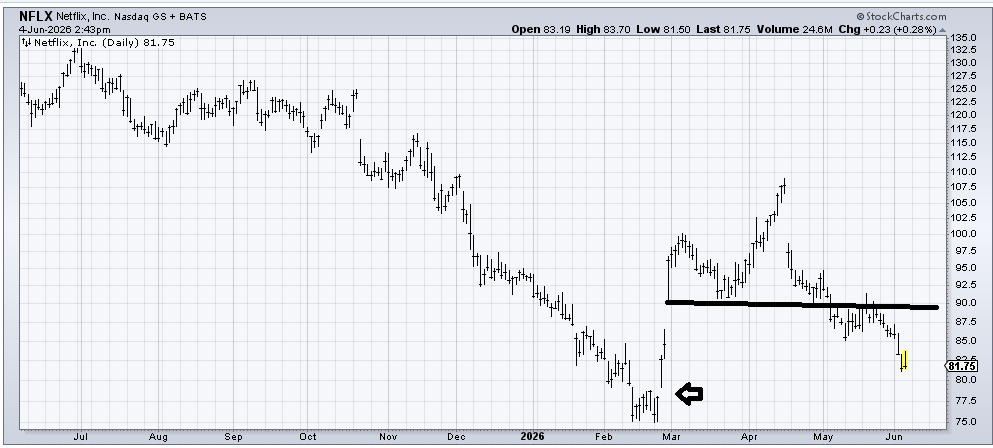
Netflix (NFLX) looks like it is getting mighty oversold, having fallen ten percent in the last two weeks. I would start looking for an oversold rally. The best setup for that would be if it can first fill that gap around d78 from late February. Somewhere in this area, I expect a bounce. For now, just a bounce.
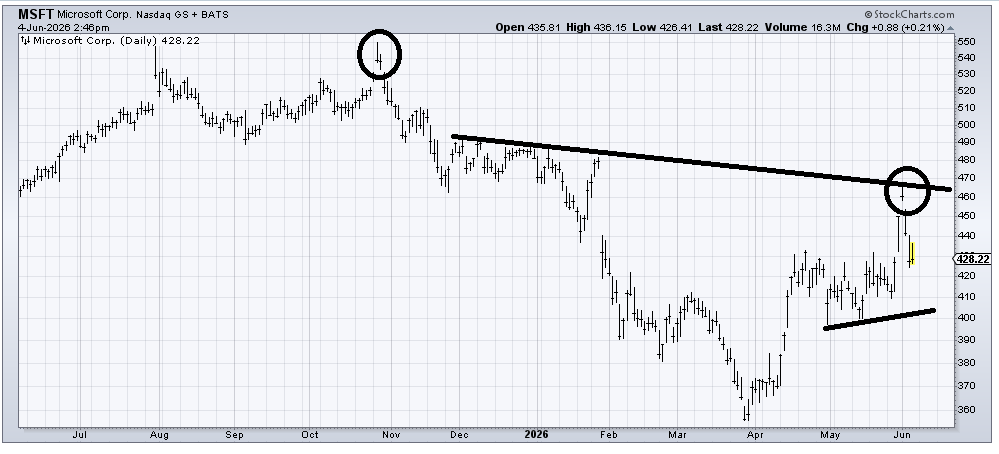
I do not like that island Microsoft (MSFT) formed earlier this week (circled) because you can see it also had one last October. However, I am willing to bet that it was just a reaction into resistance, so in the near term, I can see it going any which way, but if it cracks under 400, then I would consider the bullish stance I have had on this stock since early April (around 360) to be over.
Note: I have been asked to look at several Medical Technology charts below. I just want to remind folks that I warmed up to Abbott (ABT) earlier this week.
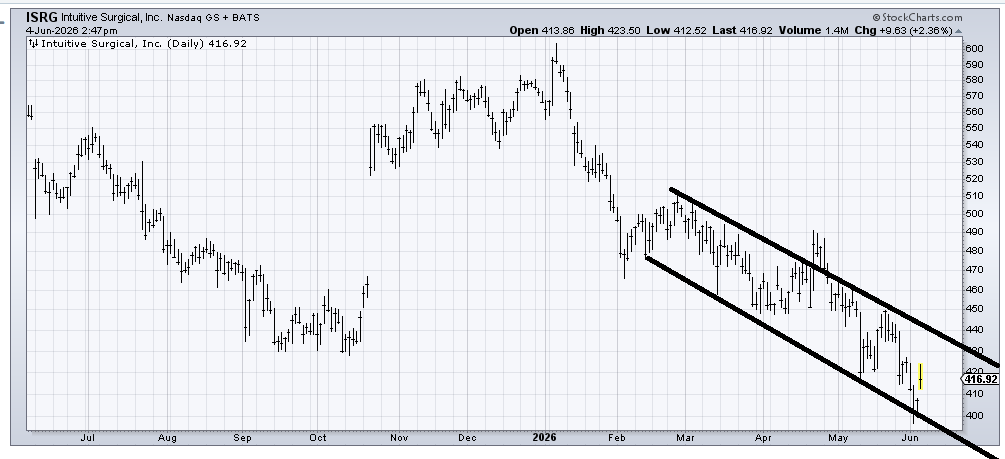
Intuitive Surgical (ISRG) has been in this funky downward channel since February, so it ought to make its way to the top of the channel (call it 435-440) or maybe even 450. If it can make it to 450, then I might begin looking for a head and shoulders bottom to form, but that would take time. For now, let’s start with a rally to resistance.
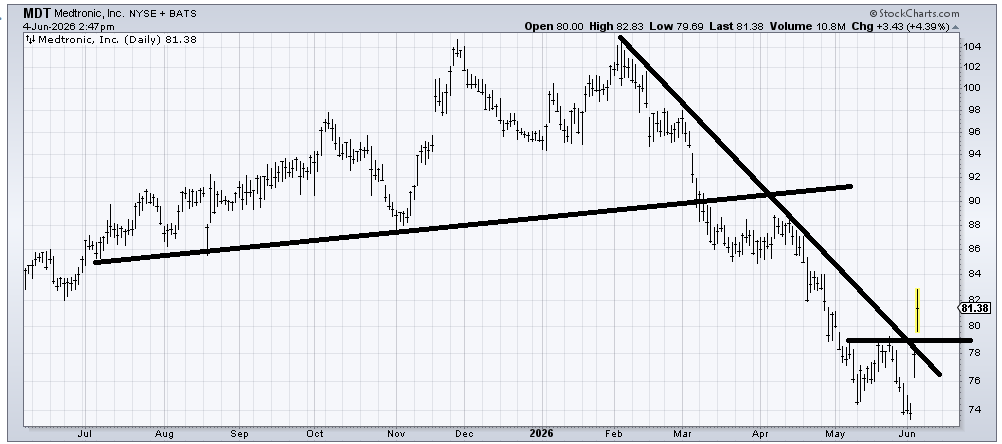
Medtronic (MDT) has had a terrific run off the low already this week. That low was a measured target off the top it broke down from in March. The chart still doesn’t have a base to speak of, but pullbacks into the 78-ish area seem like a decent risk/reward because if it trades back under there, then we know this was just a short covering rally and nothing more.
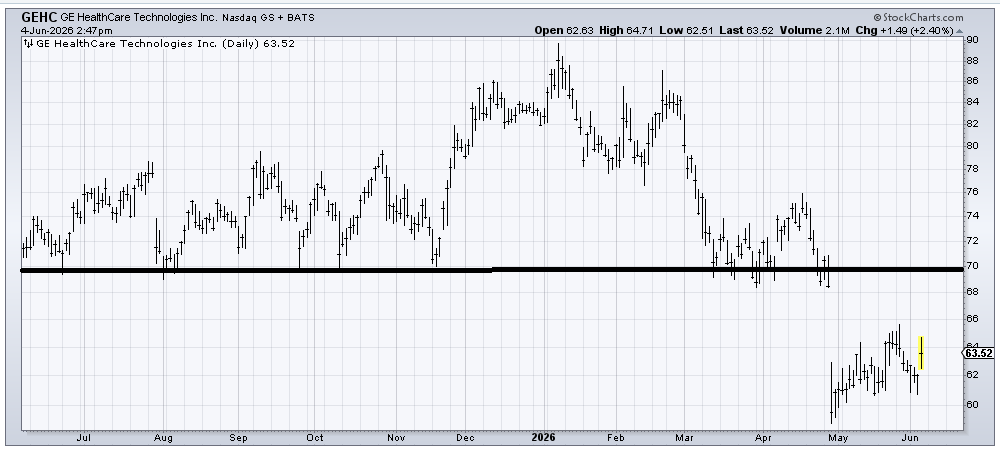
Unless GE Healthcare (GEHC) can jump up and gap over 70, I believe that area will be resistance on any rally.
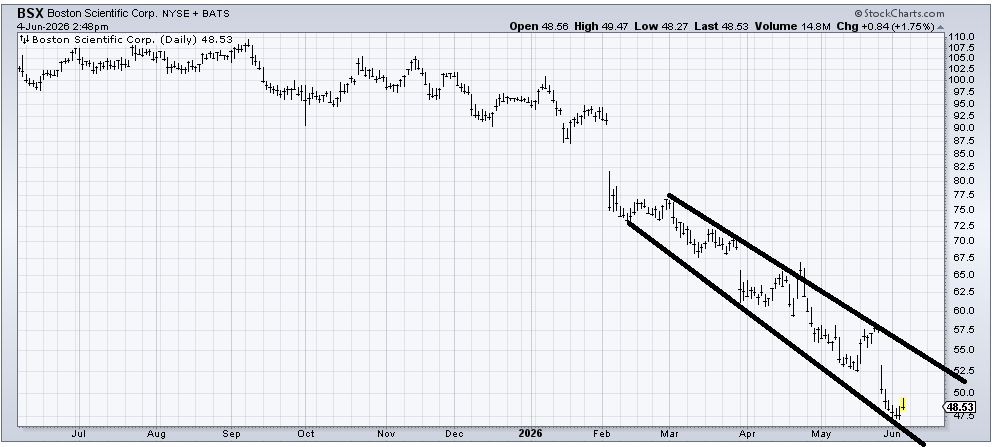
Boston Scientific (BSX) is in a downward channel, so it ought to bounce to the top of the channel. That’s the best I can say about it.
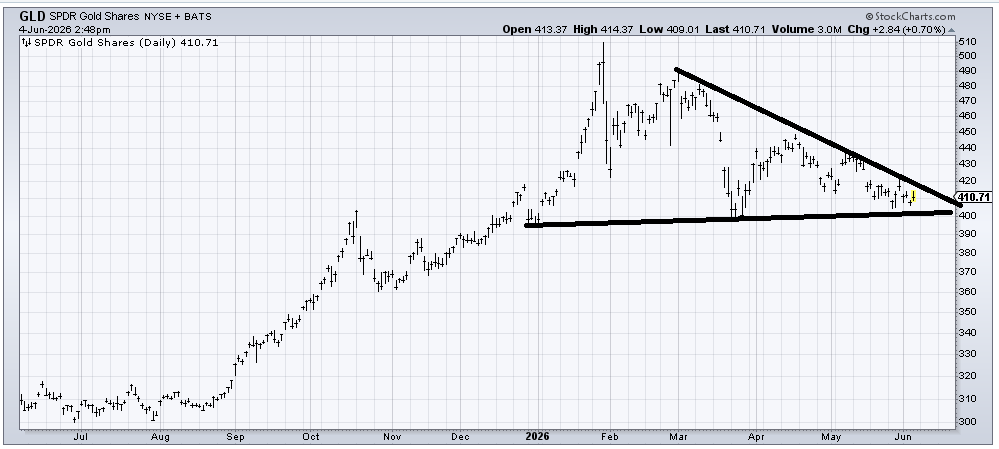
GLD (GLD) is trapped in a triangle and quite far into the apex. Triangles work best when they break out about two-thirds to three-quarters of the way into the apex. Thus, I’m not even sure we can trust it, whatever way it breaks out! I have said that I think the action from last year, with a big peak and then a prolonged sideways move, could repeat this year. I think under 400, like it means it would be bearish. A minor break under it wouldn’t be terrible, especially if it arrives with some hysteria.
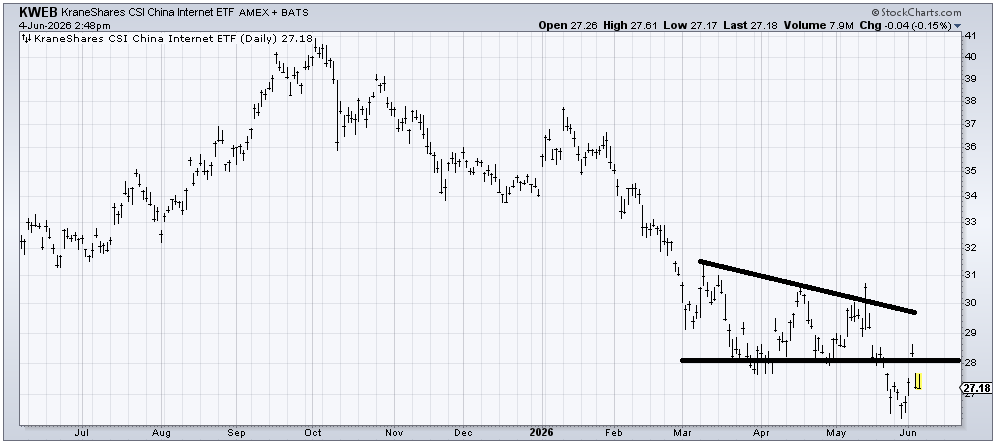
I have tried to bottom fish in KWEB (KWEB) a number of times, and I have been burned each and every time. I have had more success with Baidu (BIDU) rather than Alibaba (BABA). So, unless/until KWEB can clear that 31-ish area, I consider the chart suspect. It needs a higher high to get me to trust it.