Where Is Amgen Headed After the Stock Surges on Obesity Drug News?
Let's check on the charts and indicators of the biopharma company.
You've reached your free article limit
You've read 0 of 1 free Pro articles.
Shares of Amgen AMGN are soaring higher Friday morning after the biopharma company's CEO gave a positive update on their experimental obesity drug. The company also "tweaked" their forward guidance and the stock was raised to a fundamental "equal-weight" rating at Barclays BCS Friday.
Late Thursday investors shrugged off a slight drop in the company’s first-quarter adjusted profit and slightly-lower-than expected sales of drugs including arthritis treatment Enbrel and psoriasis therapy Otezla.
Let's check on the charts and indicators Friday morning.
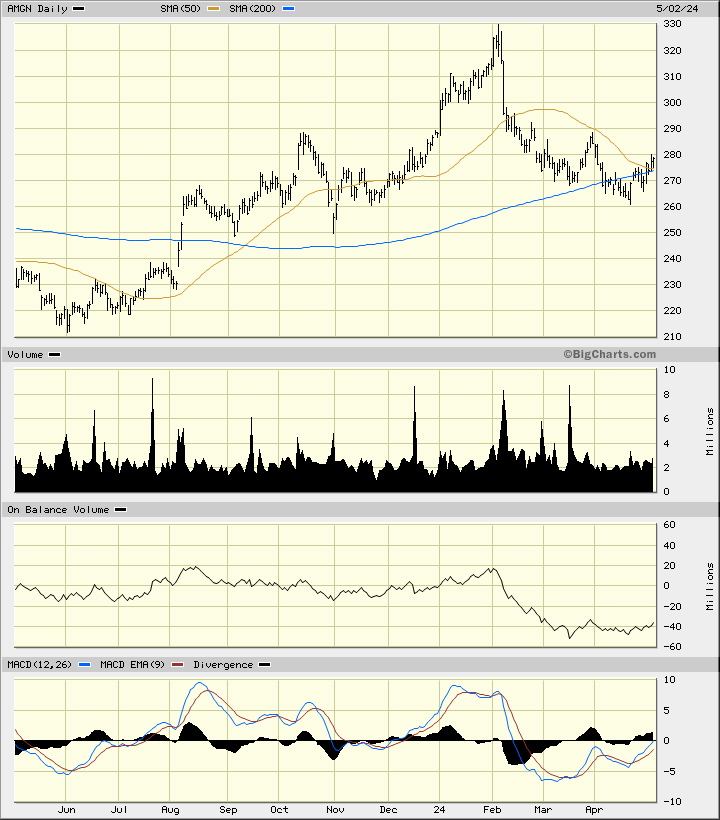
In the daily bar chart of AMGN, below, we have to use our imagination a bit until the opening of trading Friday. The shares are trading in the $318/$319 area in the pre-market and that puts prices in place to challenge the highs of early February. AMGN was already trading above the rising 200-day moving average line and above the bottoming 50-day moving average line.
The On-Balance-Volume (OBV) line corrected lower in February and early March but then started to improve as buyers became more aggressive. The Moving Average Convergence Divergence (MACD) oscillator made a higher low in April versus March and is now poised to cross the zero line for an outright buy signal.
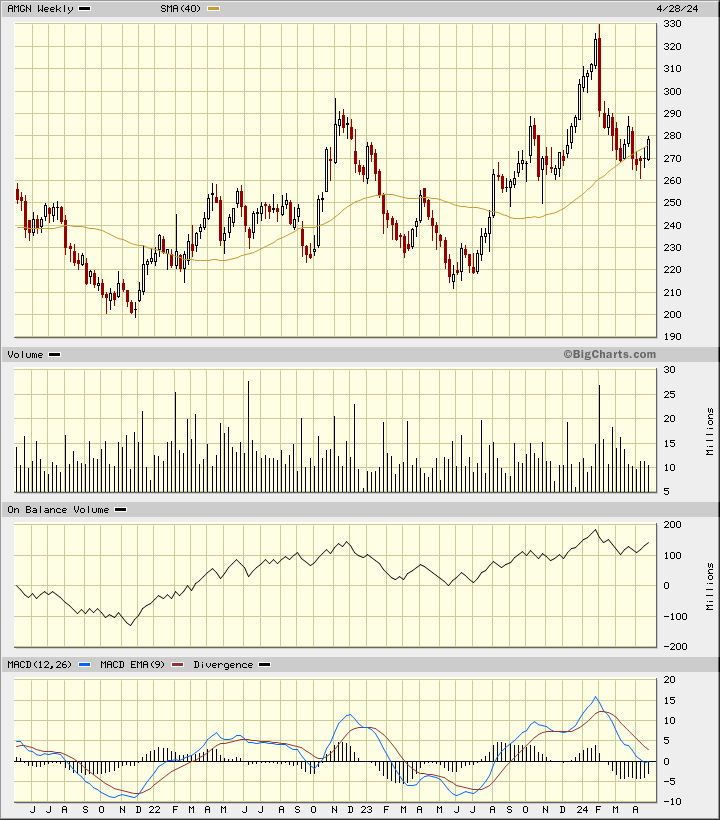
In the weekly Japanese candlestick chart of AMGN, below, I can see a choppy but rising pattern over the past three years. The shares are trading above the rising 40-week moving average line.
The weekly OBV line shows a positive trend the past three years. The MACD oscillator has been correcting lower but is still above the zero line.
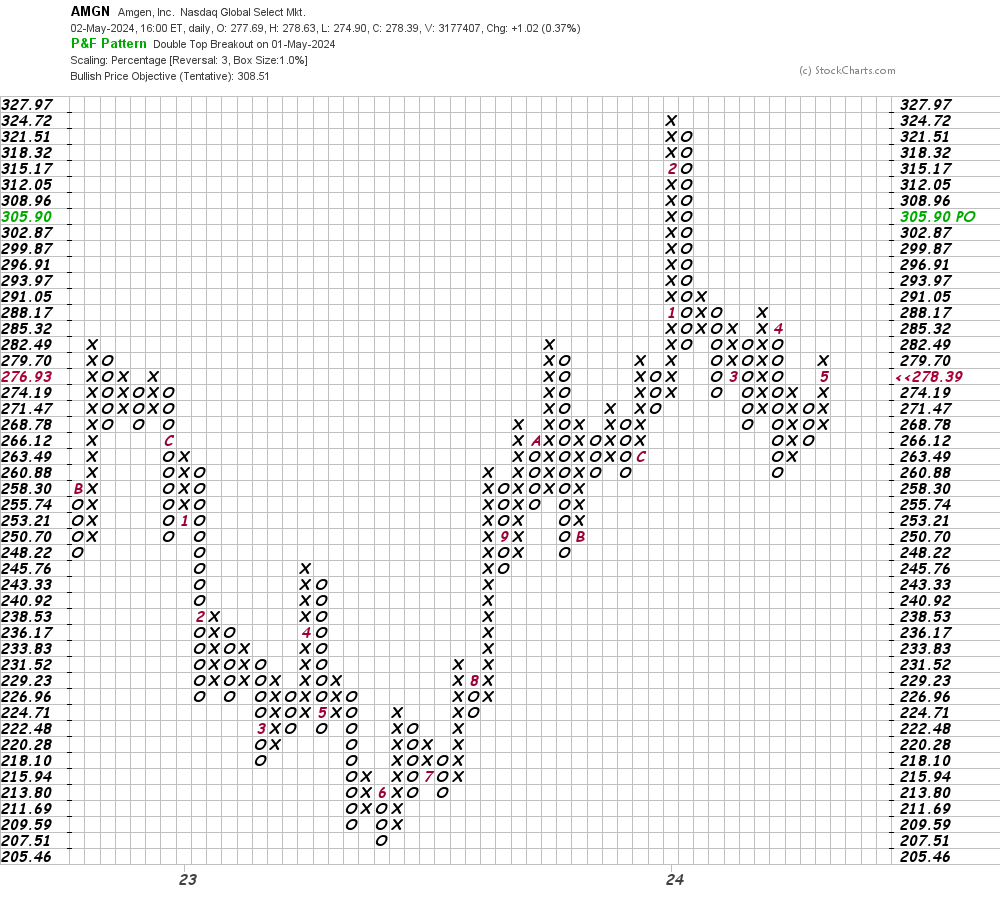
In this daily Point and Figure chart of AMGN, below, I can see an upside price target in the $306 area. AMGN is likely to open well above this level.
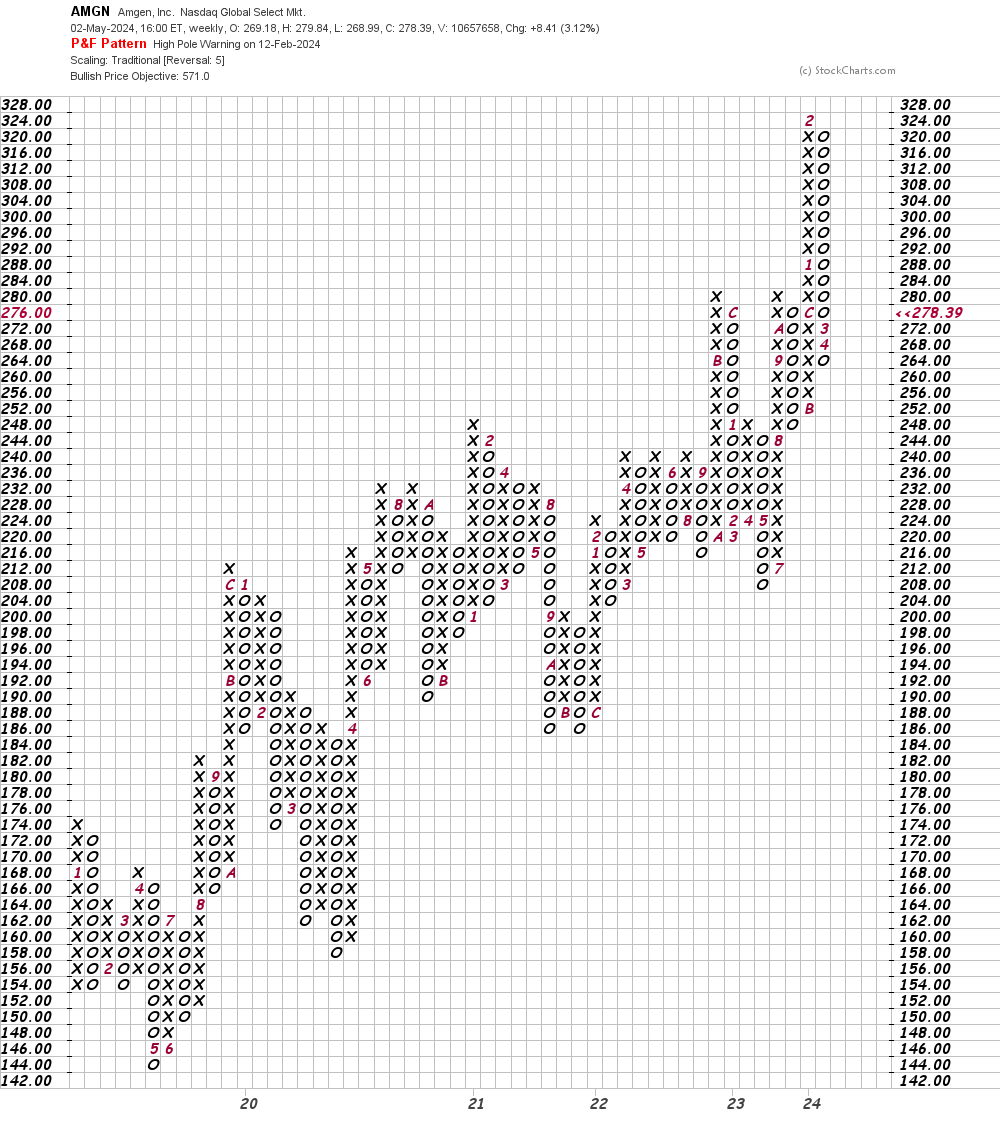
In this weekly Point and Figure chart of AMGN, below, I used a five-box reversal filter and the software came up with a price target in the $571 area. Maybe.
Bottom-line strategy: The question that needs an answer is where do I recommend purchase of AMGN. I am not sure of a level but investors could probe the long side of AMGN after a few days of sideways price action. Maybe we'll see support in the $305 area as some traders take profits.
Employees of TheStreet are prohibited from trading individual securities.