When Value Meets a Great Chart: Why This Stock Offers the Best of Both Worlds
When the technicals and fundamentals agree, I pay attention.
You've reached your free article limit
You've read 0 of 1 free Pro articles.

A value investor wants to buy a stock for less than it’s worth. However, buying a stock at a discount to fair value is no guarantee of success, as there may be a good reason behind a stock’s cheap valuation.
A technical trader wants to buy a stock that’s demonstrating bullish price action. When a stock is breaking out to new highs, technical traders consider this a vote of confidence from the market. When institutional investors buy as a stock reaches a new high, it demonstrates faith that further upside lies ahead.
Valuation: Stock vs. Sector
One metric that can be used to determine if a stock is cheap is to compare its trailing 12-month price-earnings ratio to that of its sector.
Unfortunately, stocks with attractive valuations are often cheap for a reason. Perhaps that stock is cheaper than its competitors because the company has a C-suite team that executes poorly, or a board of directors with conflicting interests.
The Technical Factor
A poorly run company is often accompanied by a sad-looking chart. As institutional investors sell, the price falls, making the company’s valuation metrics more attractive.
On the other hand, if we can find a stock with a bullish chart, paired with an attractive valuation, we might consider owning that name.
APA Corp. Valuation
For example, APA Corp. (APA) has a trailing 12-month P/E ratio of about 9.5, while the oil and gas exploration industry as a whole is valued at about 11.5.
APA’s current price is about $47. If the stock was given the same valuation as its peers, with a TTM P/E ratio of 11.5, APA’s price would increase to nearly $57.
APA Corp. Technicals
APA has an attractive chart that would cause a technical trader to salivate regardless of the stock’s fundamentals. This stock has just broken out of a six-month long consolidation pattern (shaded yellow) to reach a new 52-week high.
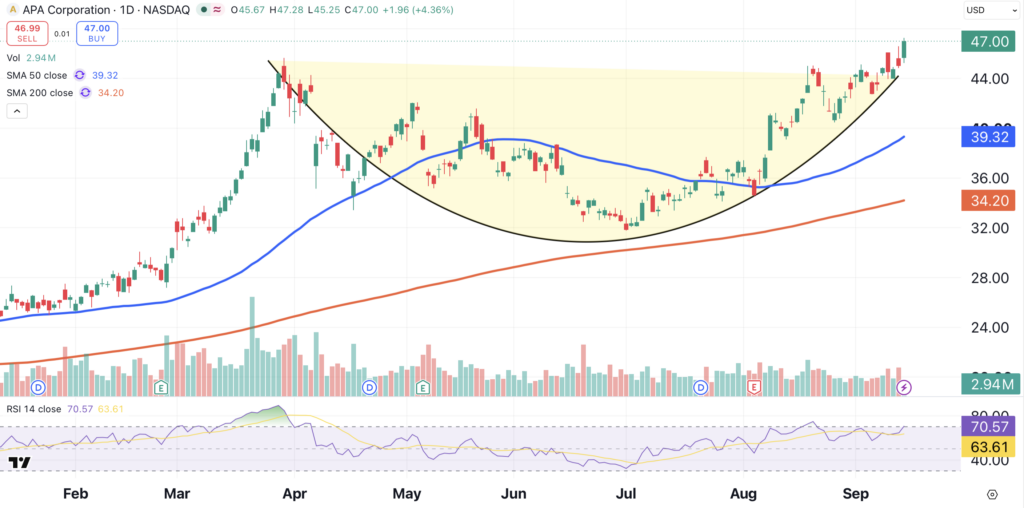
Using an old-school measuring technique, we can create a price target for APA. The low end of the consolidation is approximately $32, and the high end is approximately $45. Subtract 32 from 45, and the result is 13 (45-32 = 13).
Now add $13 to the upper end of the consolidation, which is $45, to create a new price target of $58.
Bottom Line
By one measure, APA’s fair value is $57. The stock’s chart indicates a rally to $58 is likely.
Taking both of these methods into account, based on its current price of $47, APA has the potential to gain 21% based on its fundamentals, or 23.5% based on its technicals.
Either way, we’re buyers. After decreasing our holdings in AI-related tech over the past month, this seems like an effective way to put some of that capital back to work.
At the time of publication, Ponsi was long APA.