Tech Investors Must Watch This Key Indicator
Investors are eager to know when the SaaSpocolypse will end.
You've reached your free article limit
You've read 0 of 1 free Pro articles.

On Tuesday, the Nasdaq Composite nearly did something it hasn’t done in two months. The tech heavy index, which has seen heavy selling over the past week on the heels of a ferocious bull run, nearly touched its 50-day moving average (blue).
The Nasdaq Composite came with one-tenth of 1% of that moving average (arrow) before bouncing sharply off the lows.
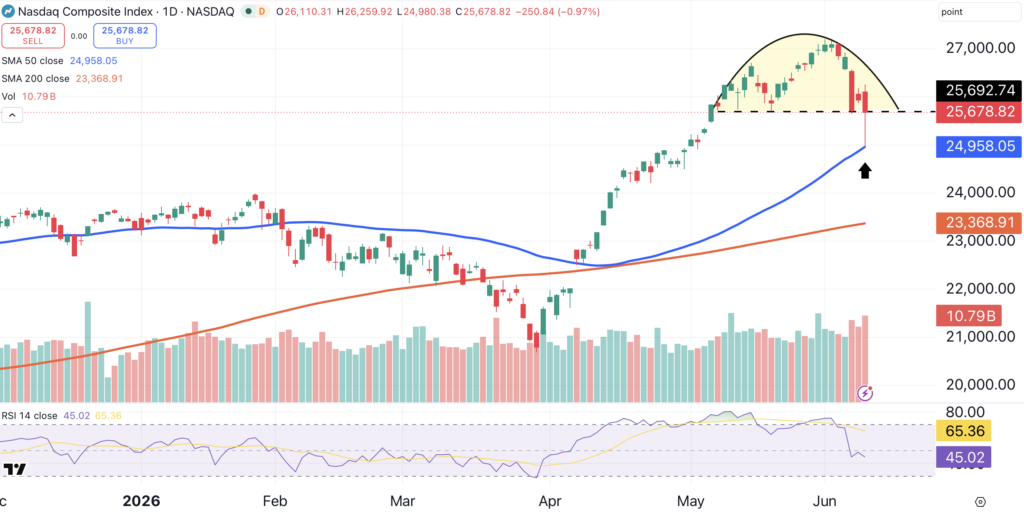
Stocks and indexes that can maintain their position above the 50-day and 200-day MAs during a bullish trend, even after a bout of volatility, must be considered resilient.
As long as the Nasdaq maintains its position above its 50-day MA, there is no reason for investors to change their outlook. If the 50-day breaks, we’ll need to consider lightening up on some positions.
The Bearish Argument
Bears will say that Nasdaq Composite has formed a small topping pattern (shaded yellow). However, the bearish formation is a small rounded top pattern. Due to its diminutive size, it’s unlikely to herald a major drop. Plus, the aforementioned 50-day moving average is waiting in the wings to act as support.
Better Than Last Year?
Another perspective can be gained by measuring the Nasdaq’s gains from its year-to-date low. Even after the volatility of the past few sessions, the index has gained over 23% since the March 30 close. That’s more than the Nasdaq Composite gained all of last year, when it climbed 20.36%. After such a large gain over a short period of time, it actually might be healthy for the markets to pull back a bit.
Software Still Soft
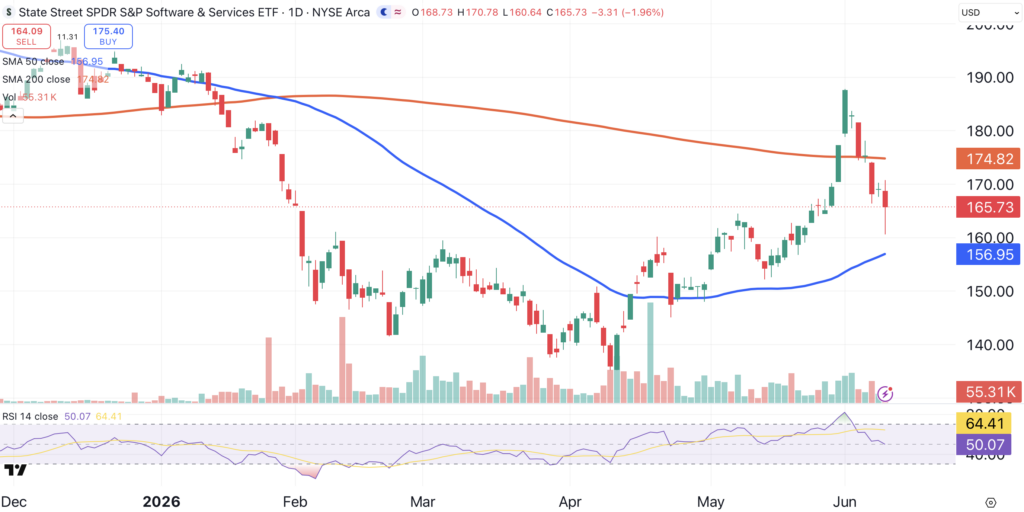
About a week ago, both the Nasdaq and the S&P 500 were trading at all-time highs. Some bargain-hunters, perhaps weary of watching the relentless climb of AI-related tech stocks, took a shot at one of the few areas of tech that hasn’t performed this year: software.
The State Street Software and Services SPDR (XSW), a bellwether for that sector, reached a four-month high last week, briefly climbing above its 200-day moving average (red).
Then it belly-flopped, marking the end of the rally.
SaaSpocalypse Now
Obviously, the market sell-off played a role, but we can’t ignore the impact of AI on software. AI could be pushing software as a service (SaaS) per-seat models toward obsolescence.
Salesforce (CRM) is an example of what can happen to a successful software company when its entire business model is suddenly called into question. The stock is down 31% this year and has been trending lower for the past 18 months. Over that time, Salesforce has lost more than half its value
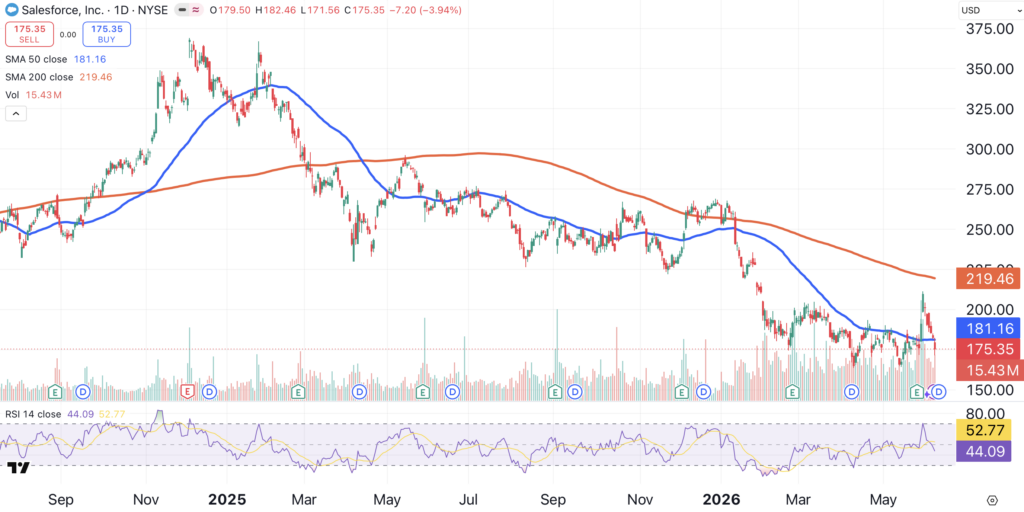
Salesforce isn’t alone. The charts of Microsoft (MSFT), SAP (SAP), ServiceNow (NOW) and a host of other software names have similar characteristics.
When will the SaaSpocalypse finally end? Perhaps software giant Oracle’s post-earnings conference call will offer some clues. Oracle (ORCL) is scheduled to report after the close on Wednesday.
At the time of publication, Ponsi had no positions in any securities mentioned.
