Riding Into Earnings With 2 AI ‘Offenders’: Bold or Just Plain Crazy?
Here’s why I’m long Microsoft and Amazon into crucial results this week.
You've reached your free article limit
You've read 0 of 1 free Pro articles.

I’m riding into earnings long two struggling hyperscalers. Yep. That would be me.
The two cloud services leaders. Two of the economy’s largest offenders in the AI-development capex spending spree that’s been crushing cash flows for the Magnificent Seven but also keeping a number of other tech firms afloat.
Yes, I am going into earnings long both Amazon (AMZN) and Microsoft (MSFT). AWS and Azure.
Am I bold, or just plain crazy? Well, I probably can’t answer that question for myself. After what happened to their competitor Alphabet (GOOGL) last week, I’ll let you be the judge. That said, let’s go to the charts, because I think I see cause for optimism in both names, at least technically.
Microsoft
Microsoft is scheduled to release its fiscal fourth quarter results after the closing bell in two days, on Wednesday, July 29. Consensus view is for adjusted EPS print of $4.24 on revenue generation of roughly $87.7 billion. If precise, these results would compare well to the $3.65 posted a year ago on annual sales growth of about 14.7%.
Of the 31 sell-side analysts that I know to cover Microsoft, 21 have revised their earnings estimates lower since the start of the quarter, while 10 have adjusted their numbers to the upside.
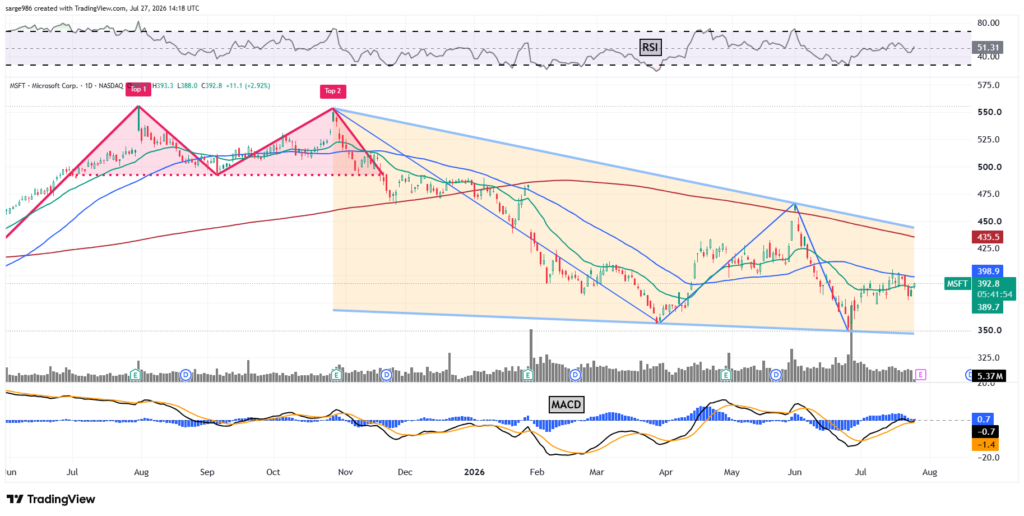
Readers will see that MSFT had come out of a Double Top pattern of bearish reversal last autumn that worked quite well. The stock then went about developing a falling wedge of bullish reversal that may or may not be closing as we speak. This makes the 50-day simple moving average (SMA) (currently $399) the current pivot and could allow for a run at either the 200-day SMA. Readers will see swing traders visibly playing both sides of the 21-day exponential moving average (EMA).
Going to my most relied-upon indicators, Relative Strength is now trying to retake the neutral line. This has been a back-and-forth battle. Below the chart, the daily moving average convergence divergence (MACD) has been gaining strength, but enters earnings really able to go either way.
The histogram of the 9-day EMA has been in positive territory for most of July and remains so, even if not by much. This is a short-term bullish signal. In addition, the 12-day EMA continues to run above the 26-day EMA with both of those lines approaching positive territory. That would also be a bullish signal.
Price Target: $488
Pivot: 50-day SMA (currently $399)
Add: Down to lower trendline of the wedge
Panic: Loss of the wedge
Amazon
Amazon is set to put its second-quarter financial results to the tape after the closing bell on Thursday, July 30. The stock unfortunately remains roughly 16% below its early May high and about 9% below its October 2025 high.
Concerning the period to be reported, Wall Street is currently looking for GAAP EPS of $1.81 on revenue of roughly 196.2 billion. These numbers, actually posted, would compare well to the same period a year ago when Amazon reported earnings of $1.68 per share on annual revenue growth of 16.9%.
Of the 46 sell-side analysts that I know that track and cover this name, 27 have revised their earnings estimates to the upside, while 10 analysts have adjusted their estimates in a southerly direction. Nine analysts have left their numbers unrevised.
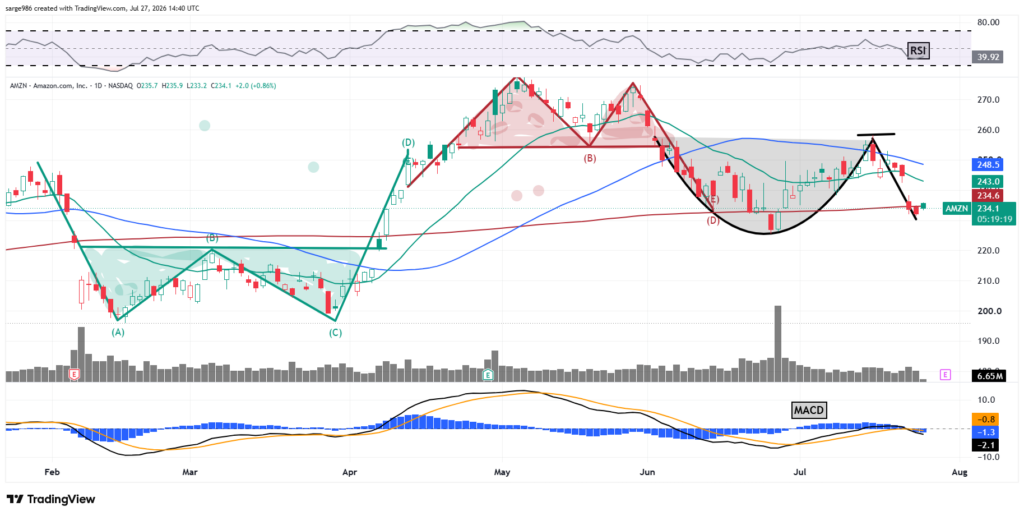
Readers will note that AMZN had come out of a double bottom pattern of bullish reversal in late March/early April that worked to precision. That led to the rally that produced the double top pattern of bearish reversal that lasted into and through this past spring. This setup also worked well.
As that selloff feels around for support ahead of earnings, it looks to me that AMZN has developed a cup-with-handle pattern. That would be a bullish setup.
As the shares struggle to define the depth of the handle, they come into earnings trying to put in a base of support at their 200-day SMA. Support here is paramount to maintaining professional support. This makes either the 50-day SMA (currently $248) of the apex of the right side of the cup ($258) the pivot.
I went with the pattern’s setup over the moving average in selecting my pivot. This does not change the direction of my trade. It does impact the target.
Looking at most my relied-upon indicators. Relative Strength is now running below neutral and not rising at the moment. The daily MACD is also struggling, making this a lower confidence trade, in my opinion, than is Microsoft though I like both setups.
The histogram of the 9-day EMA. as well as the 12-day and 26-day EMAs have all gone negative in recent days, forcing me to reduce my exposure to this trade. That does not mean that I won’t be thrilled with a nice pop on Thursday night.
Price Target: $316
Pivot: $258
Add: On a rise off of the 200-day SMA
Panic: Loss of the late June low
At the time of publication, Guilfoyle was long MSFT and AMZN.
