Old-Timers Called It Glass Works. What Call Should Today’s Traders Make?
A very good quarter and guidance, but bearish signaling has me calling it this way.
You've reached your free article limit
You've read 0 of 1 free Pro articles.
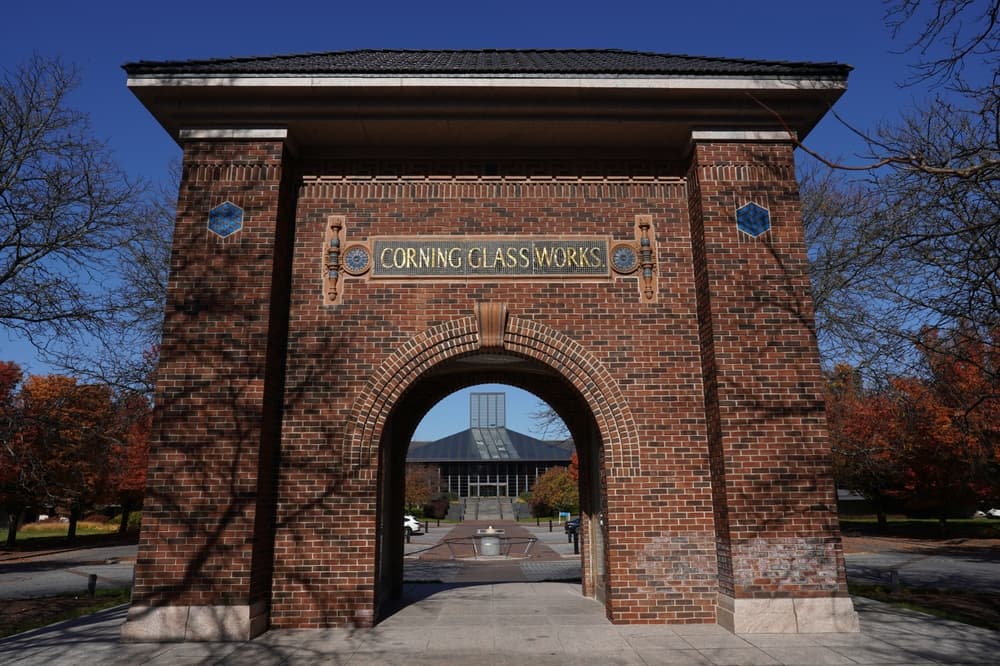
It was moderately difficult for me not to type “Glass Works” when writing this piece. Other old traders will get that one. The nickname and symbol for this stock goes back a long way. From 1875 until 1989, the corporate name was Corning Glass Works. On the trading floor of the NYSE, the stock was simply referred to as “Glass Works.” Some things just stick in your head.
Well, let’s get to the point of this article. Corning Inc. (GLW) released its third-quarter financial results on Tuesday morning. For the period, Corning posted adjusted EPS of $0.91 (GAAP EPS: $0.78) on adjusted revenue of $5.081 billion (GAAP revenue: $4.855 billion). Those adjusted earnings and adjusted revenues did both beat expectations while sporting 19% core sales growth. So, there’s that. And for those that may have never heard of adjusted revenue, the company adjusted for $226 million in hedging exposure. Optical Communications, which is the key AI driver here, saw sales grow 44% to $2.38 billion.
Wendell P. Weeks, chairman, president and CEO, commented in the press release… “We delivered an outstanding third quarter. Year over year, core sales grew 19% to $5.08 billion, and core EPS grew 36% to $0.91. We expanded core gross margin 150 basis points to 40.5%, core operating margin 310 basis points to 22.7%, and core ROIC 330 basis points to 16.7% – with strong adjusted free cash flow of $661 million, while investing more than half a billion in capital expenditures to address demand for our innovations.”
On a GAAP Basis…
On a GAAP basis net sales grew 18.4% to $4.855 billion. Out of that came a $3.045 billion cost of sales that left a gross profit of $1.81 billion (+19.1%).
After accounting for all operating expenses, operating income printed at $911 million (+54.7%). Once factoring for interest, other income & expenses as well as taxes, net income attributable to shareholders landed at $746 million (+58.1%). That works out to $0.78 per fully diluted share, up from $0.50 for the year-ago comp.
Guidance
Corning is projecting core EPS of $0.96 to $1.00 for the current quarter, taking the low end of the range above the $0.93 that Wall Street was looking for. Core sales of $5.2 billion to $5.3 billion are seen, taking the midpoint of that range above the consensus of $5.21 billion.
This guidance is why the stock reacted well at first but has since sold off.
Fundamentals
For the quarter reported, Corning generated operating cash flow of $1.206 billion. Out of that number came capex spending of $545 million. This left free cash flow of $661 million (+23.6%). Out of that sum, the firm paid shareholders $262 million in cash dividends.
Turning to the balance sheet, Corning ended the period with a cash position of $2.537 billion and inventories of $3.646 billion. This left current assets at $11.342 billion. Current liabilities add up to $6.585 billion, including short-term debt of $933 million. These numbers put the company’s current and quick ratios at 1.72 and 1.17, respectively, which is healthy.
Total assets amount to $34.126 billion of which only 9% is labeled as either goodwill or other intangibles. That’s not a problem. Total assets less equity comes to $19.838 billion, which does include long-term debt of $7.267 billion. While that is a hefty number versus the cash position it does appear that Corning is making an honest effort to pay down the debt load in 2026, so I won’t take the C-suite to task over this.
My Opinion
The quarter was solid. In fact, it was very good. Guidance is strong. Cash flows are strong as well. The current part of the balance sheet is in good shape as well. There is a lot to like here.
The valuation is a bit much at 39 times forward-looking earnings. That may be contributing to this “sell the news” price action, though “they” really did not buy the rumor, so to speak.
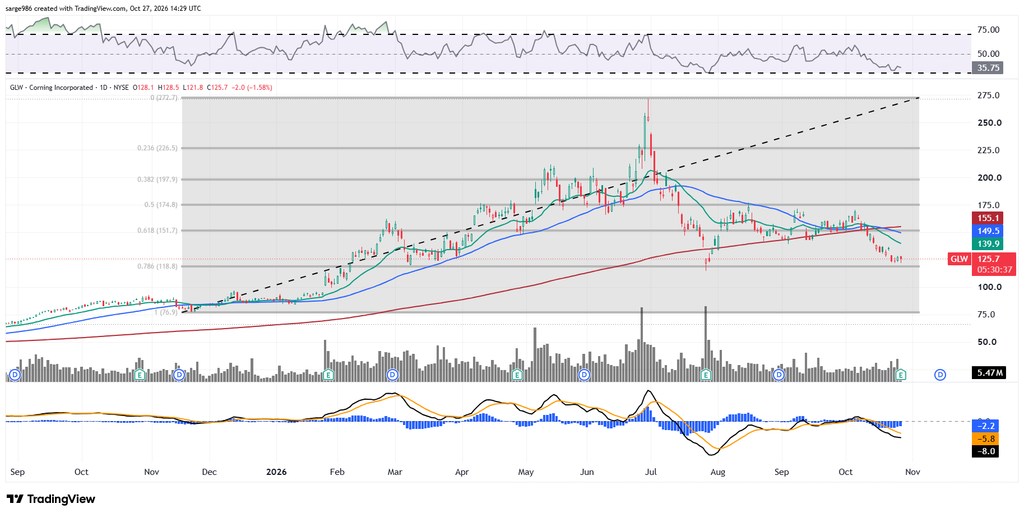
Readers will see that GLW is again testing the 78.6% Fibonacci retracement level of the November 2025 through June 2026 rally. That level was first tested this past July. With the stock already trading below its 50-day and 200-day simple moving averages (SMAs), there is a real danger that a loss of that level could algorithmically put a 100% retracement in play.
Moving on to the indicators, Relative Strength is weak, but still not close to entering into a technically oversold state. In addition, the daily moving average convergence divergence (MACD) is in awful shape. The histogram of the 9-day exponential moving average (EMA) stands in negative territory as it has for most of the past four months. The 12-day EMA is also running below the 26-day EMA with both of those lines well below the zero-bound.
That’s some pretty serious bearish signaling. No, I am not considering buying this dip despite the decent corporate performance. The technicals are not constructive at this time. That said, going out six months and writing April 2027 $80 puts for more than $2 might be an idea.
At the time of publication, Guilfoyle had no positions in any securities mentioned.