Market Shifts as Retail Investors Jump the Fence
This rally has seen an “all in” shift.
You've reached your free article limit
You've read 0 of 1 free Pro articles.

The Market
There will be folks who love to cite the AAII survey as a sign investors are not bullish (there were more bears than bulls once again, by a smidge). It is hard for me to make that case considering all the other indicators that do not confirm it.
In fact, I would ask how you can think a sentiment survey that has not seen more than 50% bulls in more than two years is a sentiment indicator that shows us reality.
With that as background, let’s move to the ISEE equity call/put ratio. We’ve looked at the five-day moving average a few times in the last few weeks, with my citing it as bullish (for stocks) because each time it has gotten down to the 1.60 area stocks have bounced. It remains bullish in that it is not extreme.
However, Thursday’s reading of 2.24 was the highest reading since July 9. Recall that, a few days ago, I noted that the retail folks were not “all in” on this rally. My take is that, on Thursday, that changed. It seems many have finally jumped the fence.
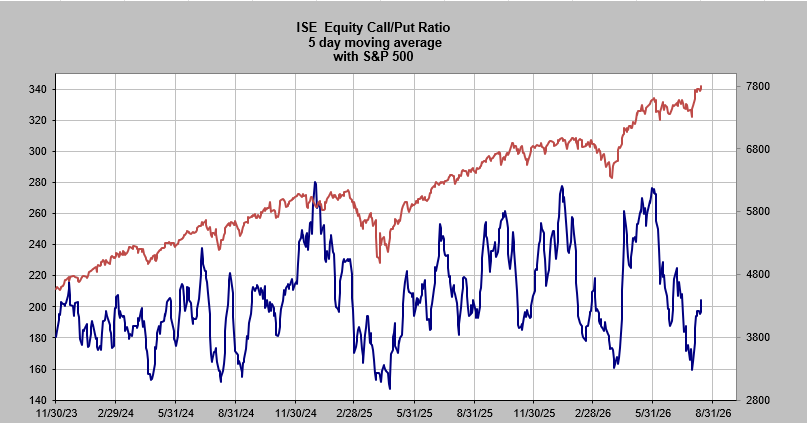
So, while the moving average still has plenty of room to run, keep in mind that this is only a five-day moving average so if we get some readings in this range (2.25) for the next five days, this moving average will be much closer to the top of the page. Who knows? Maybe it will be there around the same time the Investors Intelligence bull-to-bear ratio crosses over 4.0.
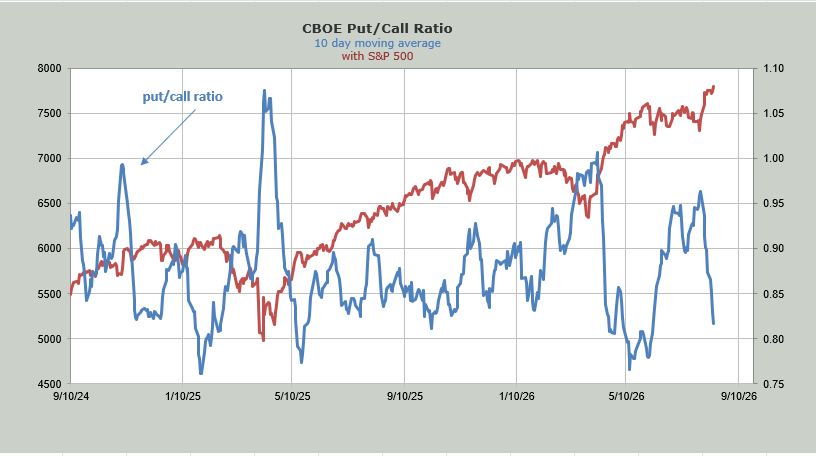
Sticking with sentiment, you will see down below the 10-day moving average of the put/call ratio is already in the low 80s. I had expected it to fall to this area by the end of the week and it has. Now I wonder if it can get under .80. The math says “maybe.” My confidence in that is not as high as getting to the low 80s was. Either way, the CBOE options players are all in.
Finally, on sentiment, the DSI for the S&P is at 79. The VIX, because it didn’t fall much on Thursday, is still at 17.
I don’t know if Thursday’s rally can extend that much more but if it does, all of these sentiment indicators ought to be extreme by midweek next week.
I will finish up by noting that my view on tech/semis — that they were in better shape than the others — has only been half right. Tech/semis have done well, but the others have not fallen as I expected. I continue to think tech/semis don’t have the same love as the others, even if they could use a pullback.
New Ideas
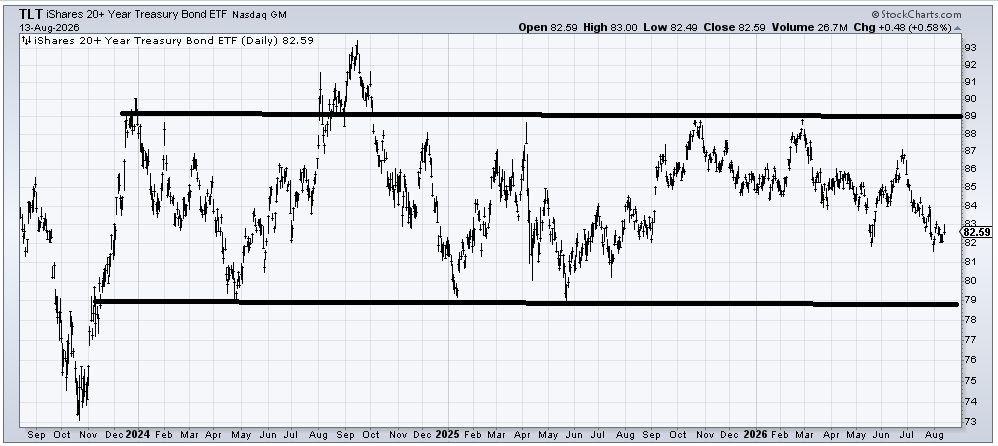
I want to address (TLT), or the bonds, since I’ve gotten so many questions on TLT. My view has not changed in three years: I think bonds are in a giant trading range and sometimes we will trade out of the range only to fall back in. Go back to the 1990s. It was the same then: a giant trading range.
In the near term, I think TLT is OK. The DSI got to 10 about two weeks ago and it has bounced, but not much. I would remind you that the DSI for (GLD) got to 10 in late June and it took until August before GLD cared.
My guess is that there may be another sell off in TLT in the next few weeks, with all these auctions we’re due to have, but I do not think bonds are due to collapse. Rather, I would probably be a buyer if that 82 area was broken. It is similar to my view on the Utes, we’re trying to find a bottom.
Today’s Indicator
The 10-day moving average of the put/call ratio is discussed above.
Q&A/Reader’s Feedback
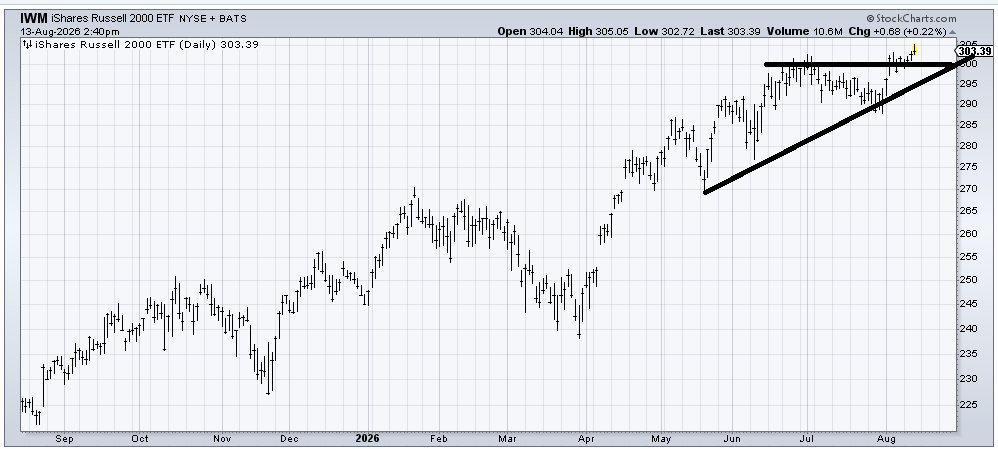
As a pure chart, (IWM) hasn’t done a thing wrong. The measured target is 310. If I were using a stop, I would say you don’t want to see it break back under 300-ish. I have a strong preference for using indicators on the indexes though, not price charts.
The next two charts are related to Bitcoin. I think the sentiment on BTC is terrible. Can I time it? Probably not. But, if it falls much more, that DSI is gonna say “buy.”
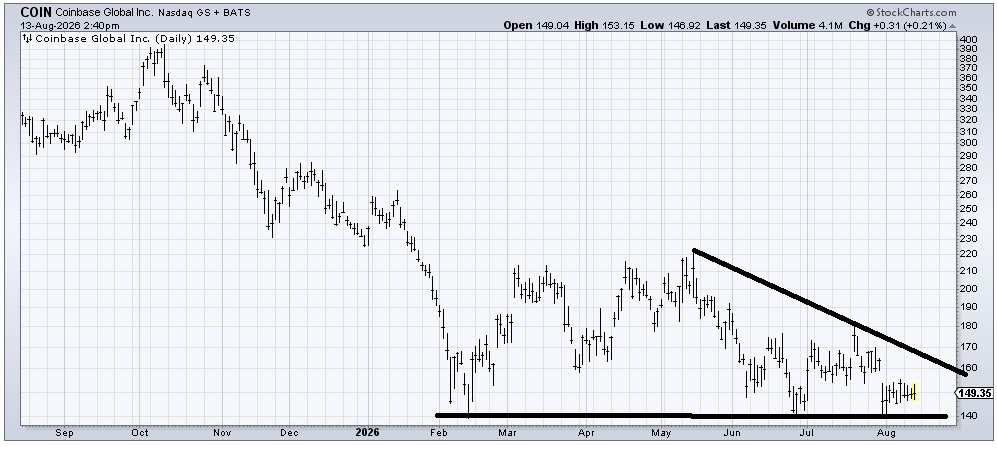
I have tried to bottom fish Coinbase (COIN) several times in the last few months only to get a pop and drop. It is highly related to Bitcoin, which I reviewed as (IBIT) about a week ago. The DSI is currently 16. Should COIN break under 140, I would watch not the chart but the DSI because if the DSI gets at/near single digits, there ought to be a great trade in it, and thus a trade in COIN as well.
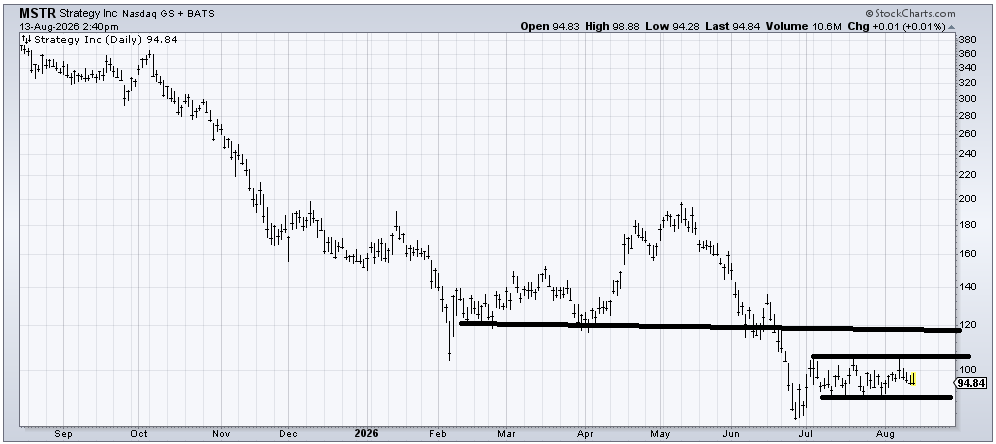
While Strategy (MSTR)’s chart is different than COIN’s (above) it’s the same story: all BTC related. Break the lower line and perhaps the DSI gets extreme. Get it over the line around 107 and you should get a run to resistance around 118 to 120.
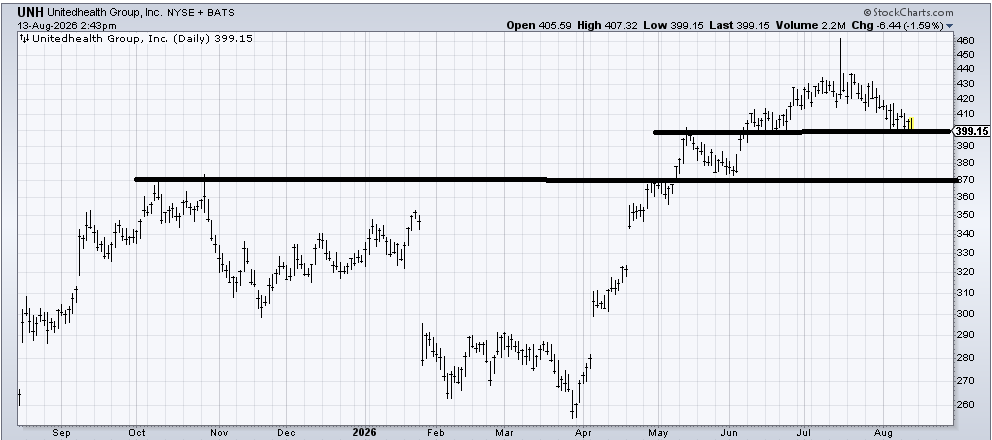
We had a great trade in United Health (UNH) when it was 270 and while it is at support at 400 and should bounce I would be inclined to take profits up here. The stock had a big spike on earnings and gave it up, which is often not a great sign, especially after the stock was up 60% from that low in the spring.