GE’s Power Spinoff Stands at the Crossroads
GE Vernova stock is testing a key moving average.
You've reached your free article limit
You've read 0 of 1 free Pro articles.

More than ever, the world needs power. Global electricity demand is expected to climb by 3.6% this year. U.S. power consumption is expected to reach 4268 kilowatt hours in 2026, a new record high.
GE Vernova (GEV) is one of the many beneficiaries of the AI/data center boom, and the massive thirst for energy it creates. This spinoff from General Electric produces equipment and provides service for gas, nuclear and hydro power generation.
What Have You Done For Me Lately?
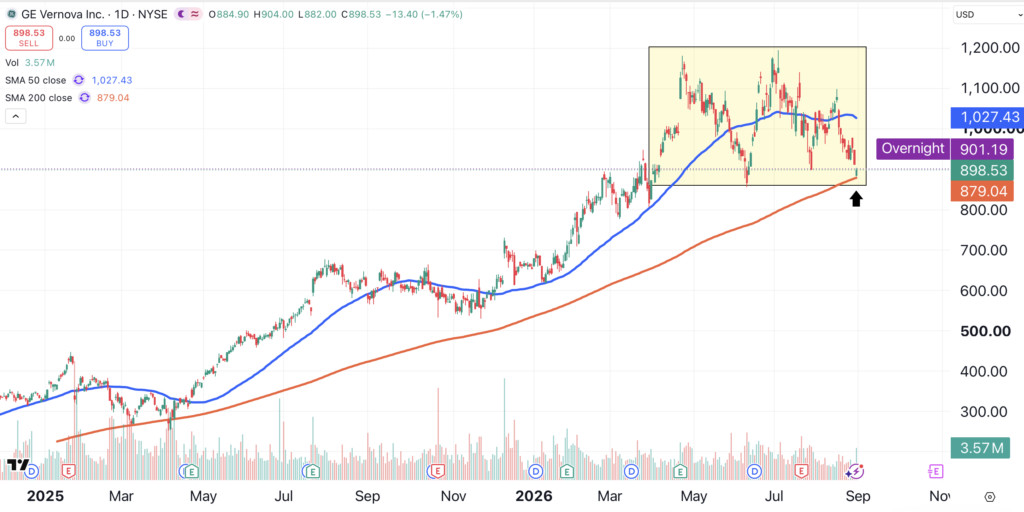
GE Vernova has gained about 165% since we first recommended the stock in late 2024, climbing from $340 to nearly $900 over that span.
While a 165% gain sounds nice, at one point this stock traded at nearly $1,200. GE Vernova shares have declined 24% since the stock reached an all-time high of $1174 on June 30.
Worse, the stock has formed a bearish triple top pattern (shaded yellow), an indication that a further decline is likely. GE Vernova is threatening to break below its 200-day moving average (red) for the first time in over a year (arrow).
It’s been an amazing run, but do we really want to risk a further decline? The time has come to close our long position in GE Vernova.
Strong Correlation
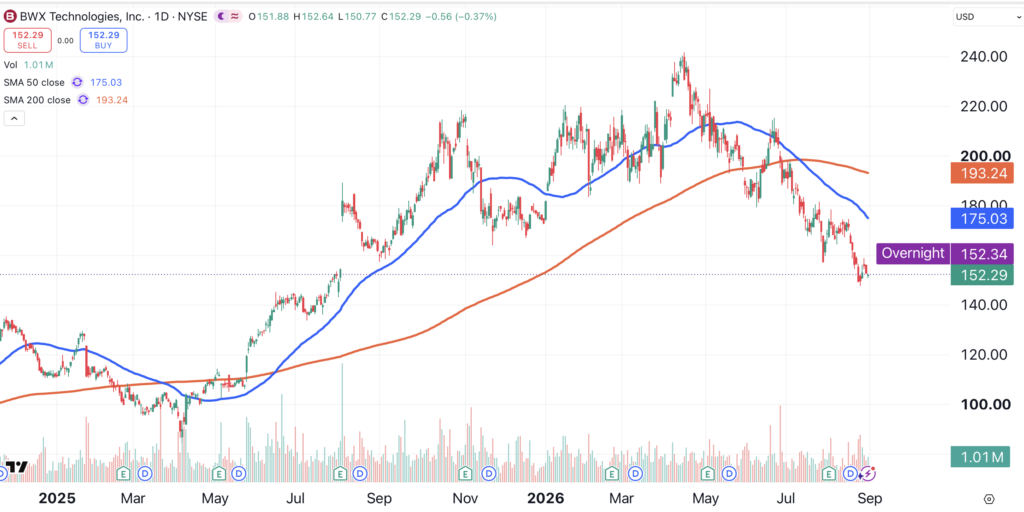
Another name we recommended in late 2024 was BWX Technologies (BWXT). This Lynchburg, Tennessee-based supplier of nuclear reactor components and fuel rallied from $133 to $240.
Then, the stock reversed and fell below its 200-day moving average (red), triggering a sell signal. Since then, BWXT has continued its decline and formed a bearish trend.
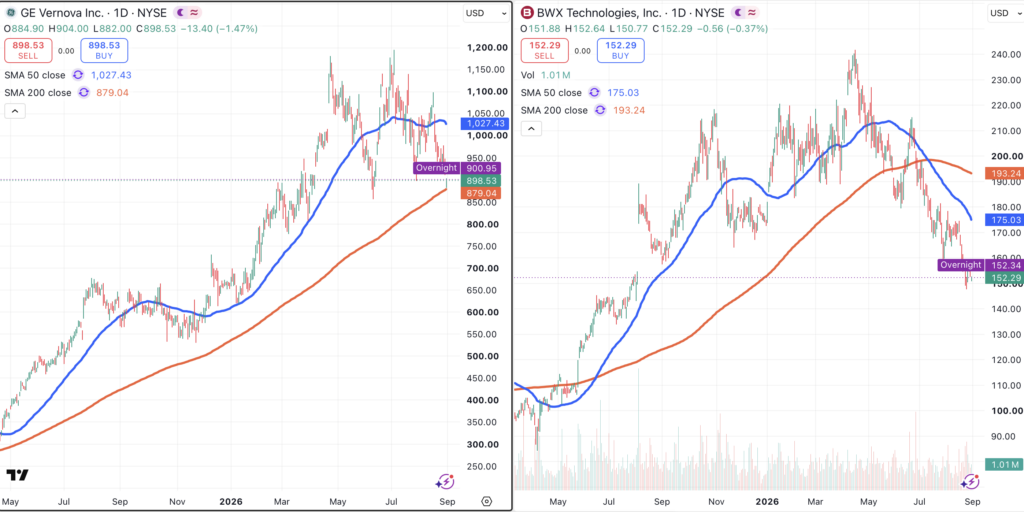
If you want to know why I’m willing to pull the trigger immediately on GE Vernova (left chart), it’s partly due to its relationship to BWX Technologies (right chart). These two names correlated nicely on the way up, so it’s not difficult to imagine that relationship remaining intact as both stocks reverse direction.
Risk Management
A good general guideline for exiting a trade is a break below a key moving average. This is especially true if the stock has fallen significantly off of its highs. At the very least, a reduction in the size of the position would be appropriate.
If you’re holding a stock at all-time highs, and then it breaks below its 200-day moving average, the chart is reflecting some kind of underlying fundamental change. This guideline can be applied to most stocks. This is the reason why the 50-day and 200-day MAs are usually present on my charts.
Bottom Line
Investors who wait to “find out what’s wrong” with a stock often don’t have the answer to that question until it’s too late. Meanwhile, the charts are flashing a warning sign that some kind of change is already underway.
Traders don’t need to know what is specifically “wrong” with a stock, they just need to understand that someone with better information is selling in size. That’s what is pushing the stock below its key moving averages, and that alone is reason enough to sell.
At the time of publication, Ponsi had no positions in any securities mentioned.