Evolv Reports, and Here’s What I’d Do … If I Had the Cash
The $10K Portfolio holding Evolve Technologies reports and here’s my take on what to do now.
You've reached your free article limit
You've read 0 of 1 free Pro articles.

Portfolio holding Evolv Technologies (EVLV) earlier this week released second-quarter financial results, posting an adjusted loss per share of $0.02 (unadjusted loss per share of $0.05) on revenue of $43.753 million. These results appear to be mixed to better than mixed. The top-line print beat Wall Street’s expectations and was good for year-over-year growth of 34%. The adjusted bottom-line result met expectations while the unadjusted bottom line beat Wall Street by a penny per share.
Looking beyond the headlines, Evolv ended the period with an ARR (annual recurring revenue) of $132.7 million, which was up 20% year-over-year and a remaining performance obligation, or RPO, of $312.6 million, which was up $13.6 million sequentially. President and CEO John Kedzierski commented, “Our strong second quarter results were highlighted by the addition of 70 new customers, accelerating adoption of Evolv eXpedite, and further strengthening of our renewal trends. Demand for our AI-powered weapons screening solutions continues to grow as organizations increasingly prioritize public safety while seeking security solutions that reduce friction and improve the visitor experience.”
Operations
As revenue generation grew 34% to $43.753 million, the cost of that revenue increased 33.5% to $21.801 million. This left a gross profit of $21.952 million (+35.4%). Gross margin printed at 50.2%, up from 49.8%.
Total unadjusted operating expenses hit the tape at $32.503 million, leaving a unadjusted operating loss of $10.551 million. Once accounting for interest, other income & expenses and taxes, unadjusted net loss landed at negative $9.298 million, up from negative $40.535 million. That works out to a loss of $0.05 per fully diluted share, up from the year ago comp of negative $0.25.
After adjustments, primarily for stock-based compensation expense, operating income / loss hit the tape at negative $2.601 million, up from negative $5.207 million. After adjustments, net income / loss landed at negative $3.095 million, up from negative $4.667 million. This works out to a loss of $0.02 per share, up from the year ago comparison of a loss of $0.03.
Guidance
For the full year, Evolve is increasing its revenue guidance from $175 million – $180 million to $180 million – $185 million. The company’s view for year-end ARR now stands at $148 million – $150 million, up from previously issued guidance for $145 million – $150 million. Guidance for adjusted earnings before interest, taxes, depreciation, and amortization margin remains in the high single digits in percentage terms.
Balance Sheet
Evolv ended the period with a cash position of $63.365 million and inventories of $8.66 million. That puts current assets at $149.407 million. Current liabilities add up to $126.849 million, including deferred revenue (not an actual financial obligation) of $74.464 million) and no short-term debt. This puts the current ratio (adjusted for deferred revenues) at a robust 2.85. The adjusted quick ratio stands at an equally strong 2.69.
Total assets amount to $302.023 million. There is nothing labeled as intangible taking up space here, which we appreciate. Total liabilities less equity comes to $183.165 million. There is some more deferred revenue and there is long-term debt of $28.737 million, that is easily covered by the cash position. This is a very healthy balance sheet.
My Take
I think this was a very solid report. The business is growing. Execution is improving. ARR and RPO reflect the breadth of demand. The balance sheet is in great shape. The guidance is solid. I see no reason not to grow this position when cash is available and while the stock still trades at these levels.
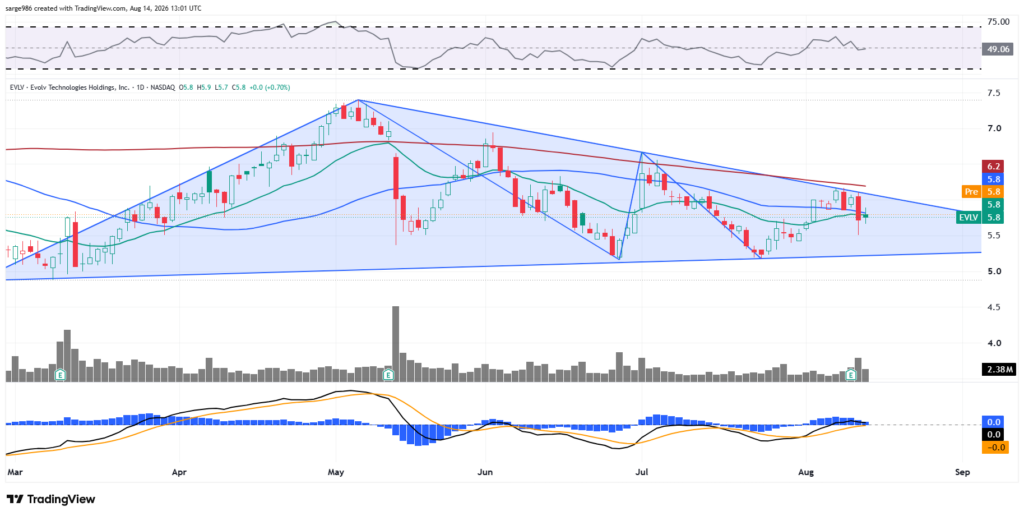
Readers will see that the shares of EVLV have created a bona fide “Triangle” pattern that appears to be closing. What does that signal gang? A volatile breakout. What does this not signal? Direction. I am thinking though that the business is strong enough and the share price is low enough that the risk / reward proposition here, may just be in the portfolio’s favor. This upside pivot here is the $200-day simple moving average at $6.20.
Target Price: $8.50 (reiteration)
Pivot: $6.20 (200-day SMA)
Add: down to the lower trendline of the triangle
Panic: Loss of the triangle pattern.
Thursday’s Intention vs. Actual Trade
- Purchase 25 shares of ONDS at or close to the last sale of $9.25.
– Bought 25 shares of ONDS at $9.13.
Thursday’s Intentions
– Note: I would buy 20 shares of EVLV if the portfolio had the cash.
- Purchase 5 shares of EVLV at or close to the last sale of $5.78.
Current Positions
Long 300 shares of ALTO at $5.0782. Target Price: $8. Last sale: $4.22.
Long 80 shares of EVLV at $5.8959. Target Price: $8.50. Last sale: $5.78.
Long 115 shares of OCUL at $8.3545. Target Price: $11. Last sale: $10.08.
Short one OCUL $11 Sep 18th call at $1.65, Last sale: $1.38.
Long 275 shares of ONDS at $8.491. Target Price: $14. Last sale: $9.43.
Long 50 shares of PL at $24.4758. Target Price $46. Last sale: $25.00.
Long 8 shares of RKLB at $71.4888. Target Price $101. Last sale: $81.09.
Long 100 shares of SOFI at $15.7153. Target Price: $24. Last sale: $18.45.
Long 50 shares of SWBI at $15.2614. Target Price: $19. Last sale: $14.08.
Long 100 shares of VELO at $12.2986. Target Price: $21. Last sale: $15.53.
Cash: $51.48.
Portfolio Value: $11,396.83, +14.0% from inception on March 24.
At the time of publication, Guilfoyle was long ALTO, EVLV, OCUL, ONDS, PL, RKLB, SOFI, SWBI, VELO and short OCUL.
