AMD Gets a Boost, So Here’s My Plan
Amid trading volatility as Nvidia gets ready to report, AMD gets an upgrade by a star analyst.
You've reached your free article limit
You've read 0 of 1 free Pro articles.

We’re talking about an “upgrade” and for one of our favorite stocks, too. Raymond James analyst Simon Leopold on Tuesday morning upgraded long-time Sarge-folio fave Advanced Micro Devices (AMD) to a “Strong Buy” from “Outperform,” which is already a buy-equivalent rating. Leopold also boosted the price target to $641, up from $565. Leopold is projecting that AMD, after extending its AI factory framework to the server central processing unit market, will drive revenue growth of 44% annually to a total of $201 billion in the year 2030.
The accompanying note asserts that this growth will be driven by conventional data center demand, by central processing units that host and coordinate accelerators, and by CPUs that support agentic workloads. Leopold believes that AMD offers the “strongest combination of direct earnings leverage” given its data center positioning and market share gains.
How good is Simon Leopold? Leopold is rated at five stars out of five by TipRanks, but that’s not all. He is not simply a “five-star” analyst. TipRanks ranks Leopold as number 126 of the 12,495 sell-side analysts that the service tracks. He has compiled a 64% success rate over the past two years while generating an average return of 48.3%.
In addition, last week, another five-star analyst, Suji DeSilva of Roth MKM reiterated his “buy” rating on AMD along with his target price of $650. DeSilva is ranked even higher by TipRanks than Simon Leopold. According to the service, DeSilva is ranked at number 53 of 12,495. He has compiled a 55% success rate over the past two years while generating a stunning average return of 77.1%.
Earnings
The shares of AMD have been understandably volatile ahead of Nvidia (NVDA) earnings, which are due tomorrow evening. As for the (second) quarter that AMD reported back on Aug. 4, the firm posted an adjusted earnings per share of $1.66 (unadjusted EPS: $1.38) on revenue of $11.54 billion. Those the top-line, adjusted bottom-line and unadjusted bottom-line prints all beat Wall Street’s estimates. That revenue print was good for year-over-year growth of 50.1% as well.
Those net sales showed the most impressive pace of annual growth reported by AMD for any single quarter since Q2 2022. The data center alone generated sales growth of 107.4%. As for the guidance issued, AMD projected total revenue of $12.7 billion to $13.3 billion for the current quarter. That took the lower end of the given range well above the $12.5 billion that Wall Street had been looking for at the time. Additionally, during the call, CEO Lisa Su mentioned that the company expects data center driven revenue to more than double year over year for the full year of 2027.
The Chart, My Take
Readers will see that AMD rocketed out of a small “double bottom” pattern of bullish reversal this past February. The shares built a rising wedge pattern of bearish reversal while screaming higher into late June. The shares then caught at almost precisely a 38.6% Fibonacci retracement of that entire rally in late July. To say that these shares have traded in very technically predictable patterns this year would not be inaccurate.
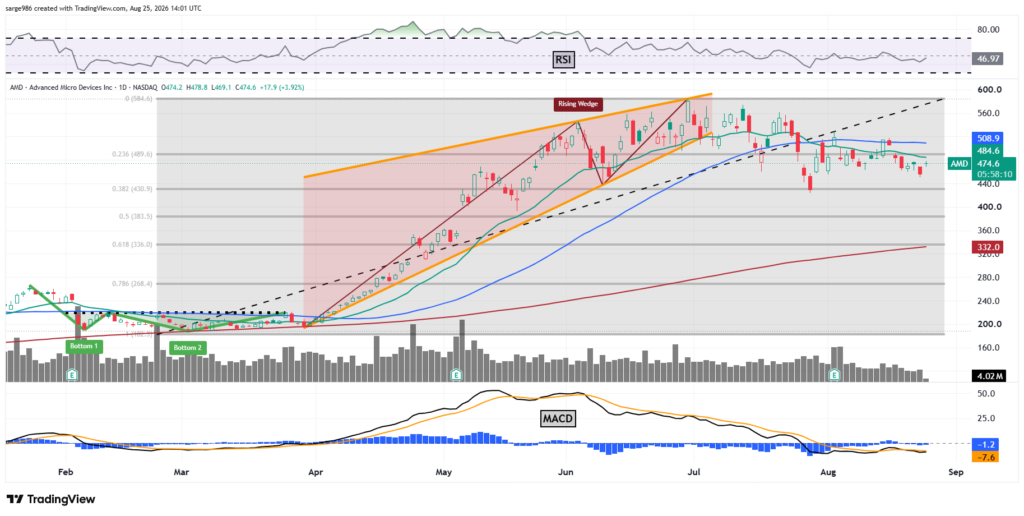
This August the stock has flirted with regaining both its 21-day exponential moving average and 50-day simple moving average and has failed to retake either. That 50-day line remains the upside pivot. The stock needs the green line to get the swing crowd back onboard and it needs the blue line to force the pros to recommit. That could be explosive.
Looking at the indicators, neither Relative Strength nor the daily moving average convergence divergence are really on the side of the bulls. Relative Strength currently stands below neutral but is improving. The daily MACD sits with all three components below the zero-bound. That said, the histogram of the 9-day exponential moving average is very close to regaining that line while the 12-day EMA is very close to overtaking the 26-day EMA. In short, a number of indicators and components within indicators are very close to sending bullish signals.
Target Price: $700 (reiteration)
Pivot: Recent 50-day SMA ($509)
Add: Down to previously tested Fib level
Panic: Loss of said Fib level
At the time of publication, Guilfoyle was long AMD, NVDA equity.
