After 7 Down Days, is the Stock Market Due for a Bounce?
The charts say that we’re just about short-term oversold and ready to bounce. Let’s take a look at the indicators to see when that bounce might happen and whether it will last.
You've reached your free article limit
You've read 0 of 1 free Pro articles.

The Market
Everyone sees it. How can they not see that we’re just about short-term oversold? When the S&P falls seven straight days, even folks who don’t even understand the concept (or pretend not to!) know the market is short-term oversold.
As you know, I have been eyeing that midweek (Tuesday/Wednesday) time frame for us to get short-term oversold. That has not changed. Many of the charts came right to the top of their spring gaps. I would love to see those gaps filled on Monday. Will we get it? I do not know.
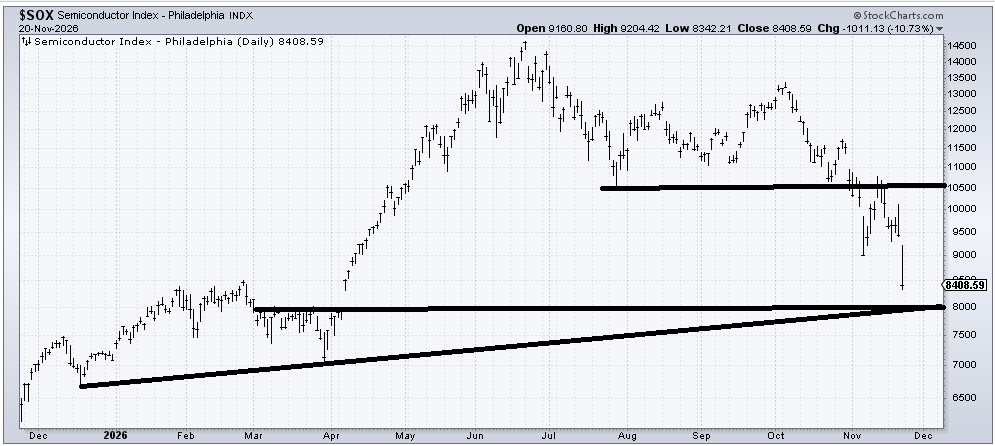
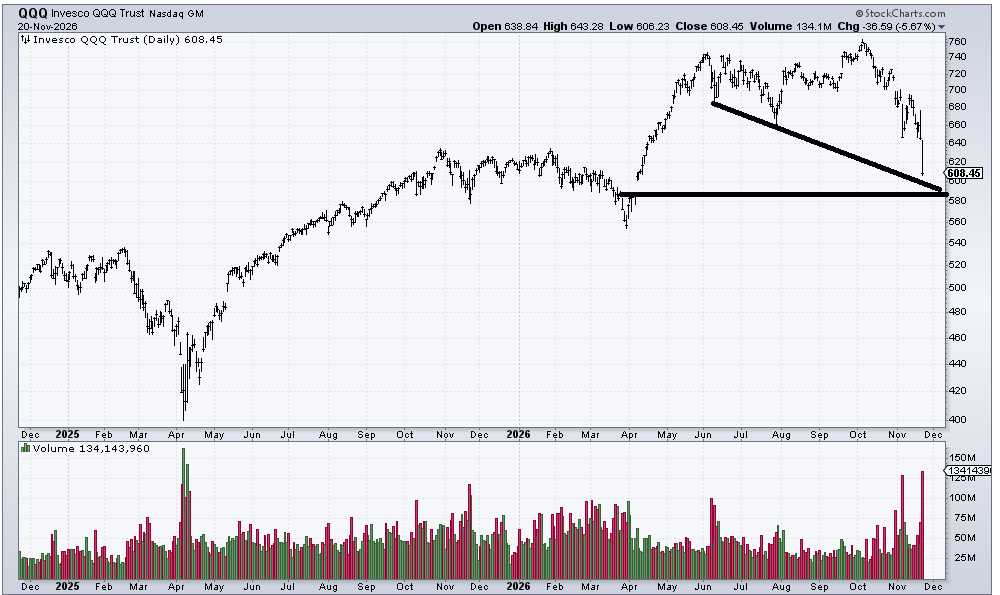
For example, there is that gap on the chart of the SOX at 8000 (nice round number) that I am certain even my mother could see (and no, she has not called yet). There is also that gap on the chart of the QQQs at 590.
That doesn’t mean there isn’t some support in the areas the market closed on Friday, just that oftentimes gaps beckon to be filled.
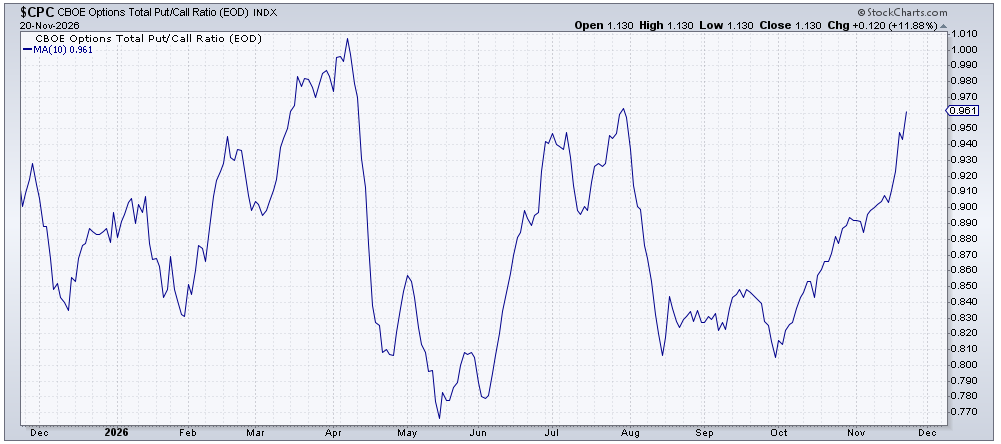
But as you know, I prefer the indicators. The VIX is jumpy. Can it get jumpier? For sure. Friday’s put/call ratio chimed in at 1.13, which was also the third straight day of readings over 1.0, so we have finally got some put buying going on. The ten-day moving average of the put/call ratio is now .96, just shy of that July peak. I would not be surprised to see this climb higher in the coming days, but I can no longer scoff that it isn’t high enough. It goes on the positive side of the ledger now.
The QQQs chimed in with some serious volume at 134 million shares. This is the highest volume since the Taper Tantrum. It is also the second time we’ve seen over 100 million shares traded during this rout.
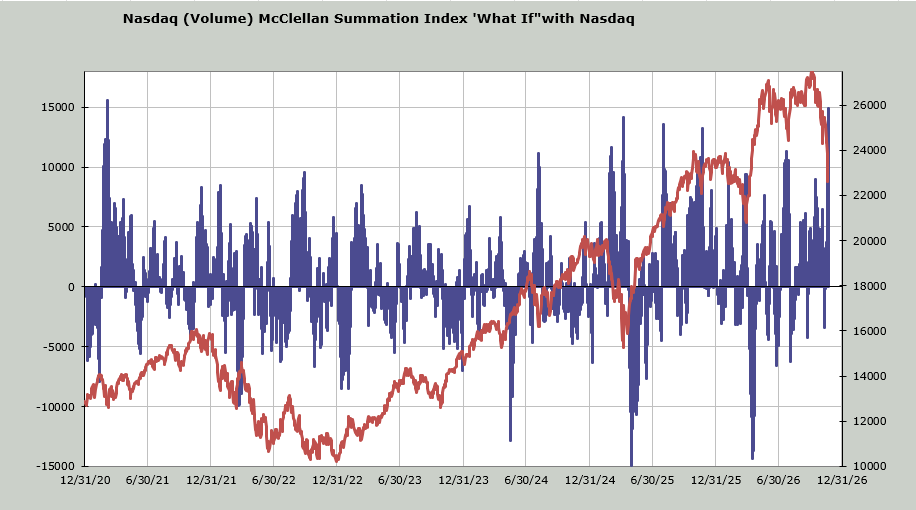
The Nasdaq McClellan Summation Index, which I use volume instead of breadth for, has been in a downtrend for months. As of Friday, it needs a net differential of +15 billion shares (up minus down volume) to stop going down. That is the highest since March of 2021. It’s extreme.
The DSI for both Nasdaq and the S&P are now at 9. Can they go lower? Yes, but my experience is that once this gets to single digits—and my indicators are oversold—we are due for a bounce.
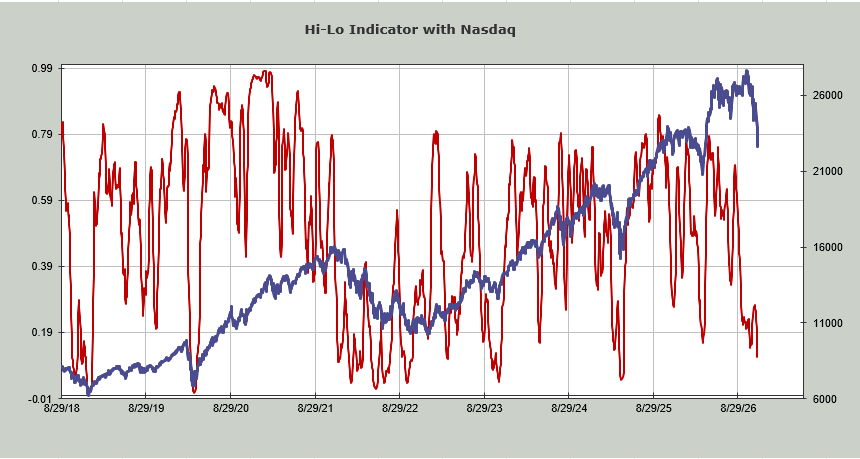
What we don’t have is any positive divergences, as the number of stocks making new lows expanded to extreme levels on Friday, with Nasdaq the most extreme, at nearly 1300 stocks making new lows. Down below you will see the Nasdaq Hi-Lo Indicator is back into oversold territory.
I still think this is a bear market, and I suspect rebounds will get sold. I do not think we have extreme fear yet (there has still not been a day where everything gets sold and 90% of the volume is on the downside), but we are oversold, and we have enough of the short-term indicators that say expect a rally this week.
New Ideas
I will always turn toward the indexes if I am looking for an oversold rally. This time is no different. I’d go with the SMH (SOX) or QQQs. If you prefer not to play for a rally, then you can look to do some selling into the rally.
Today’s Indicator
The Hi-Lo is discussed above.
Q&A/Reader’s Feedback
Helene welcomes your questions about Top Stocks and her charting strategy and techniques. Please send an email directly to Helene with your questions. However, please remember that TheStreet.com Top Stocks is not intended to provide personalized investment advice. Email Helene here.
Down below, you will see I have been asked about a number of technology stocks. The only thing I see that can change their negative chart patterns would be if we see a huge gap up Monday morning that holds, and many of these charts leave Friday’s action as an island down below.
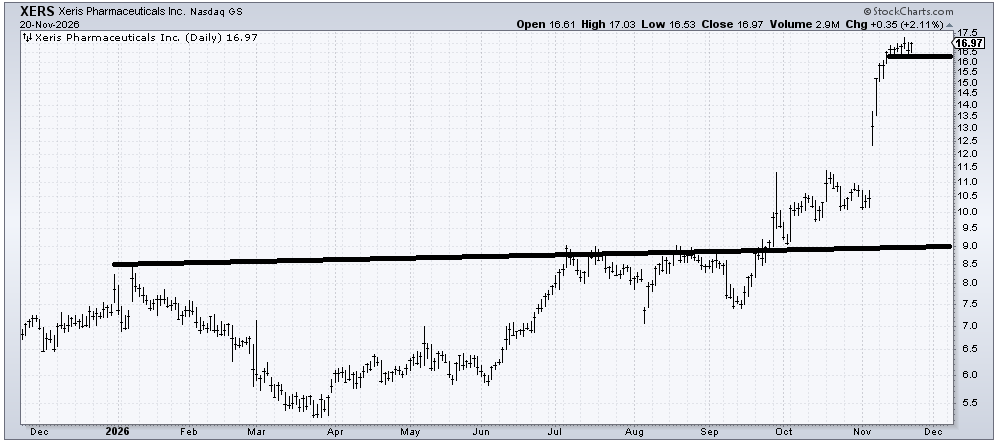
Xeris (XERS) is a light among darkness and hasn’t done a thing wrong except get overbought (in a panicky market, this would have been down last week). I’d say a correction is probably on the table if it trades under 16.
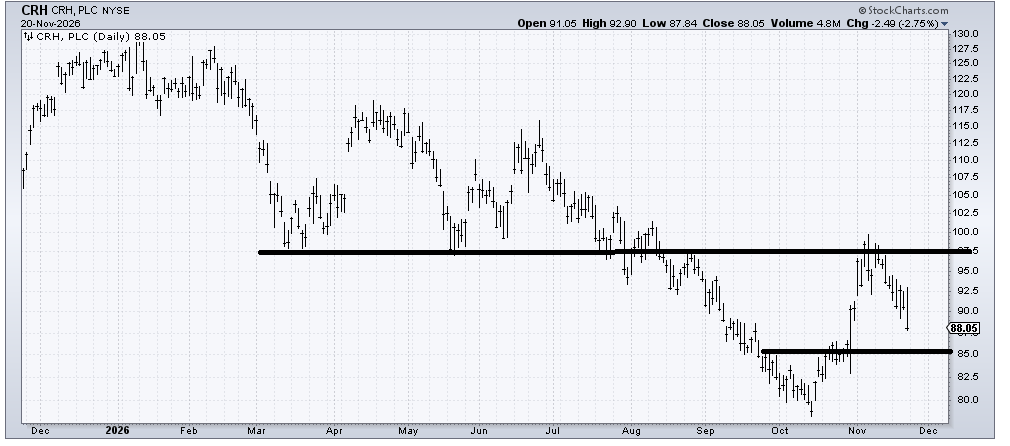
CRH (CRH) had a nice rally to resistance, and I would expect a bounce from that 83-85 area, but I think charts like this need to build bases, and that takes a long time. So an oversold bounce from that support is the best I see for now.
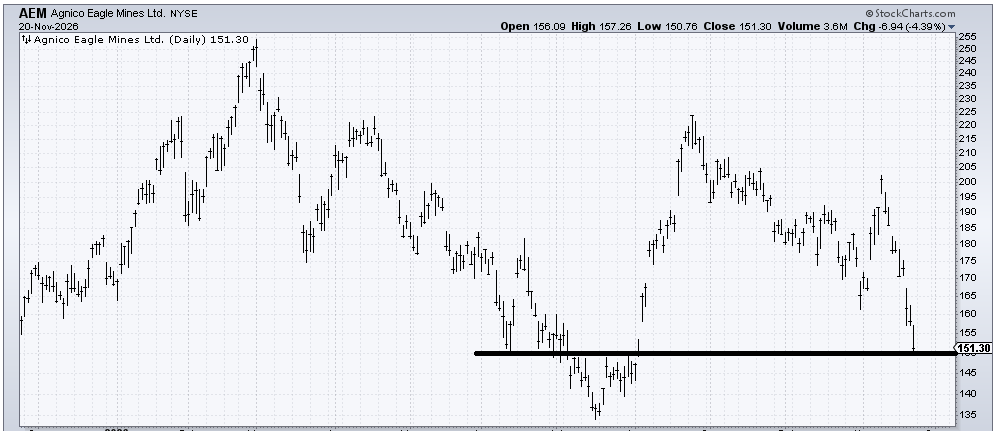
Agnico Eagle Mines (AEM) curiously has not made a lower low along with gold. And the DSI for gold is now 9. I would look for a bounce from this 145-150 area. Resistance is light at 160 and much heavier at 170’s gap fill.
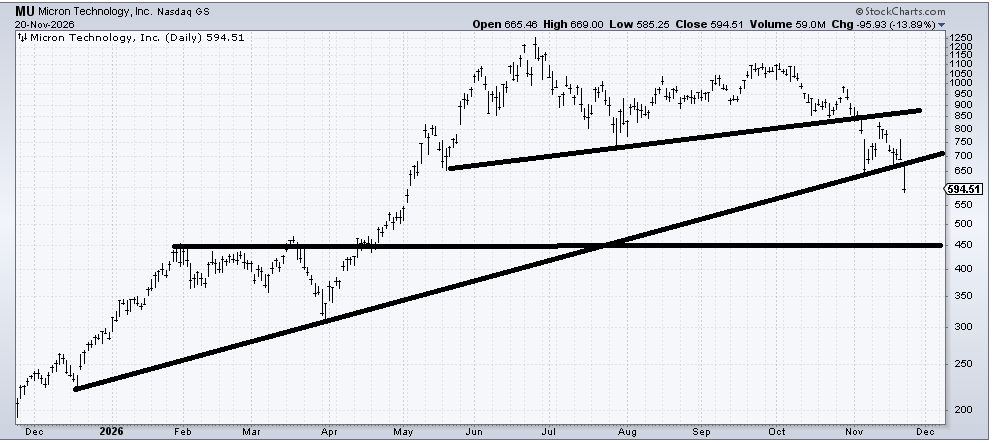
Micron (MU) is oversold, and support is far away at 450. Resistance is at 650 and stronger at 700. Because I think the semis rally, I would love to see this down one more day before a rebound. If it cannot recapture 700, then I think on a longer-term basis this will head back to the 450 area.
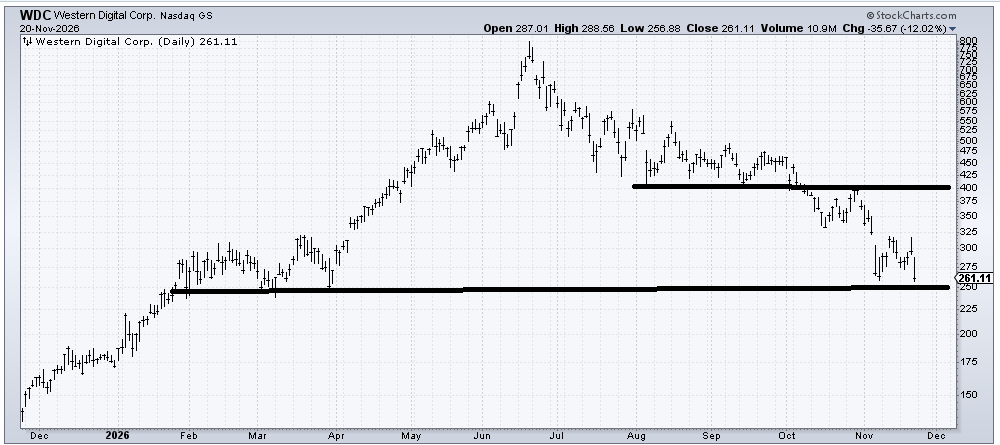
My old friend Western Digital (WDC) finds itself with some decent support in the 250 area. If that breaks badly, then the next support (and measured target) is all the way down at 175.
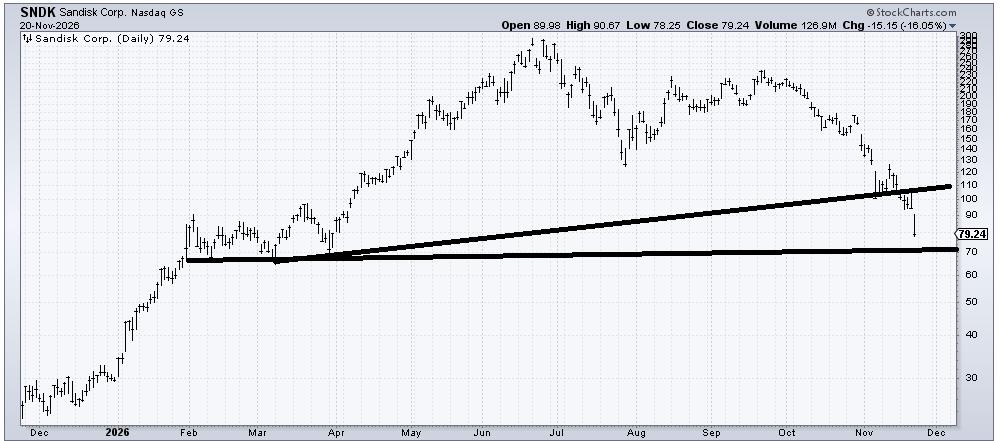
Sandisk (SNDK) is into support near 70. Unless it can gap up over 95 and hold it (leaving Friday’s action as an island), then I’d look for resistance in that 95-100 area.
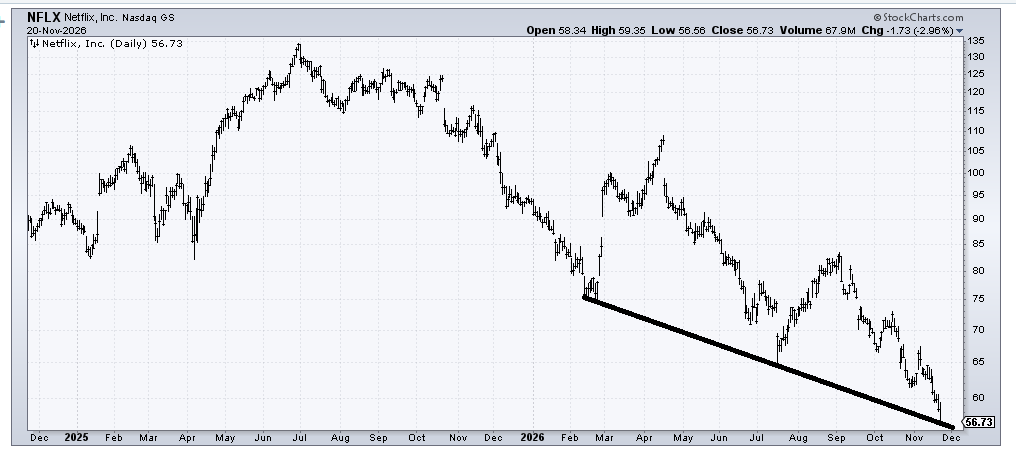
Netflix (NFLX) is perhaps indicative of this bear market. A former fan favorite that keeps enjoying terrific rallies but in the end just goes on to make lower lows. It’s oversold and at some support, but a rally into the low to mid 60s is about the best I think it can do at this moment in time.
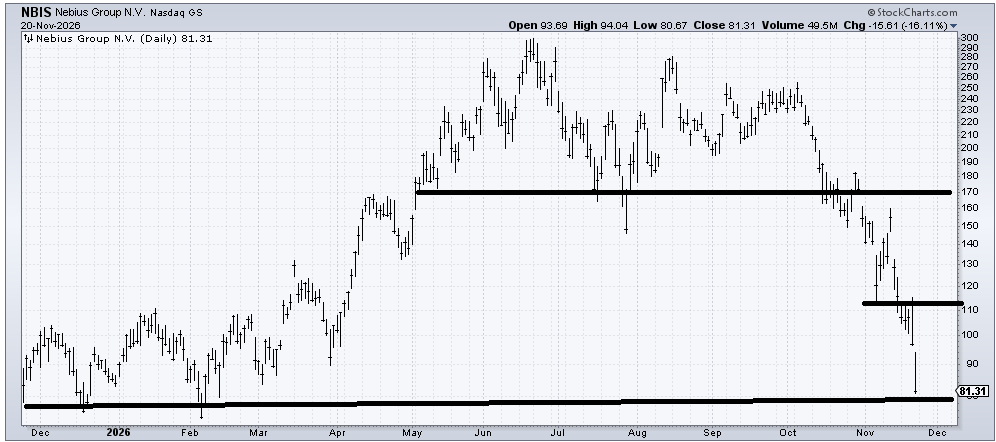
Nebius (NBIS) is oversold, at support, and due for a bounce. I don’t even know where I would put resistance except in that 110-115 area. The question is if it can get that far.