Weekly Roundup: How We’re Navigating the Fed’s Hawkish Pivot and Iran Risk
We locked in big gains, raised a few price targets, and extended our lead over the S&P 500 this week.
You've reached your free article limit
You've read 0 of 1 free Pro articles.
Friday’s selloff after the May Employment Report wiped out gains registered earlier in the week for the S&P 500 and the Nasdaq Composite, but both of the indexes are still up double digits quarter to date. We can say the same for the Pro Portfolio, which widened its quarter-to-date and year-to-date leads over the S&P 500 this week. That’s not to say the Portfolio wasn’t affected by Friday’s selloff — it was — but our focus on risk management, keeping the Portfolio’s inverse ETFs in play, and recent profit-taking moves helped limit the impact.
As we discussed in our Alert on the May jobs report, while the renewed strength in the labor market is a good thing for consumers and the overall economy, it also removes the Fed’s concern about a slowdown, or worse, in the labor market. What that means is the Fed’s focus will pivot to a more focused one on the renewed inflation pressures we’ve been discussing the last few months.
With the duration of the Iran war continuing, oil prices still at elevated levels, the Strait of Hormuz still largely closed, and the follow-through that is fostering other inflation pressures, the market is factoring in an adjustment from a potentially dovish tilt from new Fed Chair Kevin Warsh to a more hawkish Fed. U.S. Treasury yields surged following the report, with the yield on the 2-year note, which typically moves in step with Fed rate expectations, hitting a 15-month high. The benchmark 10-year U.S. Treasury, which influences borrowing costs on mortgages and other loans, rose to 4.538%, its highest level since May 21.
Investors are also likely wary of weekend flare-ups in the Middle East. Iran reaffirmed support for the Hezbollah militia and demanded that Israel withdraw from southern Lebanon, complicating efforts to end the broader conflict between the U.S. and Iran. However, Israel has said it would not withdraw troops from Lebanon.
Several times we’ve flagged the market’s significant runup since its late March bottom and its overbought condition. Add in nine weeks of consecutive gains for the S&P 500, and it’s not shocking to see the market’s reaction to that combination of items.
Next week, we have Apple’s (AAPL) WWDC event, and much is expected at the final unveiling of its revamped, AI-enabled Siri. We also have the May CPI and PPI reports, which, based on other May data, should show another move up in inflation pressures.
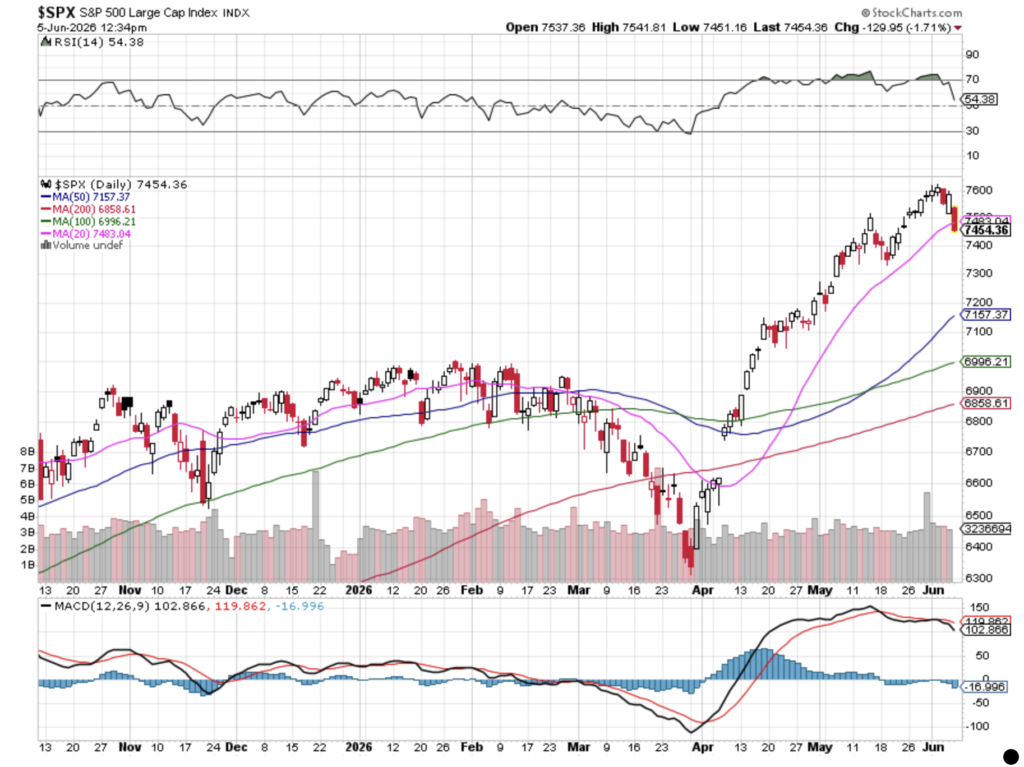
When trading begins next week, we’ll be looking to see if support for the S&P 500 at its 20-day moving average holds. If not, the next layer of support clocks in near 7157, roughly 3%-4% lower. While that may sound painful, it would be a small decline relative to the current year-to-date performance for the S&P 500. Let’s also remember that on average, the S&P 500 experiences three to four pullbacks of 5% or more each year. Sometimes the reminder of that can be a hard pill to swallow, especially on the back of nine consecutive weeks of gains.
While we pay attention to weekend developments and those coming at us in the first half of the coming trading week, we will be revisiting pick-up points for existing Portfolio positions and candidates in the Bullpen.
While we get working on that, enjoy your weekend and Saturday’s Signals alert. See you back here, bright and early on Monday.
Catching Up on the Portfolio This Week
The Portfolio had another very nice week as it expanded it quarter-to-date and year-to-date lead over the S&P 500. We’d note that this came even in the face of the late-week declines in Broadcom (AVGO) and Palantir (PLTR). Lending a very big hand in overcoming those declines were shares of Marvell (MRVL) and their substantial week-over-week gain. Meaningful movements to the upside in Applied Materials (AMAT) and Axon (AXON) also helped out quite a bit, as did the other holdings that outperformed the S&P 500 this week. Meanwhile, our inverse ETF positions helped alleviate some of the sting associated with Friday’s market selloff.
Moves we made in 2025 and earlier this year are paying off, but we have yet to meet the halfway point for 2026, which means we will remain prudent and vigilant investors — mindful of risk, but also on the lookout for opportunities to lock in gains and put capital to work. We will also continue to position and re-position the Portfolio as needed, following where capital is being deployed and the signals, we pick up week in, week out.
On Tuesday, we took advantage of the “gift” given to us by Nvidia (NVDA) CEO Jensen Huang when he named Marvell the next potential trillion-dollar market cap company. That move on June 2 saw us lock in a gain of ~400% on that slug of MRVL shares. While we certainly agree with Jensen Huang that networking is poised to be a bottleneck for AI adoption, as responsible investors, we have to acknowledge when an opportunity presents itself to lock in a slice of massive gains in a Portfolio holding. Even after that latest ringing of the register, MRVL shares still account for around 3% of the Portfolio’s assets, giving us ample exposure for AI, data center, and networking demand.
On Wednesday, we added heavy and medium-duty truck company Paccar (PCAR) to the Bullpen, where it joins recently added Boeing (BA), Starfighters Space (FJET) and Dutch Bros (BROS). The same day, we upped the Portfolio’s price target for Morgan Stanley (MS) to $225 from $205. We also called out that as MS shares make their way to our new target, there is the possibility that it would lead the position size to move past a 4.5%. Should that happen, it will more than likely trigger some prudent Portfolio action on our part.
Thursday, we increased our price target for Broadcom (AVGO) shares to $525 from $475 and lifted our rating to a One from Two. As AVGO shares settle out and find their footing following the market reaction to its quarterly results and guidance this past week, we are inclined to pick up additional shares for the Portfolio.
On Friday, we used the continued melt-up in Morgan Stanley ahead of next week’s SpaceX IPO pricing to cleave off a very profitable slice. We continue to see a robust IPO market and M&A activity, which bodes well for its investment banking fees in the coming quarters. With that in mind, we are keeping a sizable position in the shares, but we will remain disciplined investors. Should we see the position size run past 4.5% again, we will once again bow to our portfolio discipline.
Exiting the week, the Portfolio’s cash position stood around 10.5% of its assets, and we are closely tracking some of the newer additions to the Bullpen as well as opportunities in a few of our existing positions.
Now let’s see what others on Wall Street had to say about the Portfolio’s holdings during the week:
Monday, June 2: Alphabet (GOOGL) received a price target increase from Piper Sandler, raised to $445 from $425. Broadcom (AVGO) had its price target raised to $485 from $470 at Morgan Stanley ahead of earnings. Nvidia (NVDA) was added to DA Davidson’s Best of Breed Bison List. Costco (COST) was also added to DA Davidson’s Best of Breed Bison List. Microsoft (MSFT) received a price target increase from Wells Fargo, to $650 from $625, and was initiated with an Outperform rating at Citizens. Citi noted it was incrementally positive on Apple (AAPL) iPhone shipments.
Tuesday, June 3: Marvell (MRVL) saw a significant price target increase from Stifel, raised to $321 from $230. Alphabet received a price target cut from HSBC, lowered to $420 from $435. Meta Platforms (META) was upgraded to Buy from Neutral at Arete Research.
Wednesday, June 4: United Rentals (URI) received a price target increase from UBS, to $1,145 from $1,025. On Apple, UBS published a cautious note suggesting WWDC is unlikely to serve as a meaningful positive catalyst for shares. Alphabet was referenced in a TD Cowen note highlighting that the company’s AI infrastructure spending commitments underscore the scale of industry capex buildout.
Thursday, June 5: JPMorgan increased its Broadcom target to $580 target (from $500), followed by KeyBanc at $575 (from $500), BofA at $530 (from $450), Oppenheimer at $535 (from $450), Deutsche Bank at $515 (from $430), Morgan Stanley at $502 (from $485), Benchmark at $545 (from $485), Truist at $550 (from $545), RBC Capital at $400 (from $360), and DA Davidson at $400 (from $375). Elsewhere, Morgan Stanley noted it came away from Computex more bullish on Nvidia’s competitive leadership, and UBS reported Apple App Store revenue tracking at approximately 4% growth quarter-to-date.
Friday, June 6: Erste Group upgraded Broadcom to Buy from Hold.
Key Global Economic Readings
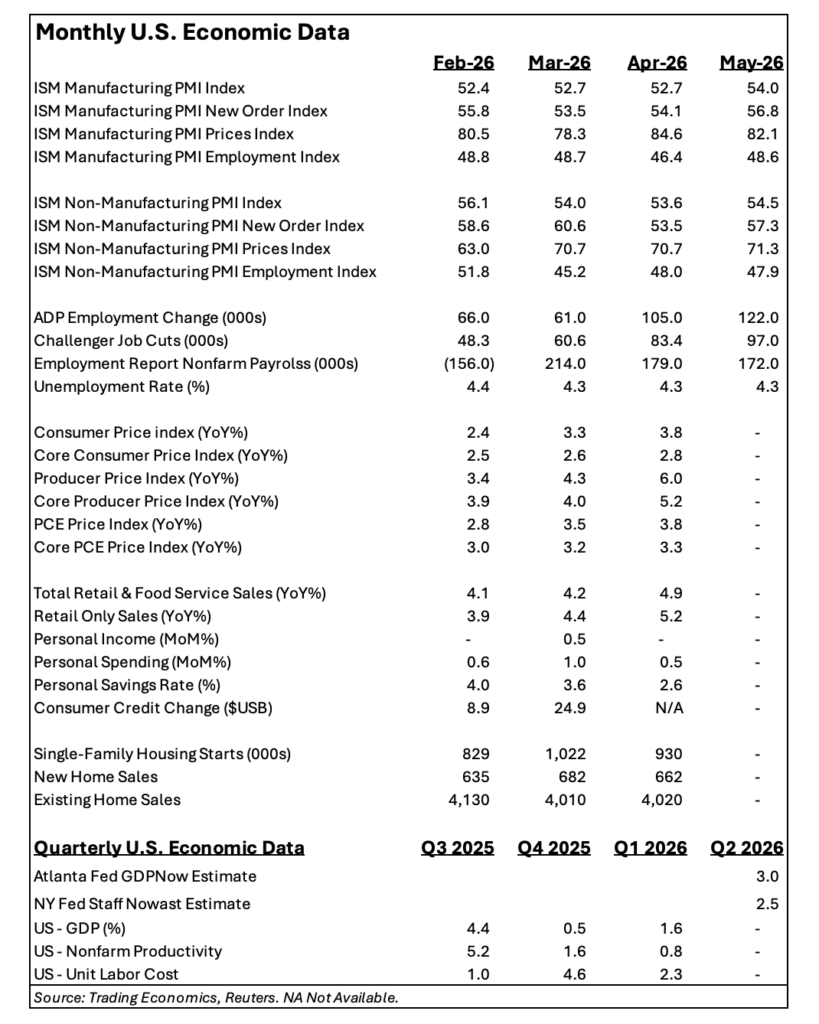
Chart of the Week: The Dow Jones Industrial Average
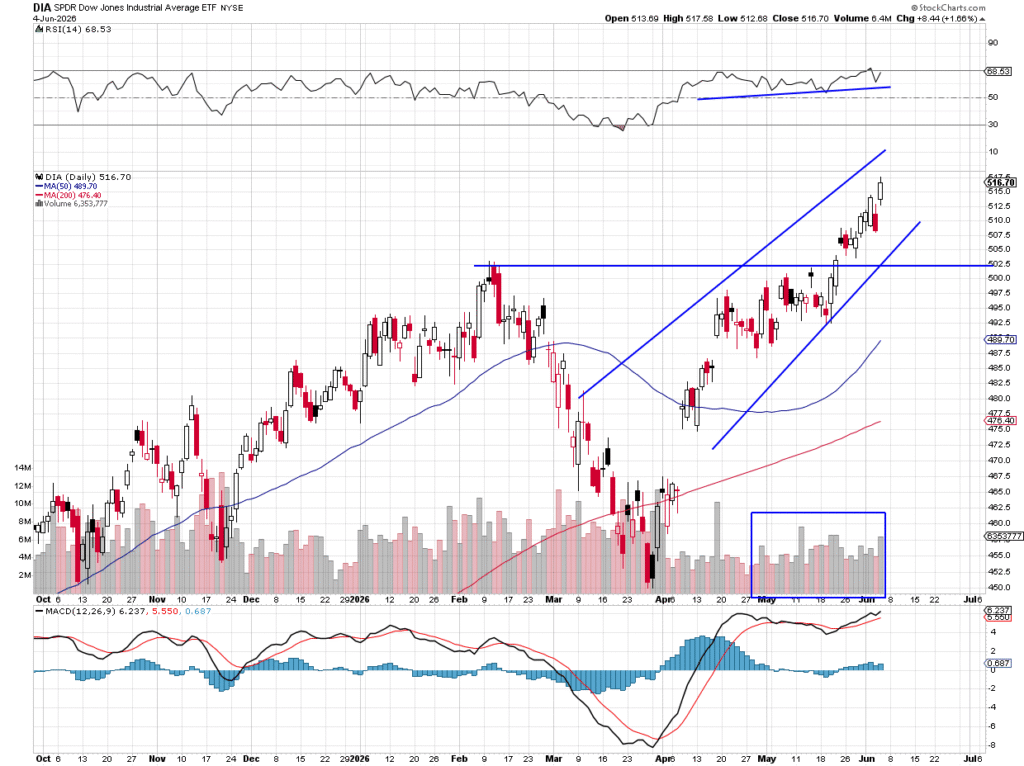
We have experienced some good bullish action in the indexes lately, but there is some notable separation. The Dow Industrials, represented by the State Street SPDR Dow Jones Industrial Average ETF Trust (DIA), are lagging the other indexes badly. In fact, you could say the Nasdaq and Russell 2000 have lapped the Industrials a couple of times this year. However, perhaps it is time for the Dow 30 to finally step up and outperform.
The DIA is up about 7.4% in 2026, a respectable gain after a nearly 13% rise in 2025. Under the current conditions of strong earnings, moderate inflation, and a thriving consumer (in most instances), the time is right for the Industrials to shine. This week has seen the DIA take the lead, that is, after a very poor performance on Wednesday, but that was a large drop on low volume. Remember, volume is like a polygraph test, there is no lying when money is put down.
The technical condition of the Industrials is without a doubt bullish, with a streak of higher highs and higher lows. That is our textbook definition of an uptrend. MACD is also on a strong buy signal, and while the ETF is far away from the 50-day moving average (in blue) this simply shows how strong the market has been over the last 50 days.
If there is a pullback, we can see a natural spot to test, and that would be the February high, which sticks out like a sore thumb on the chart. That comes in around the $502 area. One could argue the relative strength is overbought and buying here is dangerous, but an index at new highs often continues that run, perhaps another 5% or more. Volume trends have been bullish.
These 30 names are just starting to move up and while it is mostly 60% of the names, we see more room to grow here. Fortunately, we have several names in TheStreet Pro Portfolio in the DIA ETF, so we say, “let it rip higher.”
Other charts we shared with you this week were:
Monday, June 1: Russell 2000 – Can the Russell 2000 Push Things Higher?
Monday, June 1: Broadcom (AVGO) – Broadcom Is Certainly Moving in the Right Direction
Tuesday, June 2: Axon Enterprise (AXON) – Getting Impatient with Axon? Hang in There…
Wednesday, June 3: First Trust Nasdaq Cybersecurity ETF (CIBR) – Close Look at the Cybersecurity ETF as Big Names Report
Thursday, June 4: Starfighters Space (FJET) – Space Stocks Are Heating Up. We Have One in the Bullpen.
The Week Ahead
Coming off this week’s May economic numbers, the market will be focused next week on inflation data, and what it could mean for the outcome of the Fed’s next policy meeting that concludes on June 17 — specifically, the May Consumer Price Index (CPI) and the May Producer Price Index (PPI).
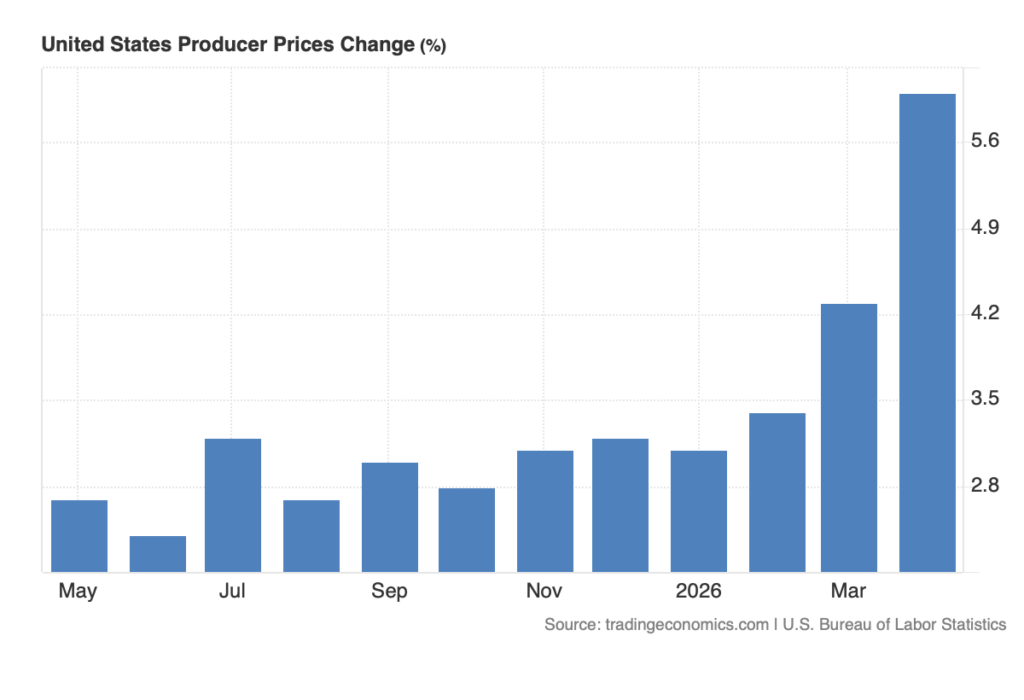
As we can see in the chart above, headline PPI was back on the rise in February, and that lift was accelerated by the U.S.-Iran war and its impact on petrochemicals, supply chains, and corresponding price hikes, including those for transportation costs. Inside this week’s May PMI data from ISM, we saw the pricing components either remain at lofty levels or tick higher. The analogous PMI data from S&P Global found “manufacturing input costs rose at a rate unmatched in nearly four years…” and in the services side of the economy, “cost pressures remained historically elevated, driven principally by rising fuel and energy prices.”
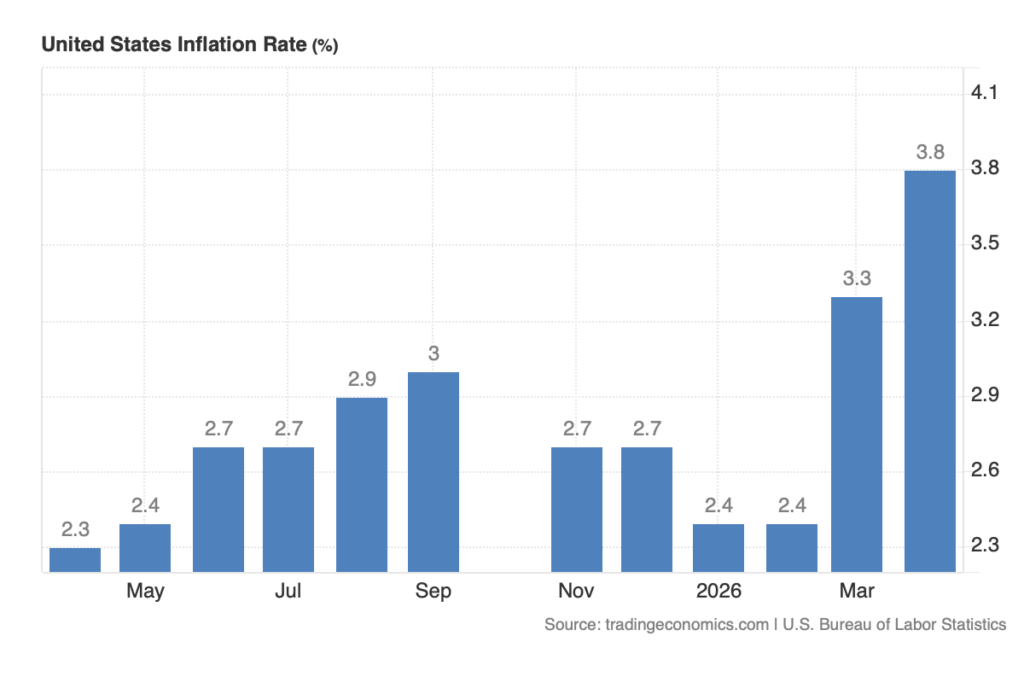
That suggests another leg up for the PPI data in May and helps explain why the Cleveland Fed Inflation Nowcasting Model sees the May headline CPI stepping up to 4.18% on a year-over-year basis. As you can see in the chart below, that would be another sizable step up, and one that could result in more hawkish comments from the Fed.
Interestingly enough, when we looked at the CME FedWatch Tool over the last several quarters, it was to gauge the market’s expectation for rate cuts. In looking at it now, we see the market is leaning more toward the potential for a rate hike than a cut. A few more inflation prints like the ones we’ve seen in recent months, and the Fed will have to answer how it plans to get inflation back down to its 2% target. We continue to think folks will not be swayed by the “trimmed inflation” argument, one that has sparked much debate among monetary policy folks.
While we tend not to go in for conspiracy theories, we all know the man who put Kevin Warsh in the Fed Chair slot would certainly prefer interest rates to be lower. We’ll soon see what Warsh says and does, and we do not envy him, especially after Friday’s May Employment Report. What could make the outcome of the upcoming Fed meeting a wee bit more difficult to anticipate is the Fed entering its pre-policy meeting blackout period on June 6. We’ll continue to follow the data and let it do the talking to us.
Here’s a closer look at the economic data coming at us next week:
U.S.
Monday, June 8
Consumer Inflation Expectations – May (11 AM ET)
Tuesday, June 9
NFIB Small Business Optimism Index – May (6:00 AM ET)
ADP Employment Change Report – Weekly (8:15 AM ET)
Trade Balance Data – April (8:30 AM ET)
Existing Home Sales – May (10:00 AM ET)
Wholesale Inventories – April (10:00 AM ET)
Wednesday, June 10
MBA Mortgage Applications Index – Weekly (7:00 AM ET)
Consumer Price Index – May (8:30 AM ET)
EIA Crude Oil Inventories – Weekly (10:30 AM ET)
Treasury Budget – May (2 PM ET)
Thursday, June 11
Initial & Continuing Jobless Claims – Weekly (8:30 AM ET)
Producer Price Index – May (8:30 AM ET)
EIA Natural Gas Inventories – Weekly (10:30 AM ET)
Friday, June 12
University of Michigan Consumer Sentiment Index (Prelim.) – June 10:00 AM ET
International
Monday, June 8
Japan: GDP – Q1 2026
Tuesday, June 9
China: Import/Exports – May
Wednesday, June 10
Japan: Producer Price Index, Machine Tool Orders – May
China: Inflation Rate, Producer Price Index – May
Thursday, June 11
Eurozone: European Central Bank Interest Rate Decision
Friday, June 12
Japan : Industrial Production, Capacity Utilization – April
We have another smattering of corporate earnings reports next week, but as we start the trading week, all eyes will be on what’s unveiled during Apple’s WWDC 2026 keynote. While this is really geared for Apple’s developer community, the keynote showcases what’s to come on Apple’s software front later this year. The big reveal that we and others have been waiting for is the revamped, AI-enabled Siri.
Our thinking continues to be that if Apple (AAPL) can delight its user base, especially the one for iPhones, with this augmented and smarter AI tool, it has the potential to unleash the upgrade cycle that many across Wall Street have been calling for. Remember, Apple Intelligence only works with the iPhone 15 Pro, iPhone 16, and iPhone 17 device families. Estimates suggest that about 80% to 85% of active iPhones, roughly 1.1 billion to 1.3 billion, cannot run Apple Intelligence natively. During the event, we’ll look to see what role incoming CEO John Ternus plays. We’ll also be looking to see if anything is discussed about Apple’s rumored iPhone Ultra, its first foldable iPhone.
In terms of corporate earnings on our radar screen next week, Oracle (ORCL) and Adobe (ADBE) will be at the top of that list, and we’ll be interested in what is discussed about AI adoption and usage. We’ll also be tracking what JM Smucker (SJM), United Natural Foods (UNFI), and Campbell’s (CPB) have to say about consumer demand across their respective product line-ups. The setup for that was Dollar General’s (DG) comment this week that some of its customers are cutting back on food purchases as they contend with the price of gas.
Next week also brings another wave of investor conferences to chew through, including:
-Goldman Sachs 47th Annual Global Healthcare Conference
-Barclays Technology, Media and Telecommunications Conference
-Morgan Stanley US Financials Conference
-DA Davidson Technology & Consumer Conference
-Jefferies Innovative Aerospace Virtual Summit
We’ll look to connect the dots from the companies presenting, tying back what we learn to the Portfolio’s holdings and those in the Bullpen.
Here’s a closer look at the earnings reports coming at us next week:
Monday, June 8
Open: Campbell’s (CPB)
Close: Vail Resorts (MTN)
Tuesday, June 9
Open: JM Smucker (SJM), SailPoint (SAIL), United Natural Foods (UNFI)
Close: Cracker Barrel (CBRL)
Wednesday, June 10
Open: Chewy (CHWY)
Close: Oracle (ORCL), Stitch Fix (SFIX)
Thursday, June 11
Open: Lovesac (LOVE)
Close: Adobe (ADBE), Lennar (LEN)
Portfolio Investor Resource Guide
Economic Data: Here’s a List of Links to the Key Economic Data We Closely Watch
Investing Terminology: 16 Key Terms Club Members Should Know
10-Ks: Want to Know About a Stock? Read the Company’s Reports
10-Qs: Unlock the Numbers and Key Information Behind Your Stock With the 10-Q
Income Statement: Our Cheat Sheet to Understanding This Financial Document
Balance Sheet, Cash Flow Statements, and Dividends: How to Know If a Company Is Off-Kilter? Read Its Balance Sheet
Valuation Metrics: Everyone Wants a Value. Here’s How Investors Can Find
Thematic Investing 101 Webinar
Like the Benefits of ETFs? Let’s Talk About Models
The Portfolio Ratings System
1 – Buy Now (BN): Stocks that look compelling to buy right now.
2 – Stockpile (SP): Positions we would add to on pullbacks or a successful test of technical support levels.
3 – Holding Pattern (HP): Stocks we are holding as we wait for a fresh catalyst to make our next move.
4 – Sell (S): Positions we intend to exit.
