Chart of the Day: Setback for Alphabet
The stock was blitzed on Thursday with news about a delay in the Gemini AI tool.
You've reached your free article limit
You've read 0 of 1 free Pro articles.
We had our hopes high this past week that Google’s (GOOGL) chart was going to turn bullish just in time for the next earnings report to hit. Unfortunately, that did not happen, as some disappointing news about its Gemini AI tool was released (it appears to be delayed). But this should not be disruptive and actually gives us investors a bit more clarity.
That news, however, clipped the stock on Thursday, shedding some 4.3% on the day and continuing down on Friday. Fortunately, the stock landed on some really strong support around the $345 to $350 area. If it holds through this week’s earnings, it will have again proven to be a powerful buying opportunity.
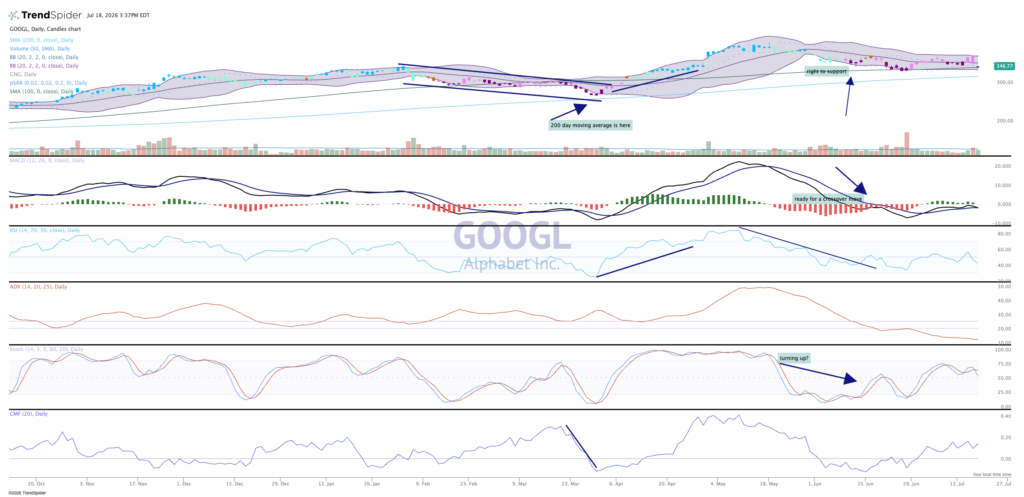
The chart, though, remains defensive, with bearish signs in the RSI and stochastics. Money flow is bullish though, and that is impressive. MACD is about to cross for a bearish signal, and candles are purple — which means price action is also bearish. Google needs to prove itself here.
We like Alphabet/Google in TheStreet Pro Portfolio and rate it a two, stockpile on pullbacks.
More Pro Portfolio
- Trimming One Holding, Adding to Another as We Boost Our Rating
- We’re Tracking 23 Signals Across 10 Portfolio Investing Strategies
- Weekly Roundup: Chip Rout Tests the Market, but Here’s How We Aim to Capitalize
At the time of publication, TheStreet Pro Portfolio was long GOOGL.
