Charting the Markets: Can the Russell 2000 Push Things Higher?
Small-cap stocks are surging and if rates fall even further it might stoke a further rally.
You've reached your free article limit
You've read 0 of 1 free Pro articles.
Let’s take a view of the small-cap Russell 2000 from 30,000 feet to see if it can provide us with some clues about future market moves. The iShares Russell 2000 ETF (IWM) moves with interest rates and other factors, but no question lower rates provide an ideal environment for growth.
The leader, of course, the past two months has been the Nasdaq, the dominant tech-heavy index with the biggest influences coming from the AI boom. Yet, small-caps participate in this sector and many others, including financials, precious metals, retail, housing and industrials.
If you didn’t know it, the IWM sits in second place in 2026 performance, just behind the Nasdaq 100. Small-caps are up 17% on the year and interestingly enough, the 2-year and 10-year yields are up sharply, something we don’t see happen much.
Why do small-caps do better in a declining or lower-rate environment? Borrowing costs are the quick answer; it’s much easier to borrow if your cash flows are challenging.
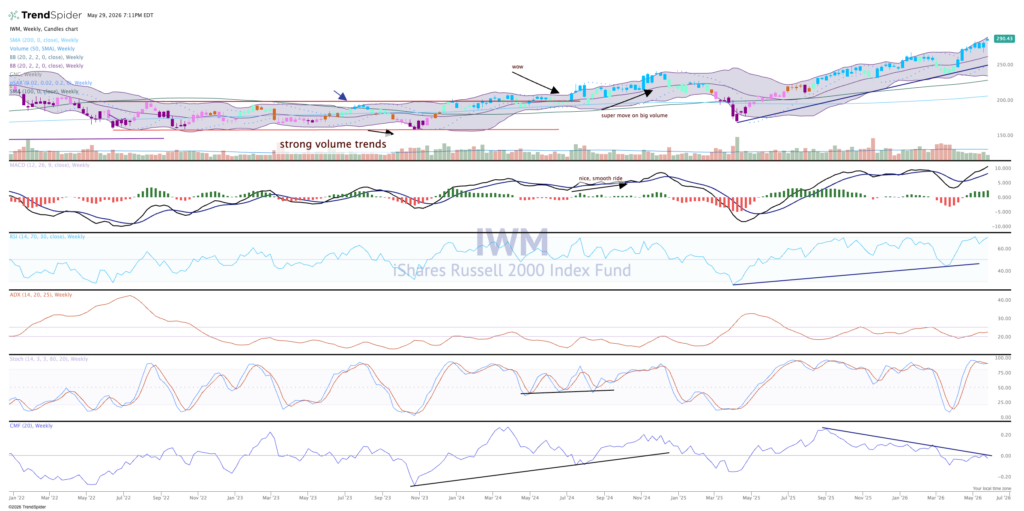
The weekly chart of the IWM is undeniably bullish. Higher highs and higher lows is a textbook pattern of an uptrend.
Indicators are supportive of the bullish trend, with stochastics (momentum) very strong, but money flows have turned a bit lower. MACD is solidly on a buy signal as the price action presses into the upper Bollinger band (top chart). RSI is overbought, but that is no reason to sell yet.
As long as this trend continues in this fashion it is up and away. The small-caps might be the one to take baton from Nasdaq and lead the rest of the market higher.
