May Monthly Roundup: Sell in May? No Way!
We put capital to work in several holdings, booked massive gains on two others, and added a new candidate to the Bullpen.
You've reached your free article limit
You've read 0 of 1 free Pro articles.
If you followed the old Wall Street adage of “Sell in May and go away” you would have missed the market’s continued upward movement during the month. Fortunately for us here at the Pro Portfolio, not only did we not follow that adage, but we put capital to work in several holdings that helped power it higher during the month. That means we not only participated in the market’s continued melt up in May, but thanks to several holdings, including Marvell (MRVL) and our EPS All-Stars basket, we closed the month ahead of the S&P 500 on a quarter to date (QTD) and year-to-date (YTD) basis.
At times like this, when more things are working than not, the natural human tendency is to coast or be lulled into a sense of security. However, given all that we’ve experienced over the decades investing, we know that is a risk to be avoided. It’s not that we’re of the mindset like former Intel (INTC) Andy Grove, who famously said “only the paranoid survive”, but we are ones that are mindful of risk even as we look for opportunities.
And while we’ve enjoyed the May performance, we are mindful that as we closed the month, both the S&P 500 and the Nasdaq Composite pushed into a deeper state of being overbought based on their latest relative strength index (RSI) levels. At the same time, expectations for a peace deal floated the market higher, and as of Friday, we are waiting to see what President Trump’s “final determination” on a preliminary deal to extend a ceasefire with Iran will be. Reports emanating from Iran indicated that no final understanding between the U.S. and Iran has been reached and that no talks about Tehran’s nuclear program were even taking place.
In our view, if all we get is a ceasefire extension with no meaningful movement on enriched uranium and questions over the reopening of the Strait of Hormuz, that could result in a “buy the rumor, sell the news” situation.
While Trump may deliver that determination late Friday, the weekend’s response will be the confirmation point market watchers watch for. That means, once again, weekend developments could determine the market mood as we begin the final month of the current quarter. Helping shape that start will be the Computex Keynote address from Nvidia (NVDA) CEO Jensen Huang late Sunday night for us that reside on the East Coast of the United States. All that means is our work for the Portfolio will begin a little earlier than usual.
In the Week Ahead, below, we lay out next week’s busy May economic agenda and the plentitude of investor conferences. The market will balance what that data reveal, management comments about the current quarter and any changes to prior guidance against the market’s renewed overbought nature. Should the data and management commentary stoke concerns, especially for second-half 2026 EPS growth prospects for the S&P 500, that could take some wind out of the market’s sails.
We will continue to follow the data and heed the signals we collect week in and week out. Should near-term developments warrant a more cautious positioning, we will do what needs to be done, but we will also be mindful of the long-term given the pronounced tailwinds that are blowing and look to capitalize on opportunities as they arise.
Enjoy your weekend, and we’ll see you back here, bright and early on Monday.
Catching Up on the Portfolio This Week
As we discussed above, May was another good month for the market, but it was also another very positive one for the Pro Portfolio. Some early pressure on the Portfolio early in May was offset by the strength in Marvell (MRVL) shares as well as those for the First Trust Nasdaq Cybersecurity ETF (CIBR), Apple (AAPL), Applied Materials (AMAT), Microsoft (MSFT), Morgan Stanley (MS) and others. The late-month rebound in Axon (AXON) and Palantir (PLTR), as well as rebound in Arista Networks (ANET) led the Portfolio to maintain its lead over the S&P 500 on a QTD and YTD basis exiting May.
Turning to the re-christened EPS All-Stars model, May was another strong month for the basket. Combined with its April performance, the basket is up more than 65% QTD. Powering the May performance, and you won’t be surprised, was the substantial move in Micron (MU) but also significant ones in Credo Technology (CRDO) and Hudbay Minerals (HBM).
When we undergo the next reconstitution process on June 30-July 1, we are contemplating another step up in the basket’s starting size for Q3 2026. And in response to questions about keeping Micron in the Portfolio, let’s first see if the reconstitution process keeps them in the All-Stars basket for Q3 2026. If it doesn’t, and subject to where MU is trading at the time, we may need to make an executive-level decision on what to do with the MU shares we currently hold.
While we did see month-over-month declines in a few positions, including Costco (COST), Eaton (ETN) and Waste Management (WM), our individual company comments below explain why we remain bullish on those holdings. We will concede that while the Portfolio’s inverse ETF positions helped tamp down some of the more volatile trading days in May, they continued to be a drag on our performance. While it may not be a popular decision, given the RSI levels of the S&P 500 and the Nasdaq Composite, which are both well past 70, indicating they are overbought, now may not be the time to close out those positions.
While we did not initiate any new positions to the Pro Portfolio May, we made more than a few moves during the month. We added to the Portfolio’s position in Palantir (PLTR) on May 6 at $134.16, and we benefited nicely from that trade following the late-month surge in the shares. On May 12, we scooped up additional shares of Netflix (NFLX) at $88.64 and we’ll continue to build up that position opportunistically.
A few days later we added to our position in Arista Networks (ANET) at $144.43, which also proved to be a nice pick-up point given where ANET finished May. Ahead of TJX’s (TJX) earnings report, we made a move on its shares, buying another round at $150.47. Our last addition for the month was on May 20, when we not only added to our position in American Express (AXP) at $310, but also upgraded our rating to a One. With AXP shares closing out May near $317, our timing on that was pretty good.
We also locked in some big gains for the Portfolio during May. We bowed to our portfolio discipline to lock in a hard-to-imagine gain mid-month in shares of Alphabet (GOOGL). Toward the end of the month, we also took advantage of the pronounced move in First Trust Nasdaq Cybersecurity ETF (CIBR) to book a 72% gain.
In April we added to the Portfolio’s Bullpen, bringing in Boeing (BA) and Starfighters Space (FJET). BA shares have bobbed and weaved but closed May down modestly from where we added them. We’re continuing to evaluate BA, and should have more to say before too long. With FJET, we are looking to hear more on the prospects for revenue generation and what that means for break-even timing. On May 27, we discussed the declines unfolding in key commodity prices and that spurred us to add Dutch Bros (BROS) to the Bullpen.
Exiting May, the Portfolio’s cash position is just over 9.5% of its assets. That gives us room to maneuver, but as we discuss below, we will be mindful of learnings from the next wave of management investor conference presentations and the overbought condition for both the S&P 500 and the Nasdaq Composite. Those factors and what we learn about U.S.-Iran peace talks could lead us to revisit the Portfolio’s inverse ETF holdings.
Portfolio Videos
Tuesday, May 26 – Wall Street Gets Bullish on 3 Holdings
Wednesday, May 27 – Goldman Turns Heads With S&P 500 Target
Thursday, May 28 – 2 Key Sticking Points for a Potential US-Iran Deal
Key Global Economic Readings
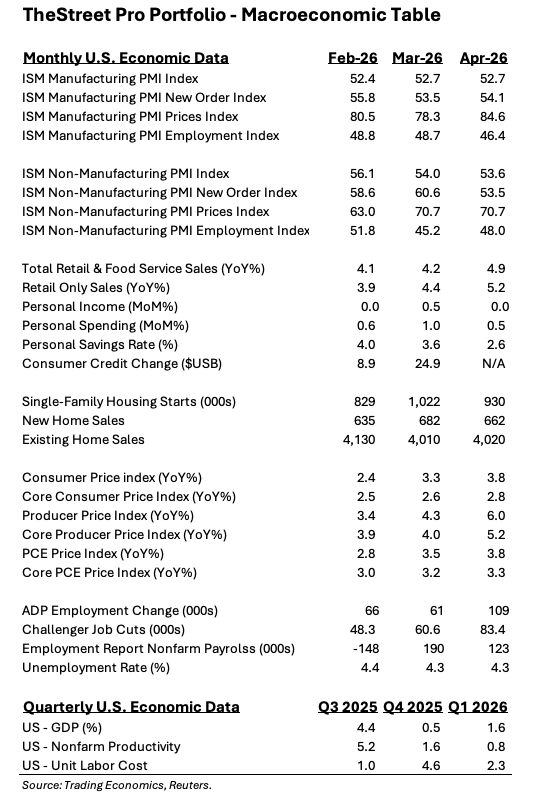
(Note: T is the most recent period, T-1 is the prior period’s reading, and T-2 is two periods back, the intent being to illustrate any trends.)
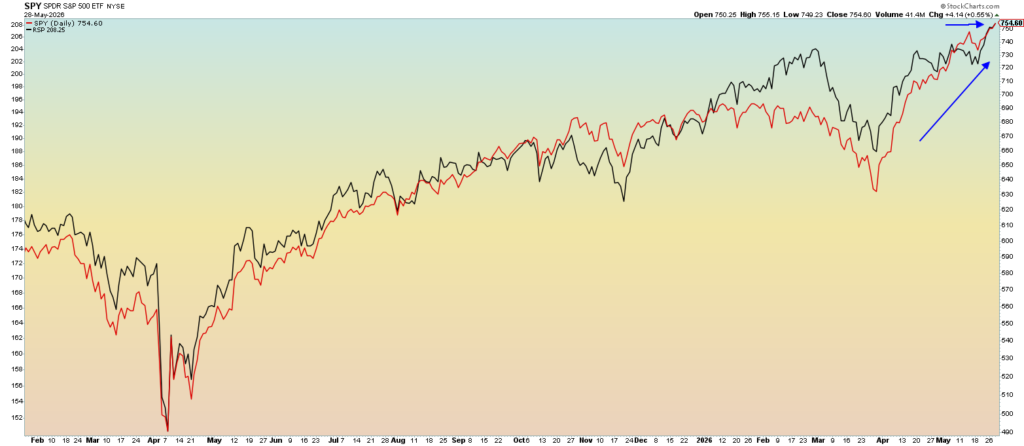
Chart of the Week: S&P 500 – Market Cap vs. Equal Weight
It is good to see both the equal-weighted S&P 500 (RSP) along with the weighted average S&P 500 (SPY) moving in tandem. The equal-weighted ETF performance gives us a great deal of information about the overall stock market. All things being equal, a strong performance by the RSP tells us there is a broadening out of the rally to include most/all groups and not just technology/AI, which has been dominant for most of 2026.
Looking across the broad landscape, we see winners in certain groups like energy, gold/silver, materials, industrials, retail and consumer discretionary. Stocks in these group share one common theme — they are not correlated to the heavyweight technology group. Hence, when the RSP is rising there is participation from several areas, so if/when a correction hits, we might only see a bit of rotation into the underperforming groups like real estate, banks/financials, defense and consumer staples.
But the SPY has really been the story lately, with a huge surge this past month following a very strong move in April. The trajectory of the SPY is steep and probably unsustainable for a longer period, but we won’t try to time the next move down. The trend is up and the trend is your friend.
This past month saw a great deal of outperformance from the semiconductor and AI-related names. If that continues look for the SPY to be the leader but the RSP is not going to be left behind.
For 2026 the SPY is up a respectable 10.7% but the RSP is also doing well, up about 10% YTD. Maybe the SPY and RSP will continue to move in tandem but if not, we should be pleased with the strength of the overall market, which can be sustained for a longer period.
Other charts we shared with you this past week were:
Tuesday, May 26: S&P 500 – Hard to Argue With Bullish Price Action
Tuesday, May 26: Costco (COST) – Costco Investors Show a Bit of Fear Before Earnings
Wednesday, May 27: Netflix (NFLX) – Netflix Is Stuck While the Market Rallies
Thursday, May 28: Costco – Costco Bulls Not Showing Much Zest Ahead of Earnings
The Week Ahead
With the pace of quarterly earnings continuing to slow, you may think we have a bit of breather ahead of us. Sorry to inform you that isn’t the case, at least for next week. There’s a full plate of economic data on tap, a sprinkling of earnings reports, include our own Broadcom (AVGO), and another array of investor conferences. Kicking it all off, will be Nvidia (NVDA) CEO Jensen Huang’s Computex keynote, which for U.S.-based Pro members will be a late Sunday night event.
While we’ll share our thoughts on Jensen’s comments as we begin the first trading week of June, it will be quickly followed by the day’s economic data. Inside the May PMI reports from S&P Global, we’ll be focusing on new orders, job creation and inflation. If we had to rank them, the learnings on inflation in May would take the lead ahead of May job creation. The same goes for the May Service PMI reports later in the week.
On the job creation front, we’ll have multiple data points to parse through. We’ll be interested in the dynamic between jobs created and shed, but questions over consumer spending power will have us focus on wage growth as well. Sticking with the consumer, while a bit dated, Friday’s April Consumer Credit data will also be of interest, especially with the April personal savings rate falling to 2.6%. For context, that level is the lowest since June 2022, and is less than half the long-term historical average of 5.7%.
As it relates to our position in United Rentals (URI), we’ll also be sure to thumb through the April Construction Spending report out on Monday. With URI shares bumping up against our price target as we move into the seasonally strongest time of the year for the company’s business, we may have a reason to reassess that target.
Here’s a closer look at the economic data coming at us next week:
U.S.
Monday, June 1
S&P Global Final Manufacturing PMI – May (9:45 AM ET)
ISM Manufacturing Index – May (10:00 AM ET)
Construction Spending – April (10:00 AM ET)
Tuesday, June 2
LMI Logistics Managers Index – May (6:00 AM ET)
JOLTS Job Openings & Quit – April (10:00 AM ET)
Wednesday, June 3
MBA Mortgage Applications Index – Weekly (7:00 AM ET)
ADP Employment Change Report – May (8:15 AM ET)
S&P Global Final Services PMI – May (9:45 AM ET)
ISM Non-Manufacturing PMI – May (10:00 AM ET)
Business Inventories – April (10:00 AM ET)
Factory Orders – April (10:00 AM ET)
EIA Crude Oil Inventories – Weekly (10:30 AM ET)
Fed Beige Book (2 PM ET)
Thursday, June 4
Challenger Job Cuts Report – May (7:30 AM ET)
Initial & Continuing Jobless Claims – Weekly (8:30 AM ET)
Productivity & Unit Labor Cost – Q1 2026 (8:30 AM ET)
EIA Natural Gas Inventories – Weekly (10:30 AM ET)
Friday, June 5
Employment Report – May (8:30 AM ET)
Consumer Credit – April (3 PM ET)
International
Monday, June 1
China: NBS Manufacturing & Non-Manufacturing PMI – May
China: RatingDog Manufacturing PMI – May
Japan: S&P Global Manufacturing PMI Final – May
Eurozone: S&P Global Manufacturing PMI Final – May
UK: S&P Global Manufacturing PMI Final – May
Tuesday, June 2
Eurozone: Inflation Rate (Flash) – May
Wednesday, June 3
Japan: S&P Global Service PMI Final – May
China: RatingDog Service PMI – May
Eurozone: S&P Global Service PMI Final – May
UK: S&P Global Service PMI Final – May
Eurozone: Producer Price Index – April
Thursday, June 4
Eurozone: Retail Sales – April
Friday, June 5
Eurozone: GDP – Q1 2026 (Third estimate)
As we chew through all that data, we will also be mining the next round of investor conference presentations for comments about the current quarter, inflation pressures, pricing moves, AI adoption and other key topics we’re tracking. These are some of the conferences we’ll be monitoring next week:
Baird Global Consumer, Technology & Services Conference
Bank of America Global Technology Conference
Deutsche Bank dbAccess Global Consumer Conference
Evercore TMT Conference
Jefferies Global Healthcare Conference
RBC Capital Markets Global Energy, Power & Infrastructure Conference
William Blair Growth Stock Conference
Here’s a closer look at the earnings reports coming at us next week:
Monday, June 1
Open: Science Applications (SAIC)
Close: Credo Technology (CRDO), Hewlett Packard Enterprise (HPE)
Tuesday, June 2
Open: Dollar General (DG), Signet Jewelers (SIG), Victoria’s Secret (VSCO)
Close: Palo Alto Networks (PANW), Ulta Beauty (ULTA)
Wednesday, June 3
Open: Macy’s (M), Ollie’s Bargain Outlet (OLLI)
Close: Broadcom (AVGO), CrowdStrike (CRWD), Five Below (FIVE), Petco Health & Wellness (WOOF), PVH (PVH)
Thursday, June 4
Open: Brown-Forman (BF.B), Ciena (CIEN)
Close: Cooper (COO), Wealthfront (WLTH)
Portfolio Investor Resource Guide
- Economic Data: Here’s a List of Links to the Key Economic Data We Closely Watch
- Investing Terminology: 16 Key Terms Club Members Should Know
- 10-Ks: Want to Know About a Stock? Read the Company’s Reports
- 10-Qs: Unlock the Numbers and Key Information Behind Your Stock With the 10-Q
- Income Statement –Our Cheat Sheet to Understanding This Financial Document
- Balance Sheet, Cash Flow Statements, and Dividends – How to Know If a Company Is Off-Kilter? Read Its Balance Sheet
- Valuation Metrics – Everyone Wants a Value. Here’s How Investors Can Find
- Thematic Investing 101 Webinar
- Like the Benefits of ETFs? Let’s Talk About Models
The Portfolio Ratings System
1 – Buy Now (BN): Stocks that look compelling to buy right now.
2 – Stockpile (SP): Positions we would add to on pullbacks or a successful test of technical support levels.
3 – Holding Pattern (HP): Stocks we are holding as we wait for a fresh catalyst to make our next move.
4 – Sell (S): Positions we intend to exit.
ONES
American Express AXP; $316.47; 700 shares; 3.61%; Sector: Financial Services
UPDATE: Following the surge higher in April, American Express (AXP) shares gave some of those gains back in early May but rallied back late in the month to finish QTD as a nice contributor to the Portfolio. We used the May retrenchment to pick up more shares for the Portfolio on May 20 near $310, a move that rounded out our position size. As we made that move, we reiterated our $400 price target and upgraded the shares to a One rating. Our price target for American Express has been predicated upon two key factors, which include the expected increase in average fee per card over the coming quarters and the rise in the number of cards in force as the Platinum Card Refresh takes hold. Amex ended Q1 2026 with 153.9 million cards in force and picked up 3.1 million new proprietary cards during the quarter, a quicker clip than the 2.9 million added in Q4 2025. In thinking about this acceleration, Amex started its Platinum Card refresh on September 18, 2025, so it’s not surprising to see some lag in new card memberships even though the expanded array of benefits, in our view, speaks for itself and significantly offsets the annual Platinum Card cost. The evidence of the Platinum Card refresh effort can be clearly seen in the average fee per card, which reached $127 in Q1 2026, up more than 14% versus the year-ago quarter. We should continue to see that average fee per card trend higher as new Platinum Card members are added and as existing cardholders anniversary their annual membership fee. Amex management tipped that roughly one-fourth of the overall U.S. consumer Platinum Card portfolio has been billed at the new annual fee. We see that supporting the average fee per card trending higher in the coming quarters. We will continue to monitor consumer spending as well as management comments about the Platinum Card refresh and other card launches.
May Price Change: -2.0%; Yield: 1.20%
INVESTMENT THESIS: American Express is a globally integrated, membership-driven payments company, providing customers with access to products, insights, and experiences that enrich lives and build business success. The company has four reportable operating segments: U.S. Consumer Services (USCS), Commercial Services (CS), International Card Services (ICS), and Global Merchant and Network Services (GMNS). American Express targets the premium consumer space by continuing to deliver membership benefits that span our customers’ everyday spending, borrowing, travel, and lifestyle needs, expanding its roster of business partners around the globe, and developing a range of experiences that attract high-spending customers. In 2025, the company’s net card fee revenue accounted for 72% of its pre-tax income, which we see as providing a differentiated business model that should continue to grow as Amex wins new card members and drives its average fee per card higher.
Target Price: Reiterate $400; Rating: One
Checkpoint: $270
RISKS: Slowdown in consumer spending, competition, membership growth, merchant acceptance, and lack of new product innovation.
Axon Enterprise AXON; $448.72; 500 shares; 3.66%; Sector: Aerospace & Defense
UPDATE: Shares of Axon (AXON) were a modest drag on the Portfolio for most of May, but a late-month rally led them to finish the month up in the high-single digits. That pushed their QTD performance from a drag on the Portfolio in mid-May to a positive one at the end of the month. While the shares moved against us for most of May, what we saw in the company’s Q1 2026 results and future contracted bookings keeps us bullish on the company’s prospects and the shares. Future contracted bookings, a key metric that we watch for Axon, dipped to $14.3 billion exiting Q1 2026, down from $14.4 billion in the prior quarter. Looking back over the last several years, that pattern is typical and matches the quarter being the seasonally weakest. However, the company’s deferred revenue climbed to $1.05 billion, which offers nice revenue coverage for management’s upsized revenue guidance for 2026. That new guidance calls for 30% to 32% year-over-year growth compared to prior guidance of 27% to 30%. That implies 2026 revenue between $3.6 billion and $3.7 billion. Also, the higher margin Software & Services revenue, climbing 35% year over year, with AI products up 700% compared to year-ago levels. Granted, AI product sales in the year-ago quarter were rather small, but as overall AI adoption rises and usage expands, the same is happening in the public safety market and at all large domestic law enforcement agencies. While AXON shares have been knocked around with other software companies, we see Axon for what it is —a hardware and services company, not too different from Apple, even though Axon’s revenue and gross profit exposure to its Software & Services segment is larger than that at Apple. The point is that Axon is not just a software company, and that is hammered home with the fact that 46% of its gross profit dollars come from its hardware/connected device segment. This speaks to the nature of Wall Street analyst coverage and how, from time to time, companies get slotted in industry verticals that aren’t always a perfect match. That misperception, when it happens, can be helpful to those of us who understand a company’s underlying business model. Axon’s unified system marries software and sensors with a real-time connection to drive productivity. That productivity is poised to increase as AI adoption increases in public safety and law enforcement, and in many respects, it has to because of law enforcement and public safety staffing shortages. Pain points and the companies that address them make for good investments, though there will be a few bumps near-term, including ramping newer programs and supply chain constraints. To us, the more important indicators to watch for will be management’s comments about AI adoption, expanding usage of its body cameras and drone products, and future contracted booking indications when management presents at the Baird Global Consumer, Technology & Services Conference on June 2.
May Price Change: 11.7%; Yield: 0.00%
INVESTMENT THESIS: Axon Enterprise develops, manufactures, and sells conducted energy devices and cloud-based digital evidence management software designed for use by law enforcement, corrections, military forces, private security personnel, and private individuals for personal defense. The company operates in two segments: Taser (recently renamed Connected Devices) and Software & Sensors (recently renamed Software & Services). Taser develops and sells CEDs used for protecting users and virtual reality training. Software & Sensors manufactures fully integrated hardware and cloud-based software solutions such as body cameras, automated license plate reading, and digital evidence management systems. Axon delivers its products worldwide and gets most of its revenue from the United States. According to Mordor Intelligence, the wearable and body-worn cameras market on its own was valued at $1.62 billion in 2020 and is expected to reach $424.63 billion by 2026. Public safety organizations are increasingly adopting cloud solutions, leading to significant spending in this area. The digital spending in public safety is projected to reach $201 billion by 2027.
Target Price: Reiterate $700; Rating: One
Checkpoint: $330
RISKS: Manufacturing and supply chain, competitive factors, government regulation, and technology change.
Bank of America Corp. BAC; $51.60; 4,245 shares; 3.57%; Sector: Financial Services
UPDATE: In May, shares of Bank of America (BAC) gave back a few points of their April gain that tallied almost 10%. Quarter to date, the shares are up mid-single digits. While the market is focused on the loan activity amid renewed questions over the path for the Fed and interest rates, our focus remains on investment banking leverage, market volatility, BofA’s trading desk, and management’s focus on cost containment. In April, BofA upped its 2026 net interest income (NII) forecast to be up 6%-8% year over year compared to its prior guidance of 5%-7%. The growing likelihood that the Fed doesn’t deliver a rate cut this year should help overall expectations for NII expectations. The outlook for investment banking fees remains favorable given the slate of high-profile IPOs ahead, while the looser regulatory environment bodes well for further M&A activity. Leading that charge is the SpaceX IPO, which is slated to begin its IPO roadshow in early June and price the offering on June 11. Its market reception could trigger the next wave of IPOs, including ones from OpenAI, Anthropic, Canva, Inspire Brands, and Whoop. On March 27, CEO Brian Moynihan indicated that investment banking, trading, and wealth management were performing well in the current quarter. Moynihan also signaled 200-300 basis points in overall company operating leverage this year, up from “more than 200 basis points” in mid-April. Looking at the chart, we see nice support near $51.
May Price Change: -3.5%; Yield: 2.17%
INVESTMENT THESIS: Bank of America is one of the world’s leading financial institutions, serving individual consumers, small- and middle-market businesses, and large corporations with a full range of banking, investing, asset management, and other financial and risk management products and services. The company provides unmatched convenience in the United States, serving approximately 69 million consumers and small business clients with approximately 3,700 retail financial centers, approximately 15,000 ATMs, and award-winning digital banking with approximately 59 million verified digital users. Bank of America is a global leader in wealth management, corporate and investment banking, and trading across a broad range of asset classes, serving corporations, governments, institutions, and individuals around the world. Bank of America offers industry-leading support to approximately 3 million small business households through a suite of innovative, easy-to-use online products and services. The company serves clients through operations across the United States, its territories, and approximately 35 countries. From a reporting perspective, the company’s business breaks down as follows: Net Interest Income breakdown: Consumer Banking 57%, Global Banking 23%, Global Wealth & Investment Management 14%, and Global Markets 6%; Income Before Tax breakdown: Consumer Banking 42%, Global Banking 27%, Global Wealth & Investment Management 16%, and Global Markets 15%. Bank of America pays a quarterly dividend of $0.28 per share, up from $0.18 a few years ago.
Target Price: $65; Rating: One
Checkpoint: $45
RISKS: Financial markets, fiscal, monetary, and regulatory policies, economic conditions, and credit ratings.
Costco Wholesale COST; $956.32; 215 shares; 3.35%; Sector: Consumer Staples
UPDATE: Coming off a strong Q1 2026 move of more than 15%, shares of Costco (COST) trended higher in the first part of May following another report of stellar adjusted comp sales. After giving up most of those early May gains, on May 29, Costco once again delivered a solid quarterly earnings report and reaffirmed why we remain long-term bullish on the name. However, in the current environment where the market punishes a company’s shares for even a modest miss, COST tumbled further, leading them to close May in the red. Adding to the pressure, Costco management had little to say about the special dividend the market continues to expect. That cumulative May move in COST, one that erased the QTD gain, has us watching key support levels for the shares with an eye to bringing a few more into the Portfolio. To us, the key to Costco’s business is the relationship between growing the number of warehouse locations, which feeds the membership revenue stream and merchandise volumes. Provided Costco doesn’t make the location-over-saturation mistake we’ve seen from the likes of Starbucks and others, we are inclined to remain owners of the shares to capture further upside and the benefit of future special dividend payments. The next known catalyst for the shares will be its May sales report on June 3.
May Price Change: -5.7%; Yield: 0.61%
INVESTMENT THESIS: We like Costco’s long-term prospects, driven by a club-based operating model that focuses on volumes, not margins, and therefore offers its customers a value proposition of everyday low prices. The strength of this model has created an incredibly loyal customer base with low churn and continued share gains in both brick-and-mortar and e-commerce. This is a global concept, evidenced by the strength of sales both in the U.S. and abroad, which includes an emerging China opportunity. We see the company’s membership model as a key differentiator versus other retailers, and its plans to open additional warehouse locations in the coming quarters should drive retail volumes and the higher-margin membership fee income as well. We also appreciate management’s approach to capital returns and their willingness to return cash.
Target Price: Reiterate $1,150; Rating: One
Checkpoint: $900
RISKS: Inability to pass through higher costs, fuel prices, weaker consumer, and membership churn.
Meta Platforms META; $632.51; 337 shares; 3.48%; Sector: Communication Services
UPDATE: The clawback of Q1 2026 declines that began in April for Meta (META) shares continued in May. Exiting the month, META shares were still down mid-single digits despite the strong April-May showing. Much like we saw in April, Meta made numerous headlines in May, including teen safeguards, launching an AI chip research hub at UCLA with Broadcom and Applied Materials, and introducing “Forum,” a standalone app for Facebook that resembles Reddit. All nice positives, but the big news during May was the layoff of ~8,000 employees globally, hitting Meta’s engineering and product teams. Meta also reassigned some 7,000 employees to newly formed roled focused on AI, including products and agents. We will continue to focus on two key metrics when it comes to Meta’s business and our shares. First, Family Average Revenue per Person (ARPP), which climbed more than 26% year over year in Q1 2026. Second, expenses as a percentage of revenue, which should improve some in the current quarter and more so in H2 2026 following cumulative layoffs YTD. Given the supply chain tie-ups reported so far this year, we could see Meta step up its capital spending plans yet again, and that has the potential to renew margin and EPS-related questions. That could pressure the shares in the near-term, but we view Meta as extremely well positioned for the continued shift toward digital advertising while its margins benefit from internal AI initiatives and a tight rein on expenses. In late May, Meta confirmed plans to test two AI subscription offerings, Meta One and Meta One Premium, another move to monetize its AI efforts as well as challenge OpenAI, Anthropic, Google Gemini and others. We will be tracking that test, and a wider rollout could bode well for H2 2026 and 2027 consensus expectations.
May Price Change: 3.4%; Yield: 0.33%
INVESTMENT THESIS: Meta segments its business between Family of App Products, which includes Facebook, Instagram, Messenger, Threads, and WhatsApp, and Reality Labs Products, which includes its metaverse and investments and future product R&D. Family of Apps accounts for about 99% of the company’s revenue and 100% of the company’s operating profits. Substantially all of Meta’s revenue is currently generated from advertising on Facebook and Instagram. Family daily active people (DAP) were ~3.6 billion on average for the March 2026 quarter. Meta expects to spend $162 billion-$169 billion on capex in 2026, a significant increase year over year, with most of this spending focused on AI infrastructure and initiatives. Meta is positioned to benefit from the ongoing shift toward digital advertising and the adoption of AI across its entire product offering. We recognize Meta is ramping up capital spending as part of the current AI arms race, but we see that as an investment that should drive productivity in its core advertising business. As the company harvests that investment, we could see a step up in margins, much like we saw in 2023.
Target Price: $850; Rating: One
Checkpoint: $560
RISKS: Ability to add and retain users and user engagement; marketing spend; new products or changes to existing ones; competitive risk, geopolitical risk.
Nvidia Corp. NVDA; $211.14; 970 shares; 3.34%; Sector: Technology
UPDATE: Shares of Nvidia (NVDA) had a strong first half of May, rising more than 15%, but the post earnings selloff led them to close May up mid-single digits. Adding that to their mid-teens increase in April, QTD, NVDA shares are up more than 22%. Not as much as they were mid-May but still well above the S&P 500’s QTD return. Leading up to Nvidia’s April-quarter earnings, we voiced the risk of a potential selloff if Nvidia didn’t deliver a wow factor with its guidance, given the move up in the shares from $ 169-ish in late March to over $230 into the earnings report. By the numbers, revenue came in at $81.6 billion, up 85% year over year and well ahead of the market consensus near $79 billion. The newly recast segment results showed Data Center (92% of total revenue) up 92% compared to the year-ago quarter and more than 20% sequentially. The smaller Edge Computing segment, which includes the company’s gaming, automotive and embedded businesses, posted $6.4 billion in revenue, up 29% year over year. While we’re not going to dismiss the Edge Computing segment, the reality is that the Data Center business is the tail that wags Nvidia’s business and its shares. On an almost weekly basis so far this year, we’ve seen headlines about AI and data center capital spending or strategic tie-ups, underscoring rising capital spending levels not only from the hyperscalers but also from AI cloud-based firms like CoreWeave and other neo clouds. We’ve also shared multiple signals with you about rising AI adoption and expanding usage across the enterprise, with consumers and other institutions. Against that backdrop and measured against the monthly sales results from Taiwan Semiconductor and Foxconn, among others, we’re not surprised by the strong demand for Nvidia’s chips, and we see that continuing. In response, we lifted our NVDA price target to $280 from $250. Others have raised their targets as well, but we’re focusing more on where the consensus EPS figure has moved to for the company. For 2026, Nvidia is now expected to deliver EPS of $8.92, rising to $12.65 in 2027 and $15.70 in 2028. While the current P/E on 2027 EPS is not around 10x as some have said, the math shows the shares are trading at a PEG ratio of around 0.4x based on those 2027 figures. That is more than enough to maintain our One rating, but it also has us contemplating rounding out the Portfolio’s position size before too long. With AI adoption and usage rising, and the need to add more compute over the long-term, we’re inclined to remain NVDA holders.
May Price Change: 5.8%; Yield: 0.47%
INVESTMENT THESIS: Nvidia is well-positioned to benefit from ramping AI and data center spending. The company pioneered accelerated computing to help solve the most challenging computational problems. Nvidia is now a full-stack computing infrastructure company with data-center-scale offerings that are reshaping the industry. The company’s full stack includes the foundational CUDA programming model that runs on all Nvidia GPUs, as well as hundreds of domain-specific software libraries, software development kits, or SDKs, and Application Programming Interfaces, or APIs. This deep and broad software stack accelerates the performance and eases the deployment of Nvidia accelerated computing for computationally intensive workloads such as artificial intelligence, model training and inference, data analytics, scientific computing, and 3D graphics, with vertical-specific optimizations to address industries ranging from healthcare and telecom to automotive and manufacturing. Nvidia reports in two business segments: Compute & Networking and Graphics. The Compute & Networking segment (78% of revenue, 85% of operating income) is comprised of Data Center accelerated computing platforms and end-to-end networking platforms, including Quantum for InfiniBand and Spectrum for Ethernet; NVIDIA DRIVE automated-driving platform and automotive development agreements; Jetson robotics and other embedded platforms; Nvidia AI Enterprise and other software; and DGX Cloud software and services. The Graphics segment (22% of revenue, 15% of operating income) includes GeForce GPUs for gaming and PCs, the GeForce NOW game streaming service and related infrastructure; Quadro/NVIDIA RTX GPUs for enterprise workstation graphics; virtual GPU, or vGPU, software for cloud-based visual and virtual computing; automotive platforms for infotainment systems; and Omniverse Enterprise software for building and operating metaverse and 3D internet applications.
Target Price: $280; Rating One
Checkpoint: $160
RISKS: Market and interest rate risk, credit risk, country risk, and operational risk, including cybersecurity.
Palantir Technologies PLTR; $156.54; 1,565 shares; 3.99%; Sector: Financial Services
UPDATE: Shares of Palantir (PLTR) continued to trade in the same channel between $130-$150 in May that began in February of this year. That meant falling in the first half of the month, but that was more than offset by a sharp move higher in late May, leaving them up low double-digits for the fifth month of 2026. That made our May 6 pick-up of additional shares well-timed. We made that move given the post-earnings selloff that came despite the company’s beat-and-raise Q1 2026 earnings report. As we explained in our note discussing those results, two factors weighed on the stock. And yes, they are the same two we’ve contended with when the company has reported in the past – guidance that skews conservative, and the valuation of its shares. For 2026, Palantir raised its revenue guidance to $7.650 billion- $7.662 billion, which includes a boost to its U.S. commercial revenue guidance to more than $3.224 billion, representing a growth rate of at least 120%. That compares to its January guidance of $7.182 billion – $7.198 billion for total revenue this year, with U.S. commercial revenue more than $3.144 billion. But the real eyebrow raiser in Palantir’s guidance was the revised adjusted operating profit guidance of $4.44 billion-$4.452 billion, up from $4.14 billion in January, and the corresponding step-up in operating cash flow to ~$4.3 billion. In our view, the step-up in total remaining contract value to $11.8 billion from $10.8 billion exiting 2025 is a figure that deserves far more attention. Not because it was up 97% year over year, but because of the revenue visibility it brings, and that is what helps us think Palantir’s 2026 guidance skews conservative. On the valuation topic, based on current consensus EPS figures, which could inch up some or even more in the coming days, between 2025 and 2028, Palantir is expected to grow its EPS to $3.00 from $0.75. That’s a compound annual growth rate of ~59%. Given the total contract value, rising margins and expanding use of AI, looking at 2027 EPS of $2.07, PLTR shares are currently trading well below our $220 price target which equates to a PEG ratio 1.8. While some are waving their arms up and down that PLTR is not cheap, we’d argue they simply aren’t looking at the stock with the right lens. Given that analysis, we added to the Portfolio’s PLTR holdings on May 6 at $134.16, and we have a modicum of room left in the total position size to add a few more shares.
May Price Change: 12.5%; Yield: 0.00%
INVESTMENT THESIS: Palantir Technologies specializes in big data analytics and builds software platforms that help organizations integrate, analyze, and make sense of vast amounts of data for both commercial and government clients. While much has been made about the company’s exposure to the federal government, its software is used across 90 industries, and the larger global government sector accounted for 55% of revenue last year. The balance was from the commercial sector. Exiting 2025, Palantir’s U.S. Commercial remaining deal value (RDV) stood at $4.38 billion, up 145% year over year, and its Total Contract Value (TCV) stood at $10.8 billion, up 128% year over year. We will continue to monitor Palantir’s RDV and deferred revenue metrics. Key items to watch include continued diversification of its customer base across industries and increasing revenue per customer. Because we are still in the relatively early innings of AI adoption, we are inclined to be long-term owners of PLTR shares.
Target Price: $220; Rating: One
Checkpoint: $114
RISKS: Economic and IT budget spending risk, technology risk, competition and competitive pressures, and customer acquisition risk.
SuRo Capital SSSS; $13.88; 18,060 shares; 4.09%; Sector: Financial Services
UPDATE: SuRo Capital (SSS) shares continued to chug higher in May following the company’s Q1 2026 results and increasing market enthusiasm for the IPO market. From our perspective, the results were largely in line with expectations built by the company’s April 7 preliminary investment portfolio update for the quarter. During the earnings call in early May, SuRo revisited its early April announcement for plans to transition to an externally managed structure in the form of a joint venture between SuRo and Magnetar. The $18 billion in assets under management, Magnetar will provide access to greater deal flow and due diligence capabilities and will invest $20 million into the company. In response to SuRo’s Q1 2026 results, we nudged our price target to $17 from $16. To lift our price target demonstratively higher, we will need to see further step up in the company’s net asset value. Coming off the multiple capital raises associated with its portfolio holdings in Q1 2026, the odds of another massive step up in that net asset value during the current quarter is unlikely. In the second half of 2026 and 2027, there are some catalysts, including potential IPOs for OpenAI, Vast Data, Whoop and other holdings, that could deliver such a step up. Recognizing what’s down the line, we will be patient with SSSS and continue to watch both IPO filings as well as capital-raising efforts from others in the SuRo portfolio. Given that portfolio spans 36 companies, there is always the possibility for an M&A event as well. At the same time, we will continue to bend the knee to our portfolio discipline. The next catalyst to watch for the shares will be the shareholder vote for the management structure change on June 10, and we expect it to be easily passed. On July 1, SuRo will rebrand to Neostellar and remain a publicly traded business development company focused on high-growth, venture-backed private companies.
May Price Change: 3.7%; Yield: 3.60%
INVESTMENT THESIS: SuRo Capital is a business development company (BDC) that invests in high-growth, venture-backed private companies. As SuRo monetizes those portfolio investments through either IPO or M&A transactions, it must pay out most of its earnings to shareholders in the form of dividends. What’s important to factor into our thinking is that SuRo’s strategy isn’t to hold public company investments but rather to monetize them following the lock-up expiration. Sometimes this can be immediate, and sometimes it can be in stages, but when that monetization occurs, it triggers dividend payments. And because a BDC must pay out at least 90% of its taxable income through dividends to shareholders, there is the possibility of a special dividend to hit that qualifying threshold late in the year. As we think about this, it means that we should focus on total return with SSSS, which is defined as capital gains in the shares plus dividends received while owning them. What this means is even if we see SSSS shares trade sideways or move lower, depending on the size of the dividend payments in the coming quarters, the position’s total return could still be sizable for the Pro Portfolio. SuRo’s portfolio holdings at the end of Q1 2026 included OpenAI, Whoop, Plaid, TensorWave, Vast, Blink Health and others.
Target Price: $17; Rating: One
Checkpoint: $9
RISKS: Industry and economic risk, competition and competitive pressures, and acquisition risk.
TWOS
Alphabet GOOGL; $380.34; 600 shares; 3.72%; Sector: Communication Services
UPDATE: Following back-to-back declines in February and March, shares of Alphabet (GOOGL) rallied back significantly in April and the first half of May. We used that strength, which made GOOGL an outsized position for the Portfolio, to prudently lock in some massive gains on May 19. Subsequent to that move, GOOGL shares traded off, finishing May relatively flat. However, Google continues to further its AI position and grow its position with Google Cloud, while further monetizing YouTube. Meanwhile, Google maintains its global search engine market share at 90% across all device classes. We see Google as extremely well positioned with its Gemini models and rising active user base, especially as it further weaves AI into search and related businesses. At Google I/O this month, the company shared that more than 900 million people are using its Gemini assistant, up from 740 million monthly active users at the end of 2025. The company expressed its intent to put AI agents at the forefront of all its biggest services: Search, Gmail, YouTube, Docs, and the Chrome browser. Google will start deploying an agentic-powered shopping experience. As you search for products, Google will show you listings that it hosts for products for sale at various retailers. Based on the company’s position in key aspects of our increasingly digital lifestyle and its growing role in digital infrastructure, we are inclined to remain longer-term shareholders as AI adoption and usage expand further. We see further margin improvement ahead for Google Cloud as the company monetizes it is $460 billion backlog. While the Portfolio has a sizable position in the shares, we will continue to look for attractive levels for members whose position size is less than the Portfolio’s.
May Price Change: -1.2%; Yield: 0.23%
INVESTMENT THESIS: We believe that while search and digital ad dominance are what will carry the shares in the near-to mid-term, longer-term, it is the company’s artificial intelligence “moat” that will provide for new avenues of growth. Exiting October 2025, Alphabet surpassed 300 million paid subscriptions across Google One and YouTube. AI is what has made the company’s search, video, and targeted ad capabilities best-in-class and is the driving force behind the company’s success in voice (Google Home) and autonomous driving (Waymo). Furthermore, we believe it is this AI expertise that will also make the company more prevalent in other industries, including healthcare via its subsidiary Verily, as AI and machine learning continue to disrupt operations across industries. As of late 2025, Google’s Gemini app had over 650 million monthly active users. Adding to our positive view of the company’s future opportunities, we believe that Alphabet’s free cash flow generation and solid balance sheet set it apart and are what will allow the company to continue taking chances on far-out, ground-breaking, and potentially world-changing projects, as well as fund capital returns to shareholders. We will continue to monitor advertising spend as well as the competitive landscape for the company’s core Search and Advertising business. Should we see GOOGL shares pull back near the 50-day moving average, near $295, that incremental upside to our price target would give us sufficient reason to revisit our Two rating.
Target Price: Reiterate $410; Rating: Two
Checkpoint: $263
RISKS: Regulatory risk (data privacy), competition, and macroeconomic slowdown impacting consumers and therefore ad buyer activity.
Amazon AMZN; $270.64; 801 shares; 3.53%; Sector: Consumer Discretionary
UPDATE: Following the April surge in the shares of Amazon (AMZN) they added to that gain in May leaving them up more than 30% QTD. Recent signals have pointed to consumers pivoting more to digital shopping, but also increasingly to grocery, an area of focus for Amazon. As consumers feel the direct and indirect pinches of higher fuel prices, we could see that shift accelerate just as Amazon steps up its same-day and next-day delivery. Lending a helping hand is the growing advertising and AI chip businesses, with the latter winning over AI developers as Amazon has stepped up its software support as customers embrace their competitive pricing. That chip business posted nearly 40% quarter-over-quarter growth in Q1 2026 putting it on an annual revenue run rate of over $20 billion and growing triple-digit percentages year-over-year. We continue to see Amazon’s AWS business benefiting from AI adoption and expanded usage in the enterprise and in the government sector. During the last few months, AWS garnered wins with OpenAI, Anthropic, Meta, Uber, U.S. Bank, Fox, Southwest Airlines, U.S. Army, Bloomberg, Cerebras, AT&T, Nokia, Fundamental, The National Geographic Society, and PGA TOUR, among others. Amazon Leo’s commercial service is on track to launch in Q3 2026, and customers already include Delta Air Lines, JetBlue, AT&T, Vodafone, DIRECTV Latin America, Australia’s National Broadband Network, DP World Tour, and NASA. Amazon agreed to purchase Globalstar (GSTAR) for a reported $11.5 billion to further its Amazon Leo efforts. The deal, subject to regulatory approvals, is expected to close in 2027. We like the incremental subscription revenue streams it could bring to Amazon over time. That service business would help lessen the influence and seasonal swings of the digital shopping business on earnings over time. We’ll be interested to learn more about this effort, including how the margins will stack up against AWS and any incremental capex spending may be needed. Given AI adoption tailwinds and the consumer environment, we will continue to revisit our AMZN price target as needed.
May Price Change: 2.1%; Yield: 0.00%
INVESTMENT THESIS: We believe that upside will result from Amazon’s continued e-commerce dominance, AWS’s continued leadership in the public cloud space, and the ongoing growth of the company’s advertising revenue stream, which feeds off Amazon’s e-commerce business. Additionally, we think profitability will continue to improve as AWS and advertising account for a larger portion of total sales, as both these segments sport higher margins than the eCommerce operation. While we believe the increasing share of the revenue from these higher-margin businesses will be key to driving profitability longer-term, we think margins on eCommerce stand to improve as the company’s infrastructure is further built out and economies of scale further kick in. The embedded call option is that management is always looking to enter a new space and generate new revenue streams. Outside of the company’s core businesses, per recent 13F-HR filings, Amazon holds a stake of 158.36 million shares in Rivian, 225,428 shares in Marvell, as well as positions in other companies. It has also committed to a $50 billion investment in OpenAI.
Target Price: Reiterate $310; Rating: Two
Checkpoint: $200
RISKS: High valuation exposes the stock to volatile swings, e-commerce has exposure to slower consumer spending and competition, potential headwinds resulting from new e-commerce regulation in India, and management is not scared to invest aggressively for growth, which can at times cause volatile reactions as near-term concerns arise relating to the impact on margins.
Apple AAPL; $312.06; 825 shares; 4.20%; Sector: Technology
UPDATE: The upward climb in Apple (AAPL) shares accelerated in May, adding a double-digit gain to the near 7% move higher in April. That combined effort made AAPL one of the strongest performers QTD, up more than 20%. Jumpstarting the stock’s May move was the beat-and-raise quarter delivered by the company after the market close on April 30. On the earnings call, Tim Cook warned that memory costs will be “significantly higher” for the company beyond the June quarter and that Apple is looking at a range of options to offset the impact on its business. What impressed us more with Apple’s March quarter was the uptick in operating margins to more than 32%, a full point higher than in the year-ago quarter. While the initial thought may jump to the March-quarter mix favoring the high-margin Services business, which it did, Apple’s product margins jumped nicely year over year. We left our $305 price target intact but shared our plan to revisit it once we’ve digested management’s upcoming WWDC Keynote on June 8. We discussed market chatter about what Apple is expected to unveil at that event regarding its overhauled AI-enabled Siri. Our view remains that Apple will need to serve up a delightful experience that at least matches, if not surpasses, the current consumer experience. After multiple delays, anything less would not be a good look for the company. If the company can deliver, it could unleash a strong iPhone replacement cycle. Remember, Apple Intelligence only works with the iPhone 15 Pro, iPhone 16, and iPhone 17 device families. Estimates suggest that about 80% to 85% of active iPhones, roughly 1.1 billion to 1.3 billion, cannot run Apple Intelligence natively. While John Ternus will not replace Tim Cook as CEO until September 1, we’ll be interested to see the role he plays at the WWDC Keynote. Speculation is that Ternus could be more akin to Steve Jobs than Cook, and that could reinvigorate Apple’s innovation efforts vs. the financial and operations-led ones under Cook. We will continue to track monthly revenue and end market comments from TSM and Foxconn, as well as third-party smartphone shipment data. Near-term, with AAPL shares overbought with an RSI figure of more than 75, we’ll reiterate our Two rating, noting the closest level of meaningful support is near $275.
May Price Change: 15.0%; Yield: 0.33%
INVESTMENT THESIS: While we acknowledge that near-to-mid-term performance remains heavily influenced by iPhone sales, the dynamic is shifting as investors finally place greater emphasis on Services growth. We are bullish on the 5G upgrade cycle and believe longer-term upside will continue to come as Services revenue grows its share of overall sales. Services provide for a recurring revenue stream at higher margins, a factor that serves to reduce earnings volatility while allowing for a higher percentage of sales to fall to the bottom line; as a result, we believe that Services growth and the installed base are much more important than how many devices the company can sell in each 90-day period. In addition to improved profitability, we also believe the transparent nature of this revenue stream will demand an expanded price-to-earnings multiple as segment sales grow. Furthermore, we believe that Apple’s desire to push deeper into the healthcare arena will help make its devices invaluable as more life-changing features are added and the company works to democratize health records.
Target Price: Reiterate $305; Rating: Two
Checkpoint: $222
RISKS: Slowdown in consumer spending, competition, lack of new product innovation, elongated replacement cycles, and failure to execute on Services growth initiatives.
Applied Materials AMAT; $450.06; 282 shares; 2.07%; Sector: Semiconductors
UPDATE: Shares of Applied Materials (AMAT) continued to be a strong performer in the current quarter, with their May performance building on their double-digit move in April. QTD, AMAT is up more than 30%, fueled by continued chip industry tightness and rising capital spending levels to add capacity. In response to the company’s April-quarter results reported in mid-May, we lifted our price target to $510 from the $465 we established on May 6. Tight chip industry capacity is pushing demand for Applied’s semiconductor systems business and its gross margins, which are approaching 55%. A big element in that is the favorable pricing environment, which reflects industry capacity and increasingly complex equipment, thanks to demand for smaller, more powerful chips. Management now sees that business growing more than 30% in calendar 2026, up from its more than 20% forecast back in February. Backing that revision, Applied said its customers are providing rolling eight-quarter demand forecasts — the clearest and longest visibility Applied has ever had — allowing coordinated supply chain investment. Management is also tracking more than 100 global factory projects, adding more than 10 to that list in the most recent quarter alone. Demand is robust for three areas in which Applied has leading positions — leading-edge foundry logic, DRAM, and advanced packaging. Those three are expected to account for more than 80% of year-on-year growth in total wafer fab equipment spending in 2026 and 2027. Taking the 11% year-over-year revenue increase booked in the reported April quarter against management’s guidance of $8.95 billion for the current July quarter implies a 17% year-over-year increase for those two quarters. That suggests a far stronger revenue ramp in the back half of 2026 and into 2027. Should we see AMAT shares pull back near the $410 level, that would give us a reason to contemplate upgrading the shares. It would provide a level to consider adding more shares to the Portfolio. A far more compelling risk-to-reward tradeoff would be closer to $396, which happens to be the 50-day moving average.
May Price Change: 14.1%; Yield: 0.47%
INVESTMENT THESIS: The outlook for semiconductor capital equipment, an industry that delivered ~$133 billion in 2025, remains very bright. SIA sees industry deliveries rising to $145 billion this year and $156 billion in 2027, and others see a continued step function higher through 2030. Underpinning that forecast is continued spending on AI and data centers, and corresponding equipment, as well as other connected devices, including appliances as well as cars and trucks. Applied Materials holds a leading position in the global semiconductor wafer fabrication equipment (WFE) market, with a market share estimated at approximately 19% in 2025. As a broad-portfolio supplier, it dominates in deposition (44% share) and maintains a strong presence in etch, CMP, and ion implantation tools. Major customers include TSMC, Samsung, Intel, SK Hynix, and Micron, along with key partnerships involving Apple and Texas Instruments
Target Price: Reiterate $510; Rating: Two
Checkpoint: $290
RISKS: Customer capital spending levels, currency, and economic risk.
Arista Networks ANET; $159.47; 1,410 shares; 3.67%; Sector: Technology
UPDATE: Shares of Arista Networks (ANET) climbed more than 40% in April making them a strong performer for the Portfolio, but also raising market expectations for what it would deliver when it reported its Q1 2026 quarterly results. While Arista delivered a beat-and-raise earnings report for the quarter, even as it lapped very difficult year-ago comparisons, supply chain constraints for power and networking are restraining the ability to convert booked business and incoming demand into revenue. That overshadowed wins discussed on Arista’s Q1 2026 earnings call and led the shares to fall in early May. While the shares recovered some later in the month, they remained a drag on the Portfolio’s May performance. The wins management shared included Arista now having more than 100 cumulative customers to date in 800-gigabit Ethernet deployments, and 1.6 terabit at production scale is slated for next year. To that we can add that exiting Q1 2026, Arista’s total deferred revenue balance was $6.2 billion, up from $5.37 billion at the end of 2025 and up ~100% compared to Q1 2025. We’ve seen this before with Microsoft, Google’s Google Cloud, and Amazon’s AWS – short-term challenges in converting backlog into booked revenue because of supply chain and capacity constraints. But as their supply chain constraints eased, their Q1 2026 revenue accelerated with Google Cloud up 63% year over year, Microsoft Azure up 40%, and AWS up 28%. However, with AI and data center demand remaining very strong they, along with Meta, once again increased their capex levels and that likely means we are going to see periods of ramping revenue with slower ones mixed in as additional capacity comes on stream. That’s what we likely going to see for Arista and others serving the AI and data center digital infrastructure buildout. With comments from Cisco and Marvell pointing to a networking super cycle, we’ll play the long game with ANET shares and look to rebuild our position following our April 17 sale at $163.71.
May Price Change: -7.7%; Yield: 0.00%
INVESTMENT THESIS: Arista Networks engages in the development, marketing, and sale of data-driven, client-to-cloud networking solutions for AI, data center, campus, and routing environments in the Americas, Europe, the Middle East, Africa, and the Asia-Pacific. Its cloud networking solutions consist of Extensible Operating System (EOS), a publish-subscribe state-sharing networking operating system offered in combination with a set of network applications. The company offers data center, cloud, and AI networking, cognitive adjacencies, and cognitive network software and services. It also provides post-contract customer support services, such as technical support, hardware repair, and replacement parts beyond standard warranty, bug fixes, patches, and upgrade services. The company serves a range of industries comprising internet companies, cloud service providers, financial services organizations, government agencies, media and entertainment, healthcare, oil and gas, education, manufacturing, industrial, and others. Two of Arista’s largest customers in the last few years are two Portfolio holdings you’ll quickly recognize — Microsoft and Meta. Per Arista’s 10-K filings, both Meta and Microsoft each account for more than 10% of revenue. Other named customers include Amazon’s AWS, Google Cloud, Anthropic, Canva, SAP, Shopify, Apple, Oracle, Bank of America, and Accenture.
Target Price: $180; Rating: Two
Checkpoint: $110
RISKS: Economic, customer, supply chain, and competition risks.
Broadcom Inc. AVGO; $446.77; 432 shares; 3.15%; Sector: Technology
UPDATE: April was an incredible month for shares of Broadcom (AVGO) as an approximate 35% rebound followed a decline of just over 10% in Q1 2026. Continued headlines about AI and data center, as well as networking chip demand, helped the shares build on that April performance in May, leaving them up more than 40% QTD. In early May, we lifted our price target for AVGO shares to $475 from $445 following increased capex spending levels by the hyperscalers, neoclouds and others. We may have an opportunity to increase it further after Broadcom reports its quarterly results on June 3. Setting the stage for that was Amazon’s custom AI chip tie-up with Anthropic. There are also reports of similar interest for Microsoft’s custom AI chip Maia 200, but the big win for Broadcom was the million-chip one for Google with Anthropic announced in late April. Those announcements back in early March included comments from Broadcom about its six custom AI silicon partners and ramping demand through 2027. Following Marvell’s comments on May 28 about custom AI silicon demand as well as the same for networking chips, the odds of Broadcom delivering similar comments are rather high. We will be looking to see if Broadcom revises its prior guidance for AI chip revenue in excess of $100 billion in 2027.
May Price Change: 7.0%; Yield: 0.58%
INVESTMENT THESIS: We became shareholders in Broadcom to participate as the company benefits from the buildout of digital infrastructure, including AI, data center, and custom AI chips, as well as demand for its software and services segment, which includes private cloud, mainframe software, cybersecurity, and enterprise software. Broadcom reports its business in two segments – Semiconductor Solutions (58% of sales and 51% of operating income) and Infrastructure Software (42%, 49%). The Broadcom management team has developed a track record of delivering organic growth and growth by acquisition, with the latter positioning the company to better position itself to meet developing demands. More recent acquisitions include Brocade Communications, CA, Inc., Symantec Enterprise Security, and VMware.
Target Price: $475; Rating: Two
Checkpoint: $290
RISKS: Economic, governmental regulations, geopolitical developments, cyclical, and investment risk.
Eaton Corp. ETN; $400.60; 545 shares; 3.56%; Sector: Industrials
UPDATE: Coming off their more than 20% move in April, shares of Eaton Corp. (ETN) gave back some of those gains in May despite all signs pointing to rising capital spending on electrical infrastructure. Part of that decline can be attributed to Eaton’s Q1 2026 earnings report, that bested expectations for the quarter but contained in-line guidance for 2026. In our May 5 note, we explained that, on the back of pronounced moves in stocks like Eaton, companies would need to deliver a beat-and-raise guidance that soared past consensus expectations to see their shares move higher. With that in mind, the post-earnings selloff was not all that shocking. Focusing on that, however, one might miss that on a rolling 12-month basis, organic order acceleration in the company’s Electrical Americas was up 42%, while orders at the Electrical Global and Aerospace segments grew 13%. In terms of backlog, it was up 44% at Electrical Americas, 73% at Electrical Global and 28% for Aerospace. That places Eaton’s total backlog at $14.5 billion, up 42% year over year and 10% sequentially. Stepping back, according to the U.S. Energy Information Administration, the U.S. is facing a massive surge in electricity demand, requiring an estimated 80 gigawatts (GW) of additional capacity annually over the next 20 years to meet rising needs from AI data centers, manufacturing and electrification. By 2030, electricity consumption could jump 20%, requiring peak load capacity to rise significantly from current levels. On a global basis, we turn to the International Energy Agency and its findings that across the globe, electricity capacity is projected to more than triple by 2050, reaching approximately 30 terawatts. Those are two powerful tailwinds blowing on Eaton’s business and they not only keep us bullish on the company’s shares but it also led us to boost our ETN price target to $450. We have some room to add to the Portfolio’s ETN position, and we are looking for that opportunity.
May Price Change: -7.5%; Yield: 1.10%
INVESTMENT THESIS: Eaton is an intelligent power management company that makes products for data center, utilities, industrial, commercial, machine building, residential, aerospace, and mobility markets. That business is positioned to capitalize on the mega trends of electrification, energy transition, and digitalization. We see Eaton helping address the power pain point created by data center, EV charging infrastructure, and other drivers of electricity demand. Research estimates that data center power demand will grow 160% by 2030, accounting for 3% to 4% of global power, up from 1% to 2% today. Data centers will use 8% of U.S. power by 2030, compared with 3% in 2022.
Target Price: Reiterate $450; Rating: Two
Checkpoint: $325
RISKS: Raw material costs, labor costs, end market volatility, and government legislation.
First Trust Nasdaq Cybersecurity ETF CIBR; $89.04; 2,285 shares; 3.32%; Sector: Cybersecurity
UPDATE: Shares of the First Trust Nasdaq Cybersecurity ETF (CIBR) were a very strong performer for the Portfolio in May, rising more than 30%. Adding that to their April gain of more than 7% makes them a standout performer on a QTD and YTD basis. Our position remains that AI in the hands of bad actors would not only accelerate the velocity of cyberattacks but also expand their scope. We see further attack vectors driving the need for greater cybersecurity spending in the coming quarters, and each week we see confirming real-world signals supporting that view. However, those strong back-to-back moves in April and May have landed the shares in a deeply overbought condition with an RSI of more than 75. It also has them bumping up against our $85 price target. While we remain bullish on the long-term prospects for cybersecurity spending as companies, governments, and other institutions need to protect their crown jewels, we took advantage of that overbought condition to lock in some big gains on May 26 near $85. Our next move is to revisit our price target and keep an eye on the technical setup.
May Price Change: 32.0%; Yield: 0.34%
INVESTMENT THESIS: The First Trust Nasdaq Cybersecurity ETF seeks investment results that correspond generally to the price and yield (before the fund’s fees and expenses) of an equity index called the Nasdaq CTA Cybersecurity Index. The Nasdaq CTA Cybersecurity Index is designed to track the performance of companies engaged in the cybersecurity segment of the technology and industrial sectors. It includes companies primarily involved in the building, implementation, and management of security protocols applied to private and public networks, computers, and mobile devices to protect the integrity of data and network operations. To be included in the index, a security must be listed on an index-eligible global stock exchange and classified as a cybersecurity company as determined by the Consumer Technology Association. Each security must have a worldwide market capitalization of $250 million, have a minimum three-month average daily dollar trading volume of $1 million, and have a minimum free float of 20%.
Target Price: Reiterate $85; Rating: Two
Checkpoint: $71
RISKS: Cybersecurity spending, technology and product development, the timing of the product sales cycle, new products, and services in response to rapid technological changes and market developments, as well as evolving security threats.
Labcorp Holdings Inc. LH; $260.06; 790 shares; 3.35%; Sector: Healthcare
UPDATE: Labcorp (LH) shares gained some ground in May but remained a modest drag on the Portfolio, keeping their year-to-date gain in the low-single digits. On the one hand, the shares are a steady, defensive holding in the Portfolio given their low-beta profile. On the other, the company continues to grow its array of tests and other diagnostics through organic and M&A efforts as well as expand its role in outsourced hospital and medical office testing. When Labcorp delivered its Q1 2026 earnings, it delivered a beat-and-raise quarter, resetting its 2026 EPS guidance to $17.70-$18.35, up from the prior guidance of $17.55-$18.25. Revenue for the quarter continued the trend of a mix of organic growth and acquisition-led gains as Labcorp continued to make nip-and-tuck acquisitions during the quarter. Exiting the quarter, Labcorp’s backlog stood at $8.64 billion, up 5.6% year over year. In mid-May, Labcorp announced an expanded relationship with Epic, the nation’s leading electronic health record (EHR) supporting hospitals and health systems. Through the collaboration, Labcorp’s full test menu will be available through Aura, Epic’s unified platform for ordering and receiving lab results. A few days later, Labcorp launched MyLabcorp, an AI-powered mobile app that brings together lab results, AI-enabled features and clinical guideline-based content in a secure, personalized mobile experience. The app is designed to give users additional context about their health. We see both helping expand the reach of Labcorp’s growing array of diagnostic testing. Management discussed a potential Investor Day in September, an event that would dig deep on the company’s business and give us reason to revisit our current $300 target. Labcorp will pay its next quarterly dividend of $0.72 per share on June 11 to shareholders of record as of May 29. From a technical perspective, we see some resistance ahead near $236 and again between $267-$268. While Labcorp does not have any announced investor conference presentations ahead, we will look to mine those from competitors in the coming weeks for potential catalysts.
May Price Change: 1.3%; Yield: 1.11%
INVESTMENT THESIS: Labcorp is a global leader in innovative and comprehensive laboratory services that provide vital information to help doctors, hospitals, pharmaceutical companies, researchers, and patients make clear and confident decisions. By leveraging its diagnostics and drug development capabilities, the company provides insights and accelerates innovations to improve health and improve lives. The company is organized under two segments, consisting of Diagnostics Laboratories (Dx), which includes routine testing and specialty/esoteric testing, and Biopharma Laboratory Services (BLS), consisting of Early Development Research Laboratories and Central Laboratory Services. Our attraction to LH shares stems from the combination of the aging population driving diagnostic testing growth and the increasing array of diagnostic testing as well. That combination is expected to drive the healthcare testing services market to $12.6 billion by 2029, from $7.4 billion in 2024, according to Markets and Markets. To augment its position in oncology, women’s health, autoimmune diseases, and neurology, the company has been expanding through acquisitions and partnerships with health systems and regional and local labs.
Target Price: Reiterate $300; Rating: Two
Checkpoint: $228
RISKS: Macroeconomic factors, changes in healthcare reimbursement models and products, government regulations, product discontinuations, or recalls.
Marvell Technology MRVL; $205.00; 695 shares; 2.32%; Sector: Technology
UPDATE: For the second consecutive month, shares of Marvell (MRVL) were a top performer for the Portfolio. Indeed, the shares’ QTD move of more than 100% brings the YTD return to more than 135%. Rising capital spending levels by the hyperscalers, neoclouds, data center REITs are driving robust demand for AI and data center chips, including custom AI silicon ones. That along with exploding demand for networking chips, means Marvell remains very well positioned for the continued buildout as AI adoption rises and usage proliferates. On May 28, we increased our MRVL price target to $240 from $210 following the updated multi-year outlook management provided as part of its April quarter earnings report. Breaking down that new outlook, the data center business is expected to grow ~ 50% in the current fiscal year with the interconnect business now slated to grow more than 70% year over year, well above the prior guidance that called for 50% growth. Marvell’s revenue for the current quarter is projected to grow double digits sequentially, with at least 10% sequential growth in each of the following two quarters. Some back-of-napkin math puts that revenue at $11.5 billion for the current fiscal year that ends in January 2027. Looking further out, Marvell noted its data center revenue growth in fiscal 2028 is expected to pick up to ~55% year over year. The communications end market is still slated to deliver low single-digit percentage revenue growth in fiscal 2028. Putting those pieces together, total company revenue is forecasted to grow approximately 45% in fiscal 2028, which implies ~ $16.5 billion, roughly $1.5 billion higher than management’s prior guidance and the market consensus. On the topic of Marvell’s custom AI silicon business, management said it has won several new designs during the quarter, and those sockets are expected to start contributing incremental revenue following their typical development cycle of approximately two years. With that, Marvell reiterated its $10 billion custom revenue target for fiscal 2029. As we think about that, consider that Marvell’s new total revenue target for this year is $11.5 billion. We will continue to play the long game with Marvell, especially since we are still in the first third of the ball game. With that in mind, we will continue to track monthly revenue reports from Taiwan Semi and Foxconn as well as AI and data server shipments from Dell and HPE.
May Price Change: 24.1%; Yield: 0.12%
INVESTMENT THESIS: Marvell is a fabless supplier of high-performance standard and semi-custom infrastructure semiconductor solutions. These solutions power the data economy, enabling the data center, carrier infrastructure, enterprise networking, consumer, and automotive/industrial end markets. With roughly 75% to 80% of Marvell’s revenue stream tied to digital infrastructure, we see it continuing to benefit from rising content consumption and creation. Pointing to that rising demand that necessitates network densification and the build of digital infrastructure, Ericsson sees global monthly average usage per smartphone reach 46 gigabytes (GB) by the end of 2028, versus 19 GB in 2023 and 15 GB in 2022.
Target Price: Reiterate $240; Rating: Two
Checkpoint: $160
RISKS: Technology risk, customer risk, competition risk, reliance on manufacturing partners, and supply chain constraints.
Morgan Stanley MS; $208.00; 1,300 shares; 4.41%; Sector: Financial Services
UPDATE: Shares of Morgan Stanley (MS) built on their April gain of almost 16%, closing the first two months of the current quarter up roughly 25%. While the April move was tied to the company’s outsized Q1 2026 results, the May move reflects renewed market enthusiasm for the IPO market as well as continued M&A activity and market conditions that bode well for Morgan’s trading desk. When we downgraded MS shares to a Two rating on April 15 near $190 and an overbought condition, we signaled we would be closely watching the IPOs and secondary offerings, as well as M&A activity and other corporate advisory services. The expectation remains favorable given the slate of high-profile IPOs ahead, while the looser regulatory environment bodes well for further M&A activity. Leading that charge is the SpaceX IPO, which is slated to begin its IPO roadshow in early June and price the offering on June 11. While we raised some questions about that particular offering, its market reception could trigger the next wave of IPOs, including ones from OpenAI, Anthropic, Canva, and Whoop. On top of that, the growing likelihood that the Fed doesn’t deliver a rate cut this year should help overall expectations for net interest income (NII). Looking at the MS chart, we see several gaps have been created in April, and closing them also lines up with the stock’s 50-day moving average near $180. Subject to what develops in the IPO market in the coming days, MS may not pull back quite that far, but we’ll continue to monitor the shares for a favorable risk-to-reward entry point.
May Price Change: 9.1%; Yield: 1.92%
INVESTMENT THESIS: Morgan Stanley reports in three business segments: Institutional Securities (42% of trailing 12-month revenue, 38% of trailing 12-month Income Before Tax), Wealth Management (48%, 55%), and Investment Management (10%, 6%). While the IPO window has yet to reopen, the potential IPO class for 2025 continues to build with recent additions including Klarna and StubHub. That would be a boon to private equity firms and others that have been nursing IPO candidates during the dark period and a positive for Morgan Stanley’s investment banking business. Expected deregulation under the Trump administration is a potential catalyst for Morgan’s M&A business. Meanwhile, folks continuing to be behind in retirement savings bodes well for Morgan Stanley’s wealth management business in the coming quarters, while continued market volatility bodes well for its equity trading business.
Target Price: $205; Rating: Two
Checkpoint: $160
RISKS: Market and interest rate risk, credit risk, country risk, and operational risk, including cybersecurity.
Microsoft Corp. MSFT; $450.24; 430 shares; 3.16%; Sector: Technology
UPDATE: For most of May, shares of Microsoft (MSFT) added modestly to their April gains, but a late-month surge led to a close QTD of up nearly 20%. While the company has been tagged with other software companies as part of “SaaSpocalype,” we’ve discussed how the perception that Microsoft is largely a software-driven company is a dated one. Today’s business mix is more along the lines of 43% Productivity & Business Solutions, 38% Intelligent Cloud and 19% Personal Computing, which means Microsoft is far more cloud-centric. In our view, the issue Microsoft faces is monetizing its ramping AI and data-center capacity, improving margins along the way. Near-term, that ramp is expected to weigh on the company’s margins, and that will restrain free cash flow and EPS, but those are well-known issues. With AI adoption rising and use cases expanding, Microsoft’s cloud position leaves it well positioned for the long-term, and we can afford to be patient with the shares trading around 20x expected 2027 EPS. Helping us stay patient, Microsoft’s RPO increased to $627 billion exiting the March 2026 quarter, up 99% year-over-year with a weighted average duration of approximately 2.5 years. Roughly 25% of that figure will be recognized in revenue in the next 12 months, up 39% year-over-year. The remaining portion recognized beyond the next 12 months increased 138%. With one month to go in the current quarter, we will be parsing comments from Microsoft’s June 2 presentation at the Evercore Global TMT conference very carefully.
May Price Change: 10.4%; Yield: 0.81%
INVESTMENT THESIS: We believe the cloud to be a secular growth trend and that the upside to the shares will result from Microsoft’s hybrid cloud leadership as the company grabs market share in this expanding industry. While companies may look to build out multi-cloud environments, Microsoft’s Azure offering will be a prime choice thanks to its decision to provide the same “stack” used in the public cloud to companies for their on-premises data centers. Additionally, we would note that hybrid environments are currently the preference for most companies because they allow them to maintain critical data in-house while taking advantage of the agility and scalability provided by public clouds. Outside of the cloud opportunity, we maintain a positive view on the company’s growing gaming business, which we believe is becoming an increasingly prominent factor in the Microsoft growth story as gaming becomes more mainstream, management works to convert its gaming revenue from a one-time license purchase to a recurring subscription model, and as technologies like augmented/virtual reality evolve. Finally, as it relates to LinkedIn and other subscription-based services such as O365 and various Dynamics products, we continue to value them highly for their recurring revenue streams, which, we remind members, provide for greater transparency of future earnings.
Target Price: $500; Rating: Two
Checkpoint: $385
RISKS: Slowdown in IT spending, competition, and cannibalization of on-premises business by the cloud.
Netflix Inc. NFLX $86.02; 1,735 shares; 2.43%; Sector: Communication Services
UPDATE: Shares of Netflix (NFLX) were down in May, but the decline allowed us to bulk up the Portfolio’s exposure at $88.64 compared to its pre-trade average cost basis near $89.20 We made that move on May 12, noting four reasons for that decision. On May 13, Netflix shared impressive statistics and unveiled new pilots and capabilities across programmatic, agentic AI and data-driven insights. That included the company having 250 million monthly active viewers around the world. Management said that as that base has grown, over 60% of sign-ups are choosing the company’s ad-supported plan, and nearly half of its members, 44%, who see an ad on Netflix never saw it on broadcast TV or other streamers. That argues for Netflix bringing a unique audience to advertisers. That audience is expected to grow in 2027 as Netflix expands its ad plans from its initial 12-country slate to 15 new countries: Austria, Belgium, Colombia, Denmark, Indonesia, Ireland, the Netherlands, New Zealand, Norway, Peru, the Philippines, Poland, Sweden, Switzerland, and Thailand. The platform will also open new ad inventory across podcasts and vertical videos globally in 2027. During the May 13 presentation, Netflix also unveiled new tools, capabilities and partnerships that span planning, buying, and measuring outcomes of ad campaigns. While that event skewed more toward the advertising side of the business, remember the company’s subscription revenue stream will benefit from its late March price increase that adds roughly $1 to $2 per month to all plans in the U.S. That brings the Standard plan to $19.99 per month and Premium to $26.99 per month for new subscribers, and those prices will be phased in for existing subscribers across their billing cycles. This suggests that, more likely than not, once again, Netflix delivered April 2026 guidance that skews conservative, not only for the current quarter but also by reiterating its 2026 guidance that was issued before that domestic March price announcement. As we think about Netflix, the allure of its streaming service is very much in line with the time-tested view that content is king. What we mean by that is Netflix not only has to continue to deliver content that people want to consume, but to grow further, and it has to expand its content offering to win new subscribers and advertising dollars. That’s one reason why we pay close attention to the company’s content slate as well as expansion into games, live events, sporting events, podcasts and others. We also keep our ears open for what is said about Netflix’s internal quality engagement metric hit, which hit an all-time high in Q1 2026. With $6.8 billion remaining under its current share repurchase program, we would not be surprised to learn Netflix was putting that program to work at or near those levels. We will continue to look for opportunistic moments to build the Portfolio’s NFLX position as we track streaming market share data from Nielsen and other sources.
May Price Change: -8.1%; Yield: 0.00%
INVESTMENT THESIS: Netflix is one of the world’s leading entertainment services offering TV series, films, games and live programming across a wide variety of genres and languages. With over 325 million paid memberships, Netflix serves a global audience approaching one billion people. In the second half of 2025, Netflix members watched 96 billion hours on Netflix, up 2% (+1.5 billion hours) year over year vs. a 1% increase in the first half of the year. We attribute that to the company’s growing slate of proprietary content, live events, including sports, and a growing market for games. The company’s revenue is ~45% from the U.S., 31% EMEA, 12% Latin America, and 11% Asia-Pacific. We see Netflix and its growing content slate well positioned to benefit from the ongoing shift to streaming from broadcast and box office content, with margins poised to benefit from a combination of pricing actions and growing exposure to the higher margin advertising revenue.
Target Price: $115, Rating: Two
Checkpoint: $78
RISKS: Consumer spending and economic risk, content development and content licensing risks and competitive risks.
TJX Companies TJX; $154.75; 1,170 shares; 2.95%; Sector: Financial Services
UPDATE: Shares of TJX Companies (TJX) closed down modestly in May, leaving them up just below 1% YTD. That perspective masks the mid-May pullback that allowed us to scoop up more shares at $150.47 on May 18. We made that move based on renewed inflation pressures and the concern over consumer spending dollars, signaled by multiple companies in the April-May earnings season as well as the impact of tariffs. We’d remind you that because TJX sources its goods through liquidations of excess inventory, brand closeouts, overruns and order cancellations, its exposure to tariffs is smaller than other retailers. When TJX reported its quarterly results, it included comp sales of 6%, well ahead the majority of other retailers. For the current fiscal year that ends in January 2027, TJX increased its consolidated comparable sales outlook to a rise of 3% to 4%, from its prior forecast of 2%-3%. Given renewed inflation tailwinds, we suspect even that increased outlook is likely to prove conservative. Paired with an upward revision for its pretax profit margin, management also boosted its full-year EPS outlook to $5.08 to $5.15 from $4.93-$5.02. In response, we bumped our TJX price target to $185 from $180. We fully intend to monitor consumer spending and inflation data as a potential springboard to revisit that new target in the months ahead. During the April quarter, TJX repurchased 3.8 million shares for a total price of $604 million, which implies an average cost basis near $159. That makes our May TJX buy executed at $150.47 look even better. TJX stepped up its buyback intention for the current year to $2.75 billion-$3 billion, $250 million higher than the range shared back in January.
May Price Change: -1.3%; Yield: 1.24%
INVESTMENT THESIS: The TJX Companies is the leading off-price apparel and home fashions retailer in the United States and worldwide. It has over 5,200 stores and six branded e-commerce sites that offer a rapidly changing assortment of quality, fashionable, brand-name, and designer merchandise at prices generally 20% to 60% below full-price retailers’ regular prices on comparable merchandise. The company operates in four segments: Marmaxx and HomeGoods, both in the U.S.; TJX Canada, and TJX International. TJX looks to capitalize on opportunities to acquire merchandise at substantial discounts that regularly arise from the production and flow of inventory in the apparel and home fashions marketplace. These opportunities include, among others, closeouts from brands, manufacturers, and other retailers; special production direct from brands and factories; order cancellations; and manufacturer overruns. We see that positioning TJX extremely well, as consumers feel the pinch of ongoing inflation pressures and their efforts to stretch the disposable spending dollars they do have, including tapping discounted shopping locations. When TJX reported its January 2026 quarter, management shared plans to grow the company’s footprint. During the May 2026 earnings call, management signaled they are actively evaluating raising their long-term store count target beyond 7,000, pointing to adjacent markets and new ventures. Exiting the April 2026 quarter, TJX’s total store count stood at 5,262 locations.
Target Price: $185; Rating: Two
Checkpoint: $132
RISKS: Operational, strategic buying, and competitive risks, as well as consumer spending patterns.
United Rentals URI; $995.67; 200 shares; 3.25%; Sector: Industrials
UPDATE: After soaring more than 30% in April, shares of United Rentals (URI) climbed modestly in May, leaving them up more than 35% Q2 2026 QTD. The catalyst for the April move was United’s Q1 2026 results that bested Wall Street expectations and led us to sell a slug of shares at $991.92 on April 23. Since our move, URI shares have drifted lower as we wait for the next pieces of construction data, particularly those for non-residential construction. The next data point, which will be one for the start of the spring construction season, will be the April Construction Spending report on June 1. Inflation and higher interest rates are likely to weigh on commercial and housing construction. We’ll measure those findings against expectations for spending tied to structural growth areas like semiconductor plants, life sciences facilities, electric-grid upgrades, power generation, liquefied natural gas projects, pipelines and infrastructure development. When Caterpillar reported its Q1 2026 results, it cited a favorable outlook for non-residential construction backed by continued spending tied to the Infrastructure Investment and Jobs Act, critical infrastructure programs and data centers. Those tailwinds bode well for rental fleet activity as United’s business moves deeper into its seasonally strongest time of the year. Our next data point will be the April Construction Spending Report out early next week. We’d remind folks about United’s commitment to repurchase another $1.15 billion in stock between April and December.
May Price Change: 3.7%; Yield: 0.79%
INVESTMENT THESIS: United Rentals, the largest equipment rental company in the world, operates throughout the United States and Canada and has a limited presence in Europe, Australia, and New Zealand. It serves industrial and other non-construction, commercial (or private non-residential) construction, and residential construction. Industrial and other non-construction rentals represented approximately 50% of rental revenue, primarily reflecting rentals to manufacturers, energy companies, chemical companies, paper mills, railroads, shipbuilders, utilities, retailers and infrastructure entities; commercial construction rentals represented approximately 46% of rental revenue, primarily reflecting rentals related to the construction and remodeling of facilities for office space, lodging, healthcare, entertainment and other commercial purposes; and residential rentals around 4% of revenue. We see the company benefiting on three fronts — the seasonal uptick in construction spending, the release of funds and projects associated with the five-year Biden administration infrastructure bill, data center construction and other re-shoring projects, and the company’s nip-and-tuck acquisition strategy that should further enhance its geographic footprint. From a technical perspective, the next layer of meaningful support clocks in near $870, and should we see the shares fall to that level, it would prompt some reconsideration of our Two rating.
Target Price: Reiterate $1,000; Rating: Two
Checkpoint: $775
RISKS: Industry and economic risk, competition and competitive pressures, and acquisition risk.
Welltower Inc. WELL; $205.33; 640 shares; 2.15%; Sector: Real Estate
UPDATE: Shares of Welltower (WELL) slumped late in May, leaving their YTD gain up at a low-teens percentage, but still ahead of the S&P 500 YTD performance. We’ve continued to receive data points and signals that point to the growing senior housing shortage as the Silver Tsunami grows. We view Welltower as well-positioned for the intersection of that demographic shift and the shortage of senior living capacity that is expected to persist for the next several years. That combination bodes well for favorable pricing action, which we saw in Q1 2026 with the Senior Housing portfolio comp revenue up 9.5% year over year. That strength led Welltower to increase its 2026 guidance for net income (NI) attributable to common stockholders of $3.24 to $3.38 per share and normalized Funds from Operations (FFO) of $6.21 to $6.35 per diluted share, up from its early February NI guidance of $3.11-$3.27 per share and FFO of $6.09-$6.25. What we like even more is the move by Welltower to focus its business on senior housing by exiting its outpatient medical assets. Welltower has made considerable strides on that front and is tracking to have that disposition wrapped up by mid-2026. In Q1 2026, the senior housing operating portfolio comprised 74% of Welltower’s net operating income (NOI), up from 57% in the year-ago quarter. This suggests we should see a quicker pace of overall SSNOI growth as senior housing becomes an ever-larger part of the pie in the coming quarters. During recent pullbacks in the shares, they have found support at the 100-day moving average. We have room to add to the Portfolio’s position and will look to make a move when the time is right. We continue to see the company as a well-positioned play on the Silver Tsunami and senior housing shortage
May Price Change: -5.5%; Yield: 1.47%
INVESTMENT THESIS: Welltower, a real estate investment trust (REIT), owns interests in properties concentrated in major, high-growth markets in the United States, Canada, and the United Kingdom, consisting of senior housing, post-acute communities, and outpatient medical properties. We see the company benefiting from the intersection of the demographic shift that is the aging population and the looming pain point that is the shortage of inventory for senior housing, which fell below 1% in Q2 2025, according to the National Investment Center for Seniors Housing & Care. Over the next five years, more than 4 million boomers will hit age 80, and that’s in addition to the roughly 4% of the U.S. population that is 80-plus years old in 2024. As this demographic shift unfolds, we should see a relatively steady growth rate in Welltower’s revenue, NOI, and FFO, which, in turn, given its REIT status, should drive its payable dividend stream higher. Because of the favorable demographic tailwind and lower interest rate path telegraphed by the Federal Reserve, which should reduce construction costs over time, as well as bring REIT stocks back into favor, we intend to be long-term holders of WELL shares. Our plan is to build the position size methodically, increasing the Portfolio’s dividend stream along the way.
Target Price: $230; Rating: Two
Checkpoint: $175
RISKS: Operational risk, operator and tenant risk, competitive risks, and acquisition risk.
Waste Management WM; $211.46; 795 shares; 2.74%; Sector: Industrials
UPDATE: Shares of Waste Management (WM) ground their way higher during the first four months of 2026 but gave all those gains back in May. For us, the core story of inelastic pricing power and leveraging the combination of automation and cost containment at the core WM business remains in place. Earlier this year, management targeted an increase between 5.4%-5.8% for the waste business. An average price increase of 3% is also targeted for the Healthcare Solutions business. That suggests we should continue to see robust operating cash flow and free cash flow. During a management presentation at the Oppenheimer Annual Industrial Growth Conference in early May, Waste reiterated its emphasis on pricing and revenue per unit. While we have focused on truck automation, during the presentation, management shared how it is leveraging AI and technology to drive productivity in other areas of the business, such as call center interactions and route optimization. We see these efforts as Waste management continuing to wring cost out of the core waste collection business and doing the same with the growing Healthcare Solutions business. Cross-selling between those two businesses is driving overall volumes and revenue higher. Given the uptick in gas and diesel prices, we’ll be looking to see if WM has utilized fuel surcharge pricing to offset margin pressure. Early this year, WM announced it would restart its share-repurchase program to the tune of $2 billion in 2026. During Q1 2026, repurchased 1.5 million shares for an aggregate $354 million, which implies an average price near $235.78 per share. With WM shares well below that level, and seasonal volume strength underway, odds are the company is putting that program to work. With WM shares falling through key support levels, we are plotting our next move for the shares.
May Price Change: -9.1%; Yield: 1.79%
INVESTMENT THESIS: Waste Management’s core business is the inelastic waste removal business for residential, enterprise, and other customers. The company has built its footprint through a series of acquisitions and excelled at wringing costs out of them, driving free cash flow, dividends, and funding incremental acquisition activity. While the residential business is sticky, the commercial business should continue to benefit from non-residential construction activity. Margins should continue to inch higher due to disciplined pricing and increasing use of automation. We are in the early days of WM Healthcare Solutions, but we see the business growing as management integrates and cross-sells against its core business and flexes the ability to integrate nip-and-tuck acquisitions as it has at the core waste business. Here, too, we see room to consolidate a fragmented industry, which makes this a natural fit for Waste Management.
Target Price: $255; Rating: Two
Checkpoint: $190
RISKS: Industry and economic risk, competition and competitive pressures, and acquisition risk.
Not Rated
EPS All-Stars Model; 4.75%; Sector: N/M
UPDATE: Since our April 1 reconstitution, the rechristened EPS All-Stars basket continued to be a very strong performer for the Portfolio. Following the Q1 2026 basket returning more than 5% compared to a 5.1% drop in the S&P 500, on April 1, we reconstituted the basket and increased the Portfolio’s starting exposure to 4% of its assets. The latest basket includes initial 0.5% position sizes in shares of Bloom Energy (BE) , Ciena (CIEN), Credo Technology (CRDO), Eldorado Gold (EGO), Hudbay Minerals (HBM), Lumentum (LITE), Micron Technology (MU) , and Rocket Companies (RKT). Exiting April, the basket’s quarter-to-date return was just over 36%, and that extended further in May, ending the month up more than 65% QTD compared to an analogous gain of just over 16% for the S&P 500. May’s escalated return can be traced to outsized moves in Bloom Energy, Credo Technology, and Micron. Given the nature of the model, the only time we may adjust its composition during the quarter is if a company is acquired. Otherwise, the model is set until the next reconstitution. As such, there are no price targets or ratings for each of the positions that make up the basket. That same selection process will be repeated quarterly, which means housekeeping for the model should be minimal. It also means you can expect minimal activity to occur at quarter-end and the start of the new quarter. The next reconstitution cycle for the EPS All-Stars model will be June 30 and July 1. At that time, we may consider increasing the Portfolio’s further exposure to the basket.
May Price Change: 34.7%
INVESTMENT THESIS: EPS All-Stars is a basket of large-cap companies that offer the fastest rate of EPS growth over a multi-year period. That basket is screened regardless of industry sector or sub-sector, which means the down-selected list of companies can span a wide array of sectors. The focus is on earnings growth because earnings growth is often seen as a signal of a company’s competitive strength, operational efficiencies, and future growth potential. Shares of companies that provide historically consistent earnings growth faster than the stock market receive premium valuations compared to those awarded to the S&P 500. And as we’ve often discussed with you, multiple expansion paired with earnings growth tends to drive outperformance relative to the market, better known as alpha. The basket of eight stocks is reconstituted on a quarterly basis to reflect updated EPS expectations for the current year and the following one.
Target Price: N/M
Checkpoint: N/M
RISKS: Macro and end market risk, individual company risk, and consensus EPS expectations.
Market-Hedging Positions; 1.97%; Sector: N/M
UPDATE: On April 2, we added shares of the ProShares Short S&P 500 ETF (SH), ProShares Short QQQ ETF (PSQ) and ProShares Short Russell2000 ETF (RWM) to the Portfolio given the escalating conflict between the U.S. and Iran, the corresponding impact on energy and petroleum-related prices, and 2026 consensus EPS figures for the S&P 500 that continued to rise in the face of those two items and others. While these market-hedging, inverse ETFs moved against us in May, inflation pressures continued to climb during the month, while duration and follow-through risks associated with the war continued. Against that backdrop, with the S&P 500 near record highs, mounting concerns for consensus EPS expectations for that index, and both the S&P 500 and Nasdaq Composite well in overbought territory, we are inclined to hold these market-hedging positions near-term. These are tactical positions and should not be viewed as long-term ones. We will continue to evaluate the place in the Portfolio for SH, PSQ, and RWM from a fundamental and technical basis and revisit their roles and percentages based on developments.
May Price Change:
ProShares Short S&P500 ETF: -4.6%
ProShares Short QQQ ETF: -9.3%
ProShares Short Russell2000 ETF: -4.0%
INVESTMENT THESIS: The ProShares Short S&P500 (SH) is an ETF designed to provide investment results that correspond to the inverse performance of the S&P 500 Index. The ProShares QQQ (PSQ) is an ETF designed to provide investment results that correspond to the inverse performance of the Nasdaq 100 (NDX). The ProShares Short Russell2000 (RWM) is an ETF designed to provide investment results that correspond to the inverse performance of the Russell 2000. Each of these ETFs is used to hedge the Pro Portfolio.
Target Price: N/M
Checkpoint: N/M
RISKS: Macro and end market risk, individual company risk, and consensus EPS expectations.