Chart of the Day: Netflix Is Stuck While the Market Rallies
The stock remains trapped under some significant resistance as it continues to move sideways.
You've reached your free article limit
You've read 0 of 1 free Pro articles.
When the entire market is making new highs on a regular basis and your stock is lifeless, it can get a bit frustrating. After all, the market surges should help even the worst-looking charts, as a rising tide tends to lift all boats.
For Netflix (NFLX), however, the issues are simple — lack of volume, lack of interest and not enough AI to spread around. Of course, the company is not directly related to the AI buildout so any thought of that happening should be dismissed. Also, the streaming company made an attempt to buy Warner Bros/Discovery but in the end backed away, which was probably a smart move from a shareholder standpoint.
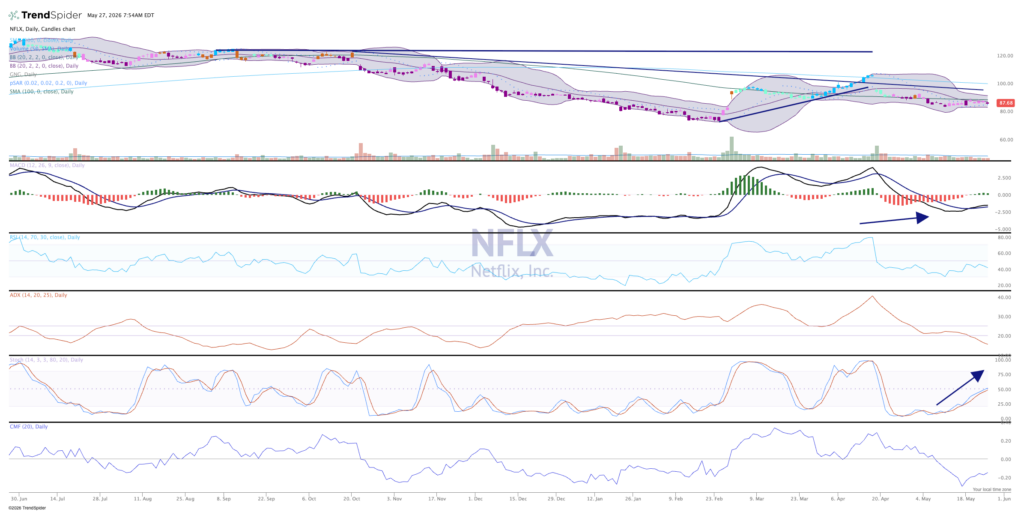
As for the Netflix chart, it is a mixed picture, requiring a bit more time of base-building — but probably not too much more. The stock seems stuck between $82-90, a frustrating 10% range that stymies the bulls every time it seems ready to break out — and then fail.
Money flow is weak but momentum is starting to rise, like the MACD and stochastics. This could be a sign of better price action to come. Bollinger bands are tight, which simply means volatility is not expected in Netflix.
As of now, this is simply going sideways, and the longer it goes the better chance of a more sustained move up. Next earnings are in mid-July, so we’ll likely come back to this name then and see what has changed.
We like Netflix in TheStreetPro Portfolio and rate it a Two, or “stockpile on pullbacks.”
More Pro Portfolio:
- We’re Adding to and Lifting Our Rating on This Holding
- We’re Tracking 29 Signals Across 9 Portfolio’s Investment Themes
- Weekly Roundup: Profiting From the Rally, But Not Letting Our Guard Down
At the time of publication, TheStreetPro Portfolio was long NFLX.
