Back to Work With a Key Market Level You Should Be Watching
It’s a choppy market that can slice, dice, and chop your portfolio. Here’s what I’m paying attention to.
You've reached your free article limit
You've read 0 of 1 free Pro articles.

The Market
I joked on social media the other day that this feels like the Ginsu Knife market. It slices, it dices, it chops you up. But wait, there’s more!
The more is, of course, all eyes are now on the Korean market, having seen it break down during its Monday session. That in turn has our eyes on the semis (as if we ever took them off them).
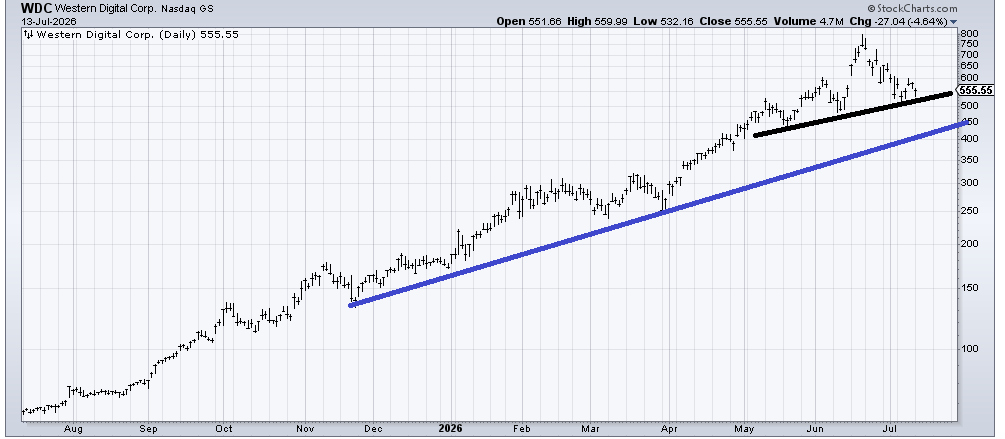
I have not changed my view on them. I don’t like them up here. But as of now, we have still not seen a break of the mid-May low. Just over a week ago, I said I thought they were oversold and should bounce and come back down. It was my view that a stock such as Western Digital (WDC) should break that early June low. Despite all the hoopla, a break has yet to occur. And today it bounced off the (black) line. I have a lot of semiconductor stocks that have done the same.
If the Korean market continues to break down and our semis do not follow suit, I would have to acknowledge that I am wrong to think a test of that blue line is in store.
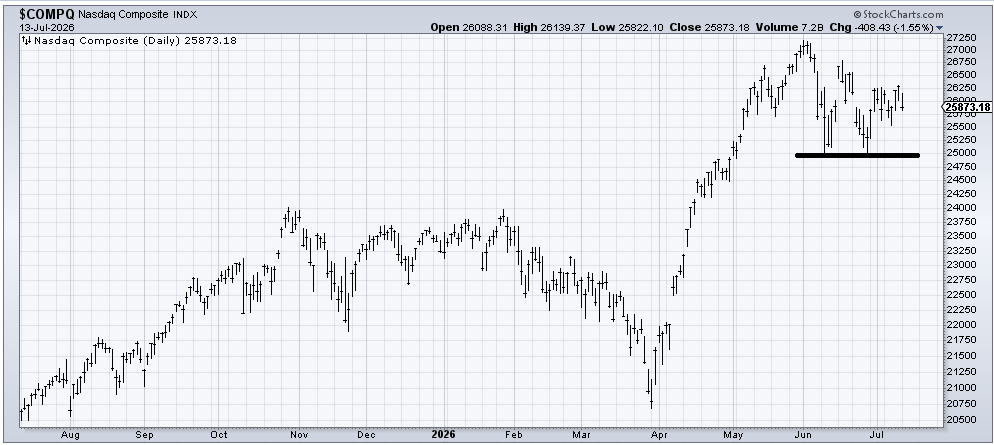
The number of stocks making new lows on Nasdaq is back over 200, but Nasdaq itself (the Composite, not NDX) has now bounced off this 25800 area twice in the last few weeks—on a closing basis. Today’s close was 25873, so this is the third trip down here. I am going to watch that level as well as 25000 because that is the twin intraday lows
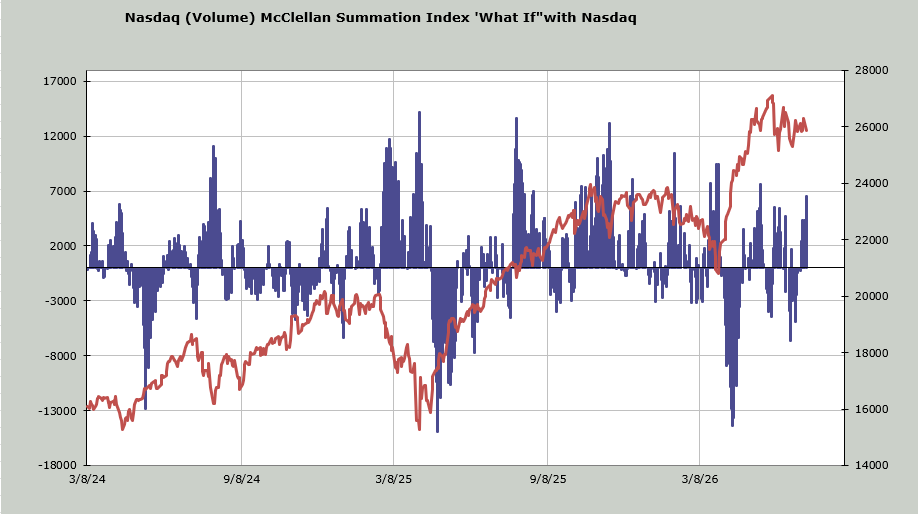
Why am I so focused on these levels, rather than the indicators? Because Nasdaq’s McClellan Summation Index, where I use volume instead of the A/D line, is heading down (bearish). Yet it now needs nearly +7 billion shares (that’s up minus down volume) to turn this indicator from down to up.
If Nasdaq falls back to 25000, my guess is this ‘what if’ shoots up over +10k billion shares, which you can see will make Nasdaq short-term oversold.
The bottom line is the market is still sloppy as can be, chopping us up since May. Basically, we had a terrific six-week rally off the late March low and have done nothing since. So I want the indicators to get to one side—either all overbought together or all oversold together—something to give us a feel for the direction(less) market.
That’s why we’ll probably rally tomorrow, just to continue the frustration!
New Ideas
I am going to do some follow-ups tonight.
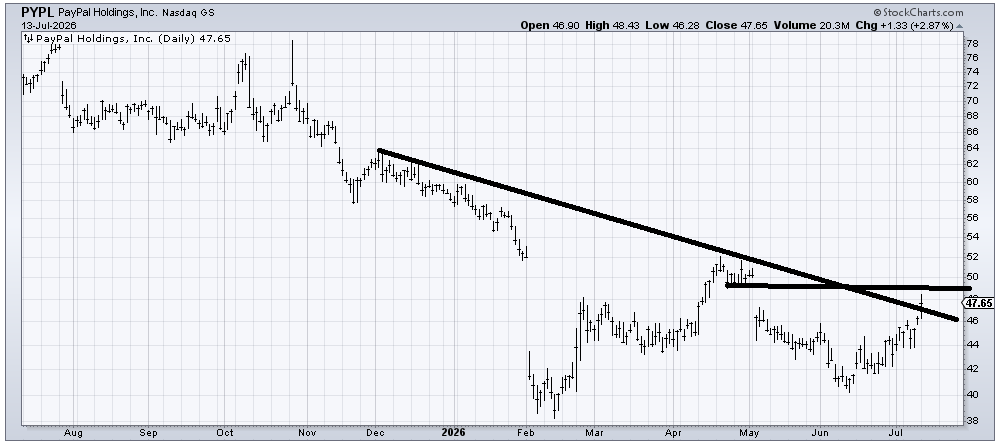
Just prior to my departure on vacation, I suggested PayPal (PYPL) could rally to resistance and fill that gap in the 49-50 area. It has come quite close to doing so. I would take something off the table, especially if it gets up there, but I would definitely use a stop under 46 now.
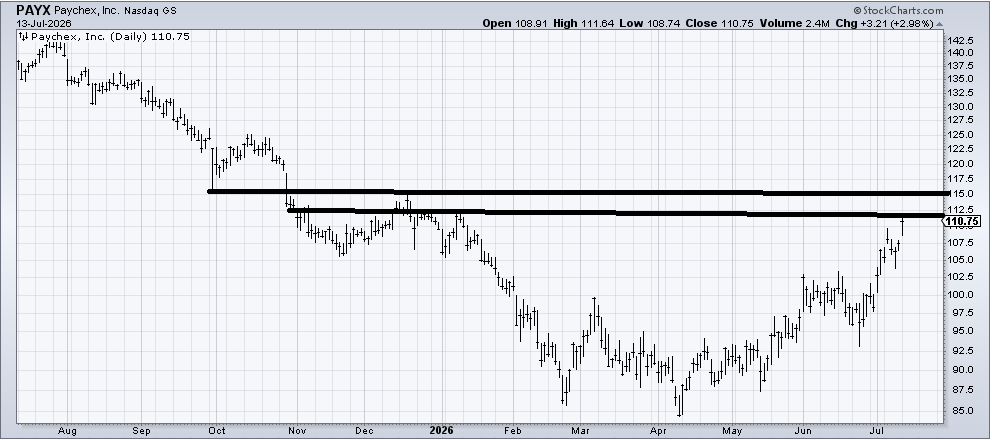
I recommended Paychex (PAYX) back in May, and while the chart continues to improve, there is a measured target and some resistance in this 110-115 area, so I would take a little something off and hold the rest with a stop.
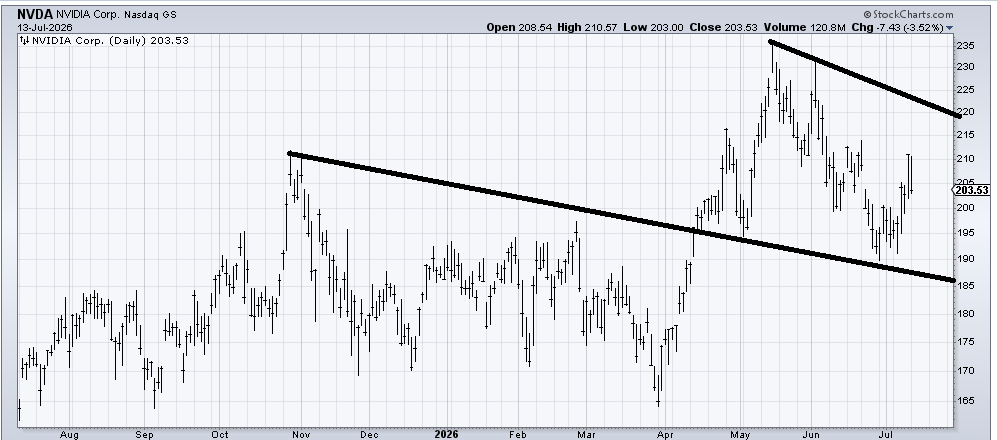
Finally, this is the periodic reminder that NVIDIA (NVDA) has a strong tendency to go sideways for months on end, enjoy a rally, and then once again go into a slumber. Right now, I’d call the slumber range 185/190 to 220-ish.
Today’s Indicator
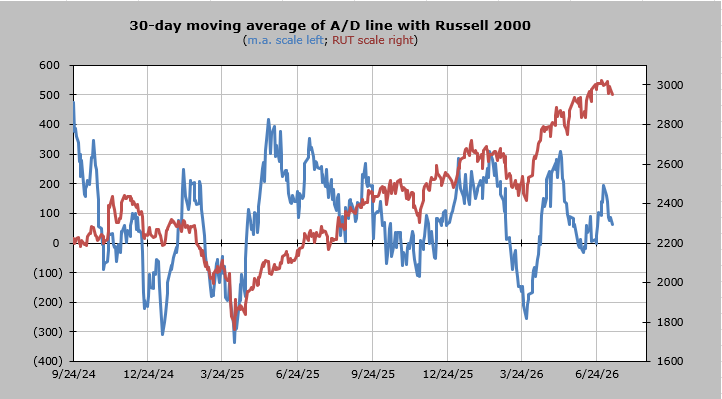
The 30-day moving average of the advance/decline line is heading back toward the zero line. If it goes up this week, the math says that another week or so, and it will head right back down. Slicing and dicing.
Q&A/Reader’s Feedback
Helene welcomes your questions about Top Stocks and her charting strategy and techniques. Please send an email directly to Helene with your questions. However, please remember that TheStreet.com Top Stocks is not intended to provide personalized investment advice. Email Helene here.
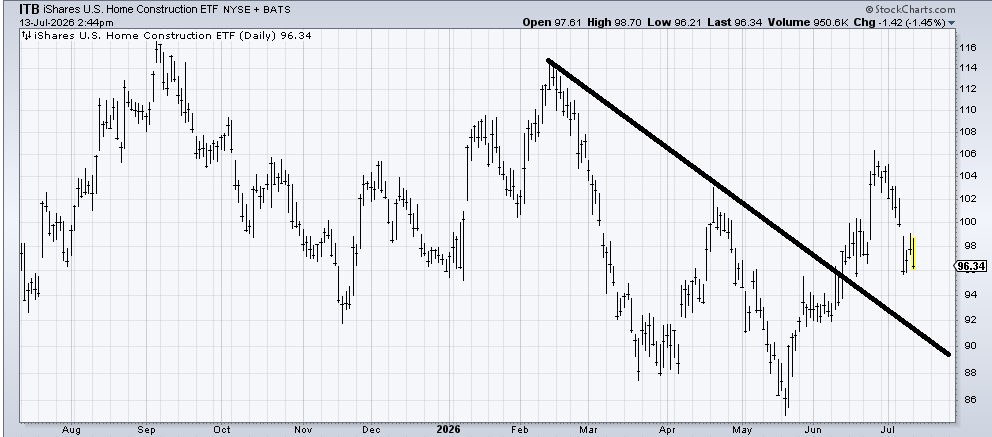
It’s impressive that ITB, an ETF to be long the Homies, hasn’t totally collapsed considering the move in interest rates, but that’s the best I can say about it right now. My guess is this 95-96 area tries to hold, but it’s temporary. If it makes it back to tag that downtrend line in the next few weeks (90-ish) I might be inclined to take another look at it. Mostly, it’s gone nowhere in a year.
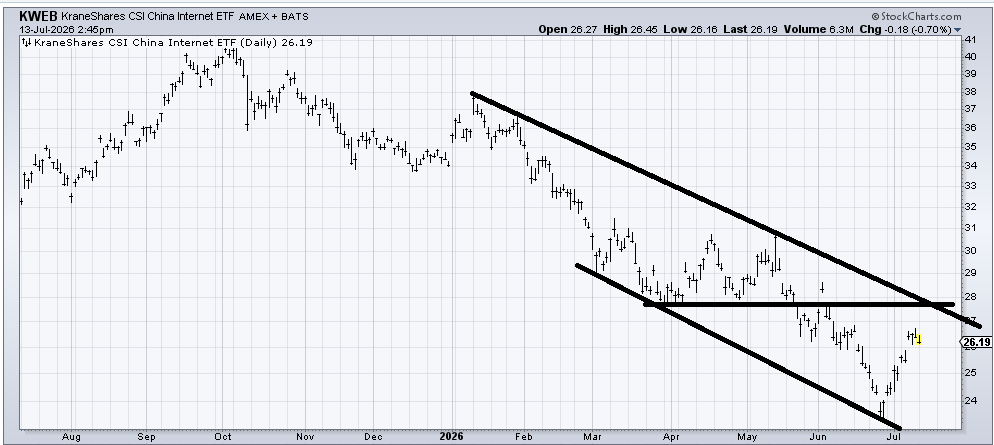
KWEB (KWEB), an ETF to be long Chinese internet stocks, had a nice pop while I was gone. But there is no base to speak of, and there is heavy resistance in that 27-28 area. My guess is for the time being, it continues to trade within the downward channel.
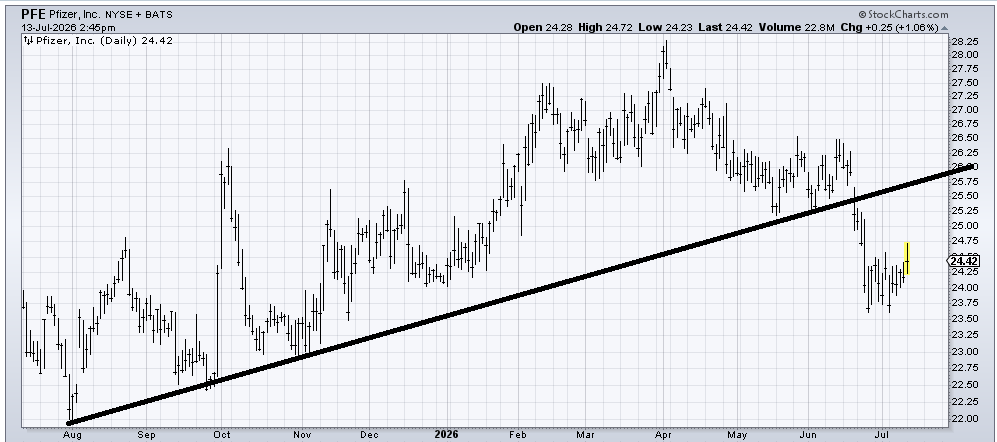
Is Pfizer (PFE) the only drug stock that hasn’t rallied? It ought to rally back to resistance (the underside of that line).
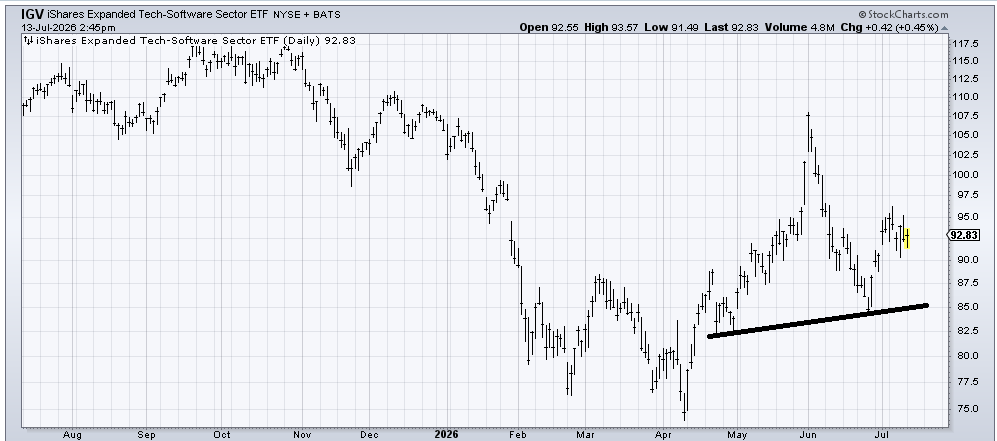
I have stated that I thought on that recent pullback, IGV was heading into ‘aversion’ off that Sentiment Cycle chart. It had a nice pop and should enjoy more upside, but I would not fall in love just yet. There is still a lot of work to do. I would consider myself wrong if it cracks back under 85-ish.
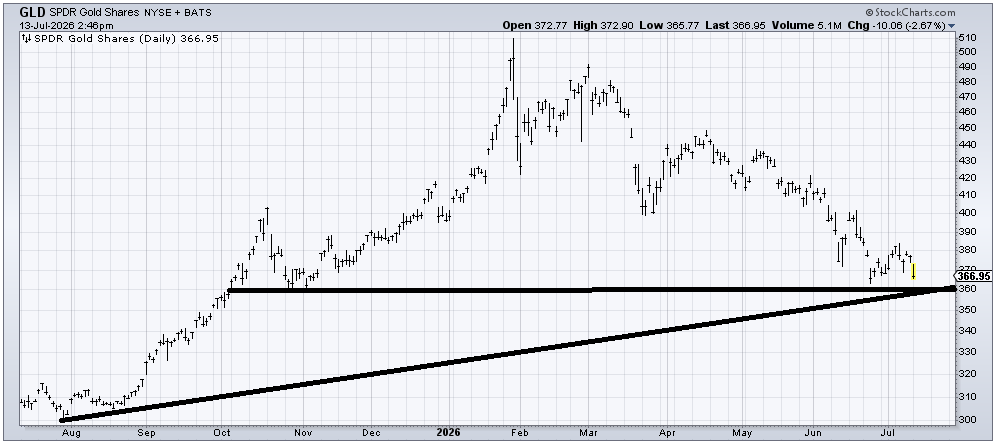
Before I left, the DSI for Gold (GLD) had reached 10, and my support level on GLD was 360. I still think in that 360 area gold gets a bounce.
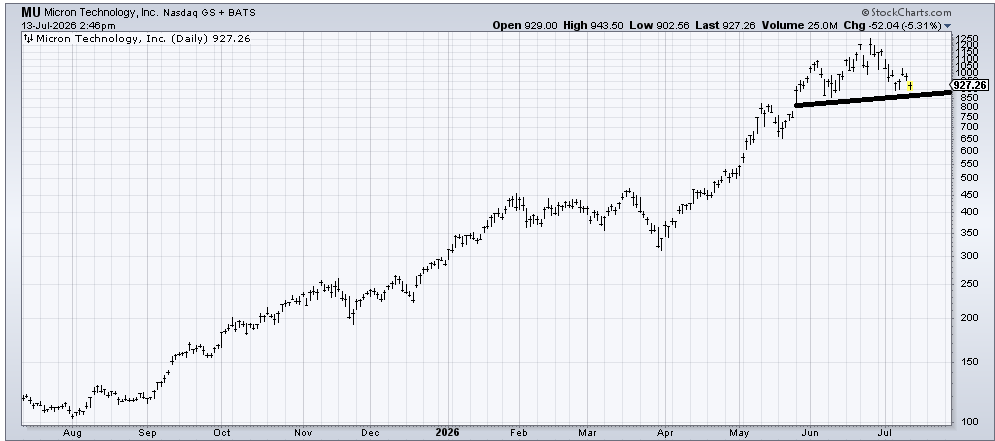
I do not like the chart of Micron (MU) and have not for quite some time. But it has yet to break not only its early June low but also its mid-May low. If it breaks 850, I would consider that a warning. If it holds 850, then it probably has a long sideways time (see February through March) before it gets interesting to me.
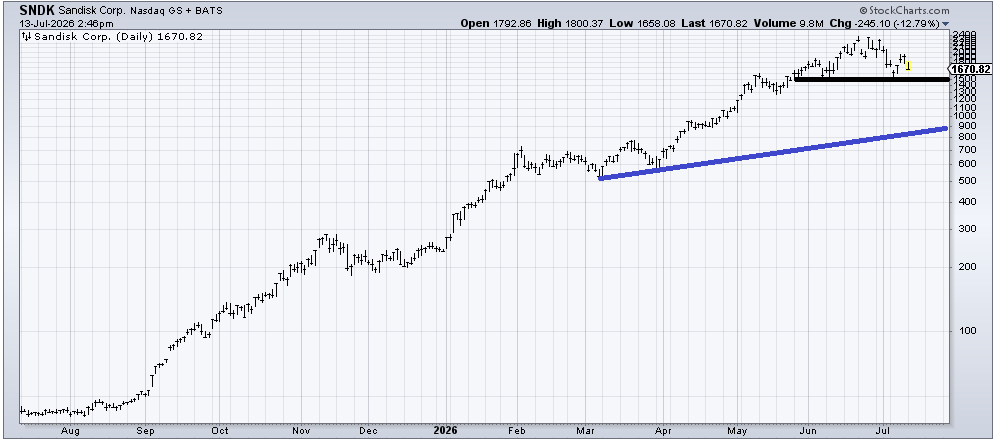
Sandisk (SNDK) has a similar situation as Micron in that it has yet to take out the early June low or the mid-May low. I would love to see it break 1500 just so we can see if the buyers step in. There is support in the 1300-1500 area, but I am not a fan of the chart right now. The most bullish aspect is that I’d bet even my mother can see the head and shoulders top.
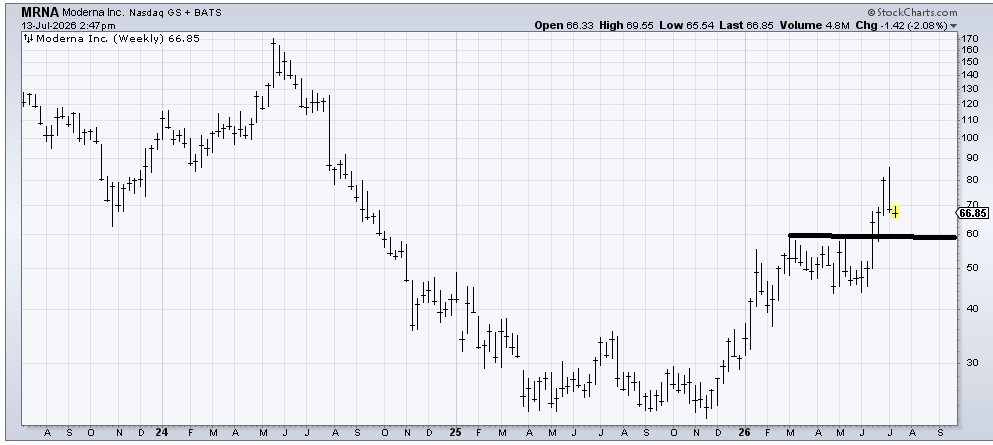
Once again, we’ll use the three-year weekly chart of Moderna (MRNA). On a longer-term basis, I would not want to see it trade under 60. But let me report that when it went over 80 last week, it met its measured target, so I lean toward profit taking in the name now. It’s had a great run, quadrupling since the low in November.
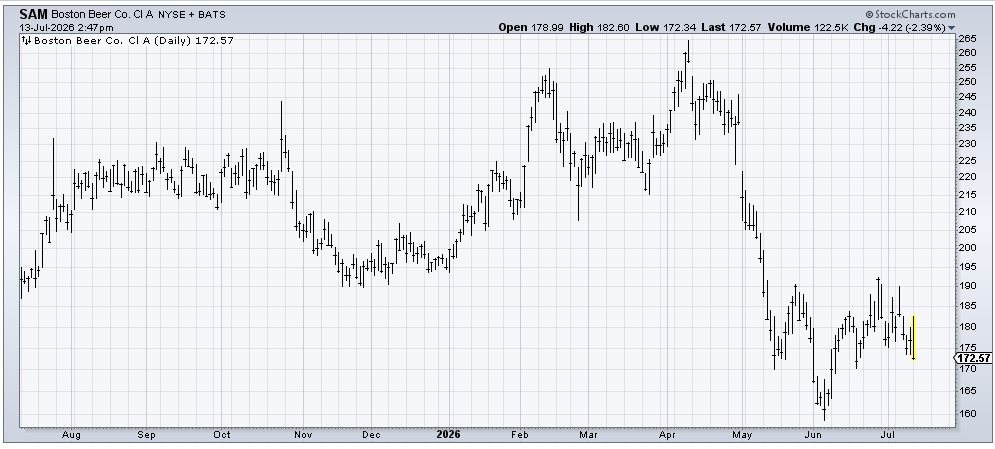
If a bunch of Scots drinking Boston out of beer cannot get Boston Beer (SAM) going, then what can? I am tempted to think maybe this is a head and shoulders bottom, but under 170, and that is just wrong. I don’t trust it to hold, but that’s the level.
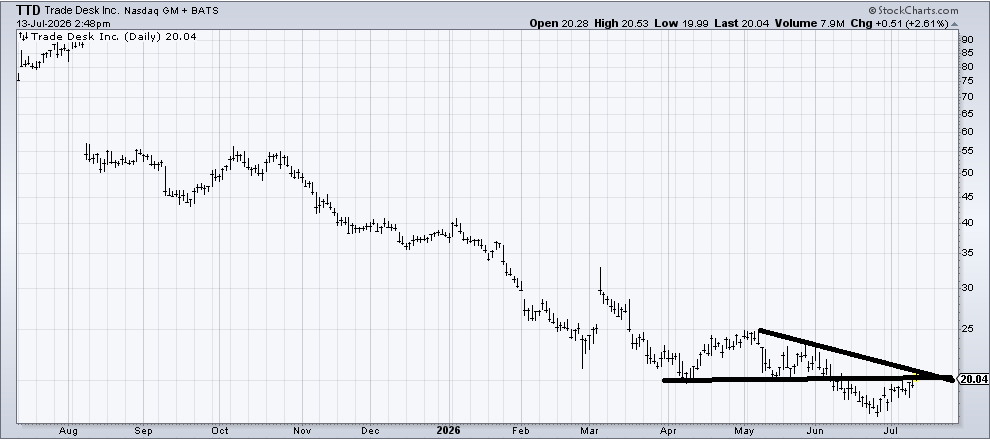
Those resistance lines are the problem with Trade Desk (TTD). If it can chew through those lines, then I might finally see some glimmer of hope here, but otherwise, we’ve seen this pattern before: rounding under, rallying, attempting to get through resistance, and then, plop. It did that in October, It did it in January, and even tried in early May. So you can see why I would prefer to let it prove itself to me.
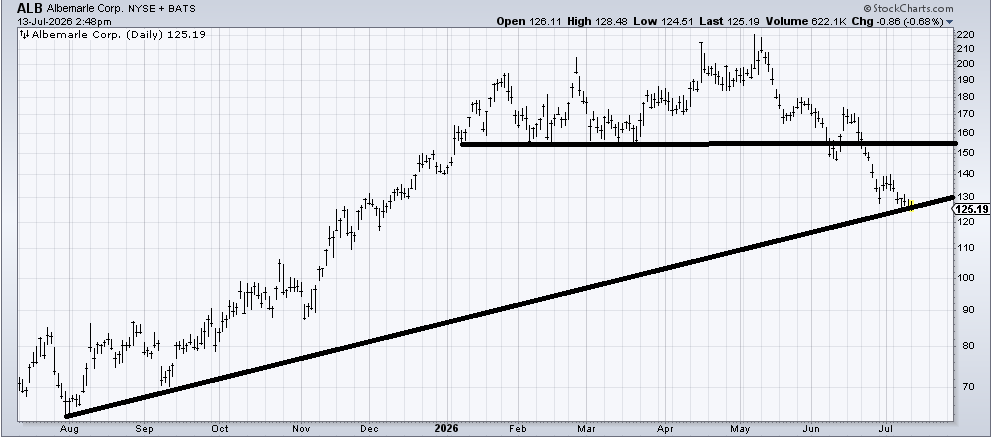
Albermarle (ALB) is oversold enough in this mid-120 area to rally, but that’s the best I see for it: a short-term rally.
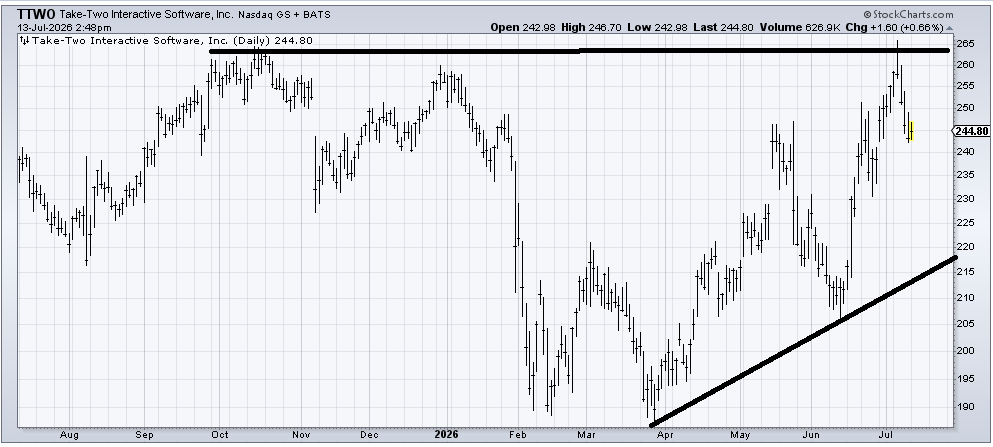
Take-Two Interactive (TTWO) had a nice run into resistance, and that looks like that’s about it for now. I don’t even have a level I would feel confident about. I suspect it rallied again, but that resistance is too difficult to overcome for now.
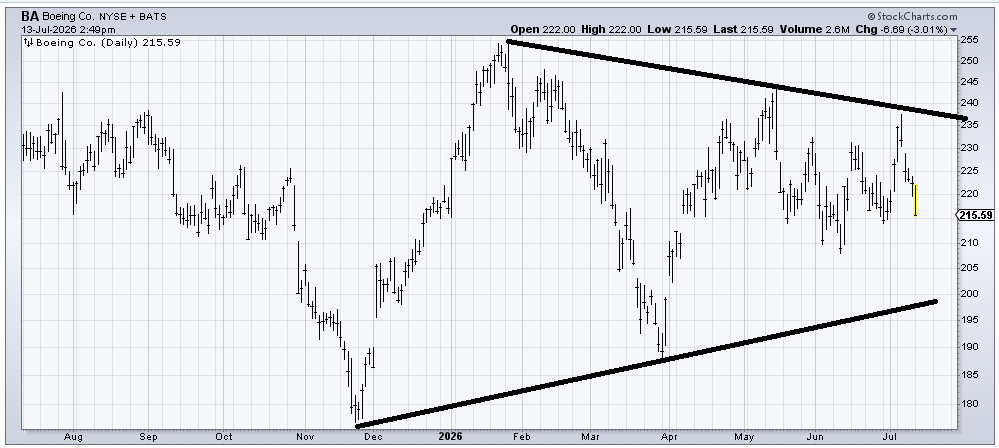
I am not a fan of the Boeing (BA) chart. I’m not even sure what it would take to get me interested. A plunge to the lower line might do it since each time it has plunged down to it, it has bounced well.
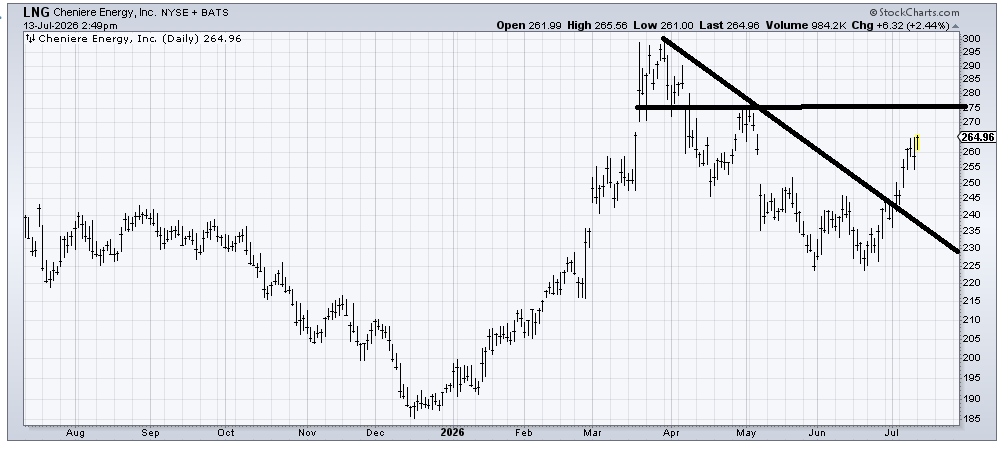
I would guess Chenier Energy (LNG) makes its way toward that resistance in the 275 area.