Monthly Roundup: August Brought the Portfolio Several Opportunities
We’re entering September as we closed out August — cautiously.
You've reached your free article limit
You've read 0 of 1 free Pro articles.
We’ve closed the books on another month this year, eight down and four more to go, but it’s fair to say that August was a bit of a wild ride in the market. But looking at just the month’s result, with the S&P 500 notching another gain and the Nasdaq Composite essentially flat compared with July, would miss the market’s sharp move lower early in August and the quick recovery.
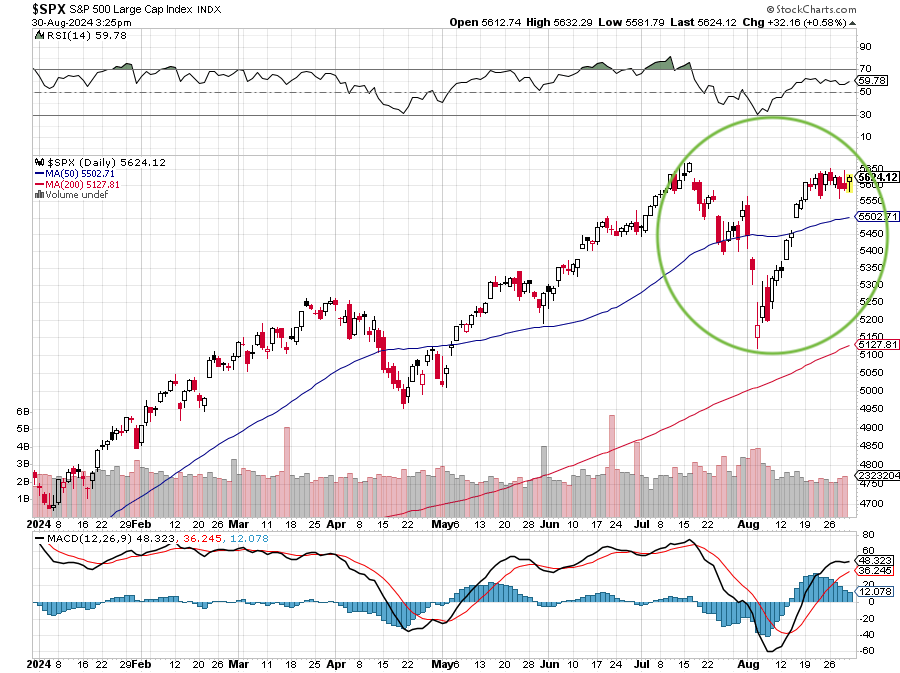
As we enter September, one known to be a challenge for the markets, the S&P 500’s valuation is once again bumping up against peak levels. To see meaningful upside from current levels, at least in the market, we're going to need to see improving EPS expectations for the back half of 2024 and 2025. We’ll be looking for signs of that during the September investor conference season. This also means we will continue to focus on companies with superior earnings prospects relative to the S&P 500.
As we discuss below in Catching Up on the Portfolio, we were able to opportunistically use that oversold condition in early August to pick up some new holdings. We were also able to lock in gains in other high flyers as the market recovered and, in the case of the S&P 500, moved higher. There were several catalysts behind the market’s recovery, including the back half of the June-quarter earnings season, favorable economic data, and confirmation the AI narrative is tracking. But one of the biggest ones was when Fed Chair Powell commented that an “adjustment” in monetary policy was called for.
That comment has the market keyed in on the Fed beginning a rate-cutting cycle in the coming weeks, but two questions remain. First, will the Fed begin with a 25 or 50-basis point rate cut? The second is whether it agrees with the market expectation captured in the CME FedWatch Tool that we could see 100 basis points in cuts this year. That infers at least one 50-basis point move at one of the Fed’s remaining three policy meetings.
Our answer to the first question is next week’s data will give us a better indication, but as for the second, barring the economy falling out of bed, we currently see two rate cuts on the table for this year. Should upcoming data show the labor market is stronger than perceived, the market could be disappointed by the Fed’s comments and updated economic projections. That’s one factor that could lead September to live up to its reputation. Cautious comments or expectations being reset lower during the September wave of investor conferences is another.
Those outcomes along with the market’s current valuation mean we will begin September the same way we ended August — cautiously but looking for portfolio opportunities. That includes booking realized gains when appropriate as well as putting capital to work when we see a compelling reason to do so. Read on to see which positions we’re thinking about when it comes to those opportunities.
Catching Up on the Portfolio
Compared to the August gain recorded by the S&P 500 and the flat performance of the Nasdaq Composite, the portfolio continued to chug ahead over the last 22 trading days. Notable gainers for the month included Axon Enterprise AXON, Marvell Technology MRVL, and The Trade Desk TTD with meaningful double-digit moves, while mid-single-digit or better gains were posted by Costco Wholesale COST, Labcorp LH, Lockheed Martin LMT, Mastercard MA, and First Trust Nasdaq Cybersecurity ETF CIBR.
We entered August with 27 positions in the portfolio, and during the month we added Meta Platforms META, Eaton ETN, and Dutch Bros BROS, and exited Coty COTY. All three of those new positions were positive contributors to the portfolio out of the gate. Those actions put us at 29 positions closing out the month. And we’re aware that puts us at the upper end of our comfort zone when it comes to the number of positions in the portfolio.
We were even busier than those additions suggest, however. We used the early August market selloff and its oversold condition to pick up more shares of Amazon AMZN, Microsoft MSFT, Marvell, Universal Display OLED, Morgan Stanley MS, and Bank of America BAC. We also used the strength and overbought condition to lock in some big gains in our shares of Axon and Lockheed Martin LMT. Also, when we downgraded Elevance Health ELV to a Three late in the month, we took some of those profitable chips off the table.
The reason for those moves was to improve our position for what’s ahead and to also rebuild our cash position ahead of September, typically a challenging month for stocks. Entering September our cash level is just under 10% of the portfolio’s assets, but in our write-ups below we share we are keeping a close watch on Mastercard and the Energy Select Sector SPDR Fund XLE shares. Mastercard had a nice run in August, putting it on a path to our price target. With XLE, supply-demand dynamics seem to be shifting in a way that may not be conducive for the ETF’s underlying companies. Next week’s data could bring some clarity on that front.
As far as our shopping list goes, shares of Applied Materials AMAT are on our radar as are ServiceNow NOW, Meta and Eaton, as well as PepsiCo PEP if they pull back further. Should September live up to its reputation, we may be able to pick up some of these shares, but we will also be opportunistically eyeing others as well.
In terms of the Bullpen, we added Netflix NFLX recently and have discussed some other areas of interest. With the market’s valuation bumping up against its peak levels again, we will continue to look for fresh ideas for the Bullpen so we can strike when the time is right, just like we did with Eaton, Meta, and Dutch Bros.
This Week's Portfolio Videos
We cover a lot of ground during the week in our Daily Rundowns. If you happened to miss one or more of them, here are some helpful links:
Monday, August 26: What We're Watching With Nvidia, Marvell, Retailer Earnings and More
Tuesday, August 27: Let’s Discuss Management Changes With a Focus on Starbucks
Thursday, August 29: Nvidia Brings Positives for Our AI Plays
Friday, August 30: Our Plan for This Chip Company and Why We’re Keeping Tabs on Intel
Key Global Economic Readings
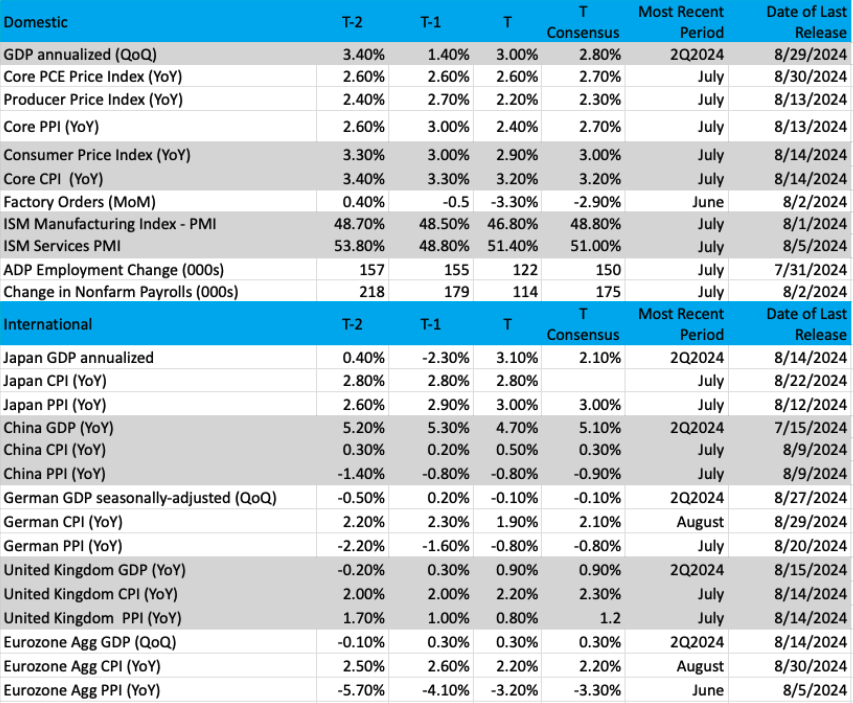
(Note: T is the most recent period, T-1 is the prior period's reading and T-2 is two periods back, the intent being to illustrate any trends)
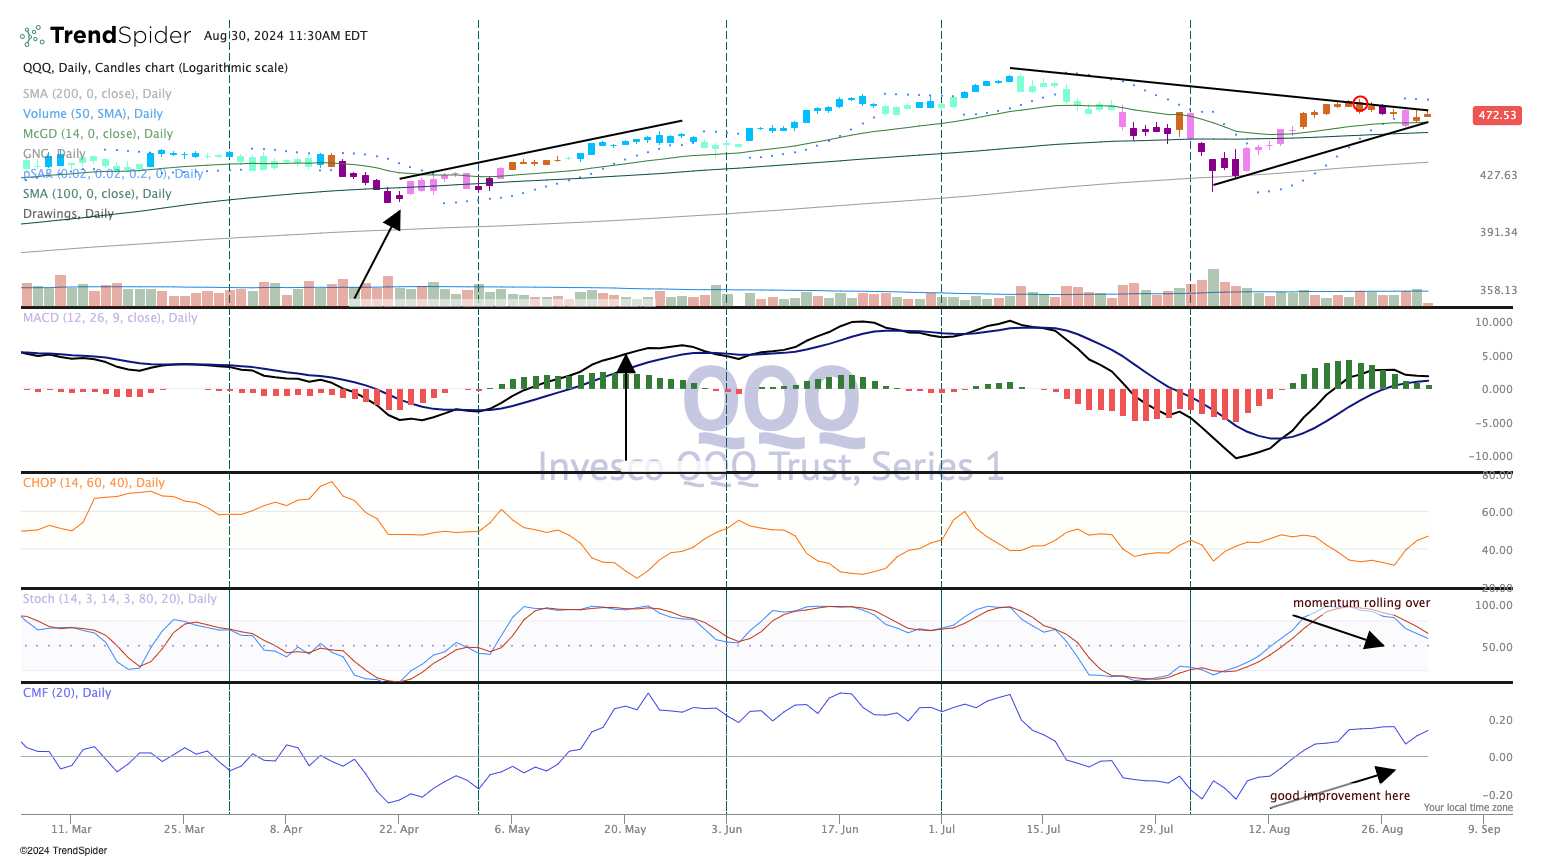
Chart of the Week: Invesco QQQ Trust
Technology stocks have taken some punishment over the past month or so. As we close out August, we find the Nasdaq 100 Invesco QQQ Trust (QQQ) challenged to make new highs. Recent action shows a lower high on the chart, something we did not see on the ascent back in the spring (left side of the chart). After the huge drop in early August, QQQ shares managed to make a stand but have fallen short of big expectations.
Now, earnings have often lifted the Nasdaq 100 to higher levels, and that may have been the case in April/May. But the recent earnings period was by all accounts very weak for names in the QQQ. Suddenly, the robust return for the QQQ in 2024 had disappeared to only a modest double-digit gain.
But while we see warning flags based on historical reference (much different today than in the spring), we should note the indicators are looking better than the price action. Money flow at the bottom is showing marked improvement, the Moving Average Convergence Divergence (MACD) is clinging to a buy signal. Volume trends, however, are starting to turn bearish, and that may be a problem. The candles are pink, which reflects cautiously bearish on the GoNoGo composite of indicators.
With much of the earnings reports for Nasdaq in the rearview mirror, we look at seasonal trends and the calendar along with economic data to guide us through the fall. History has not been kind to markets in September and October but given the fact most names in the Nasdaq have performed well in a tough environment, we should be alert to the QQQ if it should start leading the way to higher prices for the rest of the market.
Other charts we shared with you this week were:
Monday, August 26: S&P 500 - All-Time Highs Are Within Reach
Monday, August 26: Nvidia (NVDA) - Nvidia Is the Show of Strength Everyone Wants to See
Tuesday, August 27: Eaton (ETN) - Eventually Eaton Should Gobble Through the Resistance
Wednesday, August 28: ServiceNow (NOW) - ServiceNow Shows a Bull Flag
Thursday, August 29: Mastercard (MA) - Mastercard Makes a Quiet Move Up
The Week Ahead
When we return from the holiday weekend, the last for the market until Thanksgiving, we will have the usual start-of-the-month economic data. Because it is compressed into four, not five trading days, things will be a little busier than usual as we digest these August figures, revisit the speed of the economy, and determine if the Fed may deliver a 25 or 50 basis rate cut on the afternoon of September 18.
Following Friday’s July PCE price index data that came in largely as expected, we should expect the market to be keyed in on next week’s various looks at job creation in August as well as wage gains and the unemployment rate. Comments from the August Flash PMI data from S&P Global pointed to manufacturing hiring stalling during the month and a fall in service sector hiring. We’ll get a first blush at this with the final August PMI figures from S&P Global and ISM as well as ADP’s take on things. Assessing those figures will help us determine how likely the current market consensus of 163,000 jobs for August is. That the consensus figure is up from 114,000 non-farm jobs created in July and doesn’t match the Flash findings we just shared. The data we’ll get on Tuesday, Wednesday, and Thursday, will either reshape the market’s view on August job creation or support it.
In getting ready for that data, and the other items we’ve outlined below, let’s remember this — the worse the economic data looks in terms of the speed of the economy, job creation, wage gains, and the unemployment rate, the better it will be for the market’s expectation for rate cuts. Flipping that around, if we get data that shows the economy is not falling out of bed, hiring is continuing, real wages are growing and so on, the market will have to question the 100-basis points of rate cuts it expects for this year. We’ve been through periods of this a few times earlier this year, and it can be challenging for the market. Should the market continue to melt up over the next few days, we will continue to tread carefully as we consume all of next week’s data.
Here's a closer look at the economic data coming at us next week:
U.S.
Tuesday, September 3
· S&P Global Final Manufacturing PMI – August (9:45 AM ET)
· ISM Manufacturing PMI – August (10:00 AM ET)
· Construction Spending – July (10:00 AM ET)
Wednesday, September 4
· MBA Mortgage Applications Index – Weekly (7:00 AM ET)
· JOLTs Job Openings & Quits Report - July
· Factory Orders – July (10:00 AM ET)
· EIA Crude Oil Inventories – Weekly (10:30 AM ET)
Thursday, September 5
· Challenger Job Cuts Report – August (7:30 AM ET)
· ADP Employment Change Report – August (8:15 AM ET)
· Initial & Continuing Jobless Claims – Weekly (8:30 AM ET)
· Productivity & Unit Labor Cost – 2Q 2024 (8:30 AM ET)
· S&P Global Final Service PMI – August (9:45 AM ET)
· ISM Non-Manufacturing Index – August (10:00 AM ET)
· EIA Natural Gas Inventories – Weekly (10:30 AM ET)
Friday, September 6
· Employment Report – August (8:30 AM ET)
International
Monday, September 2
· China: NBS Manufacturing & Non-Manufacturing PMI – August
· China: Caixin Manufacturing PMI – August
· Japan: Jibun Bank Manufacturing PMI – August
· Eurozone: HCOB Manufacturing PMI – August·
UK: S&P Global Manufacturing PMI - August
Wednesday, September 4
· China: Caixin Services PMI – August
· Japan: Jibun Bank Services PMI – August
· Eurozone: HCOB Services PMI – August
· UK: S&P Global Services PMI – August
· Eurozone: Producer Price Index - July
Thursday, September 5
· Eurozone: Retail Sales - July
Friday, September 6
· Eurozone: GDP – 2Q 2024 (3rd estimate)
As you can see below, we have a relatively thin earnings calendar next week and one with no portfolio holdings reporting. However, we will be interested in comments about digital infrastructure demand from Ciena (CIEN), while from Broadcom (AVGO), comments on AI and smartphones will be our area of focus. With Kroger (KR), we’ll look for an update on its private-label offering and what that may mean for Bullpen resident TreeHouse Foods (THS) but also what it says about consumers, promotional activity, and eating at home. That will be of interest for our position in PepsiCo (PEP).
Here's a closer look at the earnings reports coming at us next week:
Tuesday, September 3
· Close: Zscaler (ZS)
Wednesday, September 4
· Open: Ciena (CIEN), Dick’s Sporting Goods (DKS), Dollar Tree (DLTR), Hormel Foods (HRL)
· Close: Casey’s General (CASY), Hewlett Packard Enterprise (HPE).
Thursday, September 5
· Open: Science Applications (SAIC), Shoe Carnival (SCVL)· Close: Broadcom (AVGO)
Friday, September 6
· Open: Kroger (KR).
Portfolio Investor Resource Guide
· Economic Data: Here's a List of Links to the Key Economic Data We Closely Watch
· Investing Terminology: 16 Key Terms Club Members Should Know
· 10-Ks: Want to Know About a Stock? Read the Company's Reports
· 10-Qs: Unlock the Numbers and Key Information Behind Your Stock With the 10-Q
· Income Statement: Our Cheat Sheet to Understanding This Financial Document
· Balance sheet, Cash Flow Statements, and Dividends: How to Know If a Company Is Off-Kilter? Read Its Balance Sheet
· Valuation Metrics: Everyone Wants a Value. Here's How Investors Can Find
The Portfolio Ratings System
1 - Buy Now (BN): Stocks that look compelling to buy right now.
2 - Stockpile (SP): Positions we would add to on pullbacks or a successful test of technical support levels.
3 - Holding Pattern (HP): Stocks we are holding as we wait for a fresh catalyst to make our next move.
4 - Sell (S): Positions we intend to exit.
ONES
Alphabet GOOGL; $163.38; 1,035 shares; 3.66%; Sector: Communication Services
UPDATE: Over the last month, GOOGL shares have traded off, but even with that dent, they are still up double-digits year to date. Mid-month, Google introduced its latest Pixel smartphone models that leverage its Gemini AI model. The bigger event that weighed on GOOGL, however, was word the Department of Justice was considering breaking up the company most likely with Android and Chrome being split off. We do not see a quick resolution to this, however. More than likely it will be measured in years, not months or quarters. As such, this should have little bearing on Alphabet’s business in the short to medium term. Later in the month, the company announced former Character.AI CEO Noam Shazeer will serve as co-technical lead on Google's Gemini. It also announced that next week it will release AI-related features that it previewed earlier this year at Google’s I/O event. Because we are still in the relatively early innings when it comes to AI revenue generation, we will be patient with Alphabet and GOOGL shares. We continue to see the company well positioned, given its treasure trove of data across its search, advertising, and YouTube businesses, which should benefit the company in the coming months with an upswing in digital advertising. As AI matures, we see it bringing further lift to Google Cloud’s revenue and profit generation. Currently, the shares are trapped between support near $156 and resistance between $171-$174. If they find their way closer to that support level, it could be an even better place to add.
1-Wk. Price Change: -1.4%; Yield: 0.5%
INVESTMENT THESIS: We believe that while search and digital ad dominance are what will carry shares in the near- to mid-term, longer-term it is the company's artificial intelligence "moat" that will provide for new avenues of growth. AI is what has made the company's search, video, and targeted ad capabilities best-in-class and is the driving force behind the company's success in voice (Google Home) and autonomous driving (Waymo). Furthermore, we believe it is this AI expertise that will also make the company more prevalent in other industries, including healthcare via its subsidiary Verily, as AI and machine learning continue to disrupt operations across industries. Adding to our positive view of the company's future opportunities, we believe that Alphabet's free cash flow generation and solid balance sheet set it apart and are what will allow the company to continue taking chances on far-out ground-breaking and potentially world-changing projects. The company is also preparing to roll out Gemini Subscription with enterprise plans for workspace, according to a report. All good news for Alphabet.
Target Price: Reiterate $210; Rating: One
Panic Point: $145
RISKS: Regulatory risk (data privacy), competition, and macroeconomic slowdown impacting consumers and therefore ad buyer activity.
Amazon AMZN; $178.50; 946 shares; 3.63%; Sector: Consumer Discretionary
UPDATE: Amazon (AMZN) shares pulled back along with the rest of the market in early August and that led us to scoop up more before they clawed back some of those losses. The July retail sales report confirmed the strong showing of 2024 Prime Day, which means the company started on strong footing for the current quarter. As we get ready for the seasonally strongest time of the year for the company, Amazon announced it will hold a Prime Big Deal Day in October, similar to what it did last year. With retailers sharing that consumers remain selective, we continue to see them utilizing Amazon to stretch their spending dollars. Meanwhile, recent comments from ServiceNow (NOW) and Salesforce (CRM) confirm corporate uptake of AI. That and the continued migration to the cloud sets up Amazon Web Service rather well. As seasonal strength takes hold, it should bring with it some nice margin leverage following cost reductions put in place over the last several quarters. We continue to see Amazon investing in AI and data center, which should bode well for AWS and could bring even more savings to its other businesses. We’ve also noticed the growing ad revenue stream at the company’s streaming offerings, another driver of margin improvement and cash flow. The recent move lower has AMZN shares bumping up against their 200-day moving average, which also coincides with filling a mid-August gap in the chart. A successful test in the coming days could signal the worst of the quarter to date move lower is behind us.
1-Wk. Price Change: 0.8%; Yield: 0.0%
INVESTMENT THESIS: We believe upside will result from Amazon's continued eCommerce dominance, AWS's continued leadership in the public cloud space, and ongoing growth of the company's advertising revenue stream, which feeds off Amazon's eCommerce business. Additionally, we think profitability will continue to improve as AWS and advertising account for a larger portion of total sales as both these segments sport higher margins than the eCommerce operation. While we believe the increasing share of the revenue from these higher margin businesses will be key to driving profitability longer-term, we think margins on eCommerce stand to improve as the company's infrastructure is further built out and economies of scale further kick in. The embedded call option is that management is always looking to enter a new space and generate new revenue streams.
Target Price: Reiterate $220; Rating: One
Panic Point: $148
RISKS: High valuation exposes the stock to volatile swings, eCommerce has exposure to slower consumer spending and competition, management is not afraid to invest heavily, potential headwinds resulting from new eCommerce regulation in India, and management is not scared to invest aggressively for growth, which can at times cause volatile reactions as near-term concerns arise relating to the impact on margins.
Builders FirstSource BLDR; $174.00; 650 shares; 2.44%; Sector: Industrials
UPDATE: Even though shares of Builders FirstSource ended August on a weak note, the net positive move for the month added to their July gains. This put the shares ahead of both the S&P 500 and the Nasdaq quarter to date. Our rationale behind owning BLDR in the portfolio stems from the expected improvement in the housing market as the Fed embarks on a rate-cutting cycle, and monetary policy moves back to a more neutral level from being restrictive. We see that playing out over several quarters, which means we will remain patient investors in this position. We will continue to monitor upcoming data and rate-cut implications, but we will also be listening to homebuilders during the upcoming September conference season and when they report their quarterly results. Should we see homebuilders accelerate their uptake of the Builder’s value-added products business as part of a strategy to manage their costs, it would be a catalyst for the shares and one that could lead us to revisit our price target. We see multiple layers of support for the stock at the $168 and $162 level. While we will keep an eye on upcoming housing starts, our thinking is the larger near-term determinant fo the shares will be the September 18 Fed meeting and the number of rate cuts found in the Fed’s updated set of economic projections. Our BLDR position is ~2.5% of the portfolio’s assets and if possible, we would be interested in adding to the position closer to our cost basis.
1-Wk. Price Change: -4.5%; Yield: 0.0%
INVESTMENT THESIS: Builders FirstSource is a supplier and manufacturer of building materials, manufactured components, and construction services to professional homebuilders, sub-contractors, remodelers, and consumers. The company’s top-10 customers account for 15% of net sales and are comprised primarily of the largest national production homebuilders, including publicly traded companies such as D.R. Horton, Dream Finders Homes, Lennar Corp., Pulte, Taylor Morrison Home, and Toll Brothers. The company is leveraging its national manufacturing footprint to grow its higher-margin value-added products as homebuilders look for more efficient ways to construct homes. We see this driving faster revenue and earnings growth in the coming quarters as the eventual rate-cutting cycle by the Fed lifts the demand for housing.
Target Price: $205; Rating: One
Panic Point: $135.
RISKS: Economy, interest rates, commodity pricing, and supply chain risks.
Dutch Bros BROS; $31.00; 3,540 shares; 2.38%; Sector: Consumer Cyclical
UPDATE: We used the post-June quarter earnings pressure to call up Dutch Bros from the Bullpen with a $39 price target because of the opportunity to get into the shares at a price that did not reflect the company’s continued expansion plans and favorable operating leverage. Following that earnings report, Baird and Stifel set their respective price targets at $37 and $38, while Guggenheim upgraded BROS to a Buy rating and TD Cowen reduced its target to $47 from $50. As the Fed enters its rate-cutting cycle, we could see hurdle rates for new construction projects fall. Given its cash-rich balance sheet, access to capital, and current footprint, this suggests Dutch Bros could continue to expand at a healthy clip in 2025. We added further to this holding in mid-August when we closed out the portfolio’s position in Coty (COTY), and again later in the month, leaving the portfolio with a good-sized position but one that is far from fully built out.
1-Wk. Price Change: -2.1%; Yield: 0.0%
INVESTMENT THESIS: Dutch Bros is an operator and franchisor of drive-thru shops that focus on serving high-quality, hand-crafted beverages with unparalleled speed and superior service. As of June 30, 2024, there were 912 shops in operation in 18 U.S. states, of which 612 were company-operated and 300 were franchised. Coffee-based beverages make up ~50% of the menu mix, and ~25% of the menu mix is based upon the company’s proprietary Blue Rebel energy drink, which is highly customizable with flavors and modifiers and can be served blended or over ice. The energy platform helps unlock the afternoon daypart and broadens the company’s appeal. The remaining 25% of the menu mix is a wide variety of teas, lemonades, sodas, and smoothies. Through the first half of 2024, Dutch Bros opened 81 shops and targets 150-165 new ones for all of 2024. The company’s west-to-east expansion is a time-tested strategy that should drive revenue and EPS growth over the next several years.
Target Price: Reiterate $39; Rating: One
Panic Point: $25
RISKS: Commodity risks, labor costs, interest rate risk, inflation.
Marvell Technology MRVL; $76.24; 2,690 shares; 4.46%; Sector: Technology
UPDATE: After coming under pressure in the back half of July along with the market and other tech companies, we picked up more shares of Marvell (MRVL) at $57.54 in early August. We did this following increased capital spending expectations on AI and data center from several Big Tech companies. Soon thereafter, TSM’s jaw-dropping July revenue report confirmed AI and data center demand was accelerating and jump-started MRVL shares. As more companies reported, it became evident the enterprise was adopting AI and the looming ramp in AI on device was starting to unfold. That reinforced our view that Marvell’s enterprise networking and carrier infrastructure segments should rebound in the coming quarters as AI gobbles up existing network capacity. This week, Marvell’s July-quarter earnings report confirmed our thinking while robust AI and data center demand as well as its custom AI solutions with Meta, Amazon, and eventually Microsoft ramp in the coming quarters. In our earnings Alert, we discussed how short covering was helping pop the shares late this week, and while we remain bullish on MRVL over the medium and longer term some prudent portfolio action could be warranted after the holiday weekend.
1-Wk. Price Change: 6.1%; Yield: 0.3%
INVESTMENT THESIS: Marvell is a fabless supplier of high-performance standard and semi-custom infrastructure semiconductor solutions. These solutions power the data economy, enabling the data center, carrier infrastructure, enterprise networking, consumer, and automotive/industrial end markets. With roughly 75%-80% of Marvell's revenue stream tied to digital infrastructure, we see it continuing to benefit from rising content consumption and creation. Pointing to that rising demand that necessitates network densification and the build of digital infrastructure, Ericsson sees global monthly average usage per smartphone reach 46 gigabytes (GB) by the end of 2028 vs. 19 GB in 2023 and 15 GB in 2022.
Target Price: Reiterate $95; Rating: One
Panic Point: $55
RISKS: Technology risk, customer risk, competition risk, reliance on manufacturing partners, and supply chain constraints.
Nvidia Corp. NVDA; $119.37; 1,510 shares; 3.91%; Sector: Technology
UPDATE: While Nvidia shares started August off under pressure along with the rest of the market, they quickly rebounded following Taiwan Semiconductor’s (TSM) jaw-dropping July revenue report and comments from Amazon, Meta, Microsoft, and Google that they would be increasing their AI and data center capital spending in H2 2024 and again in 2025. Those and other supportive data points led NVDA shares to rally roughly 30% ahead of its July-quarter earnings report this week. That report was solid across the board, and led us to boost our price target to $155 from $148. In our pre-earnings Alert, we anticipated the potential for Wall Street to have a somewhat meh attitude to Nvidia’s results following the recent 30% move in the stock. We also said that if we saw the shares pull back to the support levels near $110 it would be an opportunity for newer members and those underweight NVDA. We continue to think that but given the upside of almost 30% to our revised target, we continue to rate NVDA a "One." Should we see the typical September performance in the market pressure NVDA, that could make for an even more compelling opportunity.
1-Wk. Price Change: -7.7%; Yield: 0.0%
INVESTMENT THESIS: Nvidia is well positioned to benefit from ramping AI and data center spending. The company pioneered accelerated computing to help solve the most challenging computational problems. Nvidia is now a full-stack computing infrastructure company with data-center-scale offerings that are reshaping the industry. The company's full stack includes the foundational CUDA programming model that runs on all Nvidia GPUs, as well as hundreds of domain-specific software libraries, software development kits, or SDKs, and Application Programming Interfaces, or APIs. This deep and broad software stack accelerates the performance and eases the deployment of Nvidia accelerated computing for computationally intensive workloads such as artificial intelligence, or AI, model training and inference, data analytics, scientific computing, and 3D graphics, with vertical-specific optimizations to address industries ranging from healthcare and telecom to automotive and manufacturing. Nvidia reports in two business segments: Compute & Networking and Graphics. The Compute & Networking segment (78% of revenue, 85% of operating income) is comprised of Data Center accelerated computing platforms and end-to-end networking platforms, including Quantum for InfiniBand and Spectrum for Ethernet; NVIDIA DRIVE automated-driving platform and automotive development agreements; Jetson robotics and other embedded platforms; Nvidia AI Enterprise and other software; and DGX Cloud software and services. The Graphics segment (22% of revenue, 15% of operating income) includes GeForce GPUs for gaming and PCs, the GeForce NOW game streaming service and related infrastructure; Quadro/NVIDIA RTX GPUs for enterprise workstation graphics; virtual GPU, or vGPU, software for cloud-based visual and virtual computing; automotive platforms for infotainment systems; and Omniverse Enterprise software for building and operating metaverse and 3D internet applications.
Target Price: $155; Rating One
Panic Point: $100
RISKS: Market and interest rate risk, credit risk, country risk, and operational risk, including cybersecurity.
Qualcomm Inc. QCOM; $175.30; 1,034 shares; 3.90%; Sector: Technology
UPDATE: After a painful decline in July for Qualcomm (QCOM) shares, following TSM’s July revenue report, robust guidance from Apple partner Hon-Hai (HNHPF), and supportive AI on PC forecasts from research firm Canalys, we upgraded QCOM to a One rating on August 14. Soon thereafter, market chatter about Apple’s modem efforts and the potential impact on Qualcomm made the rounds. We shared our view as to why the market was overreacting to an event that best case for Apple would start slowly and with lower-end iPhone models in the coming years. As Qualcomm makes inroads with PC vendors, leveraging its AI relationship with Microsoft (MSFT), there is also the potential for greater adoption of cellular connectivity and modems in the notebook PC market. This year less than 10% of all notebook PCs are expected to ship with that connectivity but that is expected to ramp to nearly half of all shipments in the next few years. And, as we’ve discussed, other opportunities in the auto and IoT markets should help reduce Qualcomm’s exposure to the smartphone market. As that occurs, we could see the market revisit how it values QCOM shares. The next set of catalysts for QCOM shares will be the August revenue reports from TSM and Hon Hai as well as the market’s reaction to Apple’s upcoming September 19 event.
1-Wk. Price Change: 1.0%; Yield: 1.9%
INVESTMENT THESIS: Qualcomm focuses on foundational technologies for the wireless industry, including 3G (third generation), 4G (fourth generation), and 5G (fifth generation) wireless technologies and processor technologies including high-performance, low-power computing, and on-device artificial intelligence technologies. As a connected processor company, its technology roadmap aims to enable the connected intelligent edge (the next generation of smart devices) across industries and applications beyond handsets, including automotive and the Internet of Things (IoT). Qualcomm has three reportable segments: QCT (Qualcomm CDMA Technologies) semiconductor business, which develops and supplies integrated circuits and system software based on 3G/4G/5G and other technologies for use in mobile devices; automotive systems for connectivity, digital cockpit, and ADAS/AD; and IoT including consumer electronic devices; industrial devices; and edge networking products. QCT accounts for 80%-85% of revenue. QTL (Qualcomm Technology Licensing) licensing business grants licenses or otherwise provides rights to use portions of the company's intellectual property portfolio, which includes certain patent rights essential to and/or useful in the manufacture and sale of certain wireless products. QTL accounts for ~15% of Qualcomm's revenue but contributes a greater portion of the company's operating income.
Target Price: $255; Rating: Three
Panic Point: $148
RISKS: Customer risk, technology advancement, competition risk, third-party supplier, and manufacturing partner risk.
The Trade Desk TTD; $104.53; 1,570 shares; 3.55%; Sector: Technology
UPDATE: Trade Desk shares have been a strong performer for the portfolio as our rationale for adding them to the portfolio played out. Helping our thesis, the company delivered a beat-and-raise June quarter, and in response, we lifted our price target to $120 from $110. Trade Desk continues to benefit from the overall mix shift toward digital advertising as advertisers look to reach consumer eyeballs. It is also benefiting from the growing use of advertising business models across streaming video platforms and digital audio like those found at Netflix (NFLX), Disney (DIS), Warner Bros. Discovery (WBD), Amazon (AMZN), Spotify (SPOT) and others. Those efforts along with the continued adoption of mobile advertising as well as that for digital audio, including podcasts, have Trade Desk thinking its addressable global digital advertising market has the potential to reach $1 trillion. We called out Trade Desk as a beneficiary of President Biden opting out of the 2024 presidential race with VP Kamala Harris getting the nod. We’ve expected a contentious race, and we think that will be the case even more so now with both parties leaning into digital advertising to get their messages out. We see that growing digital advertising in H2 2024 on top of the ongoing share gains from analog advertising.
1-Wk. Price Change: -0.4%; Yield: 0.0%
INVESTMENT THESIS: The Trade Desk offers a cloud-based ad-buying platform that empowers its clients to plan and manage data-driven digital advertising campaigns across ad formats and channels, including video, display, audio, digital-out-of-home, and social. Modalities for those campaigns span a multitude of devices, such as computers, mobile devices, televisions, and streaming devices. This positions the Trade Desk to benefit from an accelerating shift toward digital advertising. That shift is expected to see digital advertising account for more than 70% of total ad spending in 2025 rising to ~74% by 2027. We also see the company benefiting from the use of digital advertising in the 2024 presidential campaign, which is expected to grow more than 150% compared to 2024, putting it around $3.5 billion.
Target Price: Reiterate $120; Rating: One
Panic Point: $85
RISKS: Advertising spending; customer risk and loss; evolving market dynamics and competitive landscape; platform disruptions and outages.
Universal Display OLED; $193.72; 960 shares; 4.03%; Sector: Technology
UPDATE: We used the pressure on tech stocks and the oversold nature of the market in early August to build up the portfolio’s exposure to Universal Display (OLED). While we didn’t catch where the shares bottomed out earlier this month, the trade price didn’t lift our cost basis in a meaningful way. Soon after we added those shares, OLED started to rebound. Spurring that move was a combination of favorable data points across the smartphone supply chain, including ones from TSM and Hon Hai (HNHPF). Building on those data points, IDC upped its 2024 smartphone shipment forecast and the firm now sees industry shipment levels rising 5.8% year over year, up from its prior forecast of 4%. As part of that revision, IDC shared expectations for iPhone shipments to rise 0.8% this year but also said there could be upside “depending on how well the demonstrated GenAI use cases play out in the upcoming iPhone 16 launch.” Some on Wall Street recognize nearly 300 million iPhones have not been upgraded in the last few years, and that could foster a very strong replacement cycle starting later this year. While IDC didn’t call that out, it does see iOS smartphone shipments climbing 4% in 2025, but that could be conservative depending on how consumers receive Apple Intelligence. Our view is that If Apple can deliver an AI "wow" factor with its September 9 product demonstrations, it could stoke the "want" factor and help drive the expected upgrade cycle. As we get ready for that event, we’ll be watching out for the August revenue reports from Taiwan Semiconductor and Hon Hai, which should show sequential revenue gains as smartphone volumes ramp. We will also be gauging reception for new foldable smartphone models and other larger form factor ones that consume greater quantities of organic light-emitting diode chemicals. With roughly 50% of the smartphone market penetrated by organic light-emitting diode displays, 3% of the TV market, and 2% of the PC and tablet market, we see a long runway ahead for OLED shares even before we factor in automotive lighting and the general illumination market.
1-Wk. Price Change: -0.2%; Yield: 0.8%
INVESTMENT THESIS: Universal Display focuses on the development and commercialization of organic light-emitting diode (OLED) technologies and materials for use in display and solid-state lighting applications. OLED displays are capturing a growing share of the display market, especially in the mobile phone, television, monitor, wearable, tablet, notebook, personal computer, augmented reality (AR), virtual reality (VR), and automotive markets. This adoption reflects advantages over competing display technologies with respect to power efficiency, contrast ratio, viewing angle, video response time, form factor, and manufacturing cost. Universal's business strategy is to develop new OLED materials and sell existing and new materials to product manufacturers for display applications, such as mobile phones, televisions, monitors, wearables, tablets, portable media devices, notebook computers, personal computers, and automotive applications, and specialty and general lighting products. The company also looks to license its OLED material, device design, and manufacturing technologies to those manufacturers. As such, Universal has a significant portfolio of proprietary OLED technologies and materials with more than 5,500 patents issued and pending worldwide.
Target Price: Reiterate $250; Rating: One
Panic Point: $155
RISKS: Patent and Intellectual property protection; maintaining OLED manufacturing and customer relationships; technology risk; market risk.
Vulcan Materials Company VMC ; $245.21; 613 shares; 3.24%; Sector: Building Materials
UPDATE: Shares of Vulcan fell sharply in early August following the company’s June-quarter results, which led us to trim our long-term price target to $300 from $310. Citi dialed back its price target to $292 from $294, while Truist reduced its to $300 from $320. The company was hard hit by counterproductive construction weather in Q2 2024 and Vulcan management cautioned that happened again in July. Construction spending data and other indicators have painted a positive demand backdrop for Vulcan, however. We believe the eventual move by the Fed to cut rates will lower project hurdle rates, benefiting non-residential construction activity as well as housing construction. As that happens, we should also start to see the benefit of CHIPs Act funding on construction activity. All of this offers a favorable medium to longer-term outlook for Vulcan’s aggregates business and our shares. During the week, Morgan Stanley said it sees a cement “super cycle” forming over the next several years that should drive consistent low-single-digit demand growth over the 2025-2030 period. We connected those dots to infrastructure spending and an expected rebound in housing construction, both of which should benefit from the Fed entering a rate-cutting cycle. The next catalyst we will be watching will be next week’s July Construction Spending report. The confluence of summer weather and infrastructure spending dollars should yield a favorable report and should serve as a potential catalyst for VMC shares.
1-Wk. Price Change: -3.8%; Yield: 0.8%
INVESTMENT THESIS: Vulcan Materials operates primarily in the U.S. and is the nation's largest supplier of construction aggregates (primarily crushed stone, sand, and gravel), a major producer of asphalt mix and ready-mixed concrete, and a supplier of construction paving services. Its products are the indispensable materials used in building homes, offices, places of worship, schools, hospitals, and factories, as well as vital infrastructure including highways, bridges, roads, ports and harbors, water systems, campuses, dams, airports, and rail networks. Ramping spending associated with the Biden Infrastructure Law should drive demand for Vulcan's products over the coming years. Vulcan has historically complemented its organic growth prospects by acquiring businesses to expand its geographic reach and product scope. Since 2014, the company has acquired more than two dozen companies, including the 2021 acquisition of U.S. Concrete. That combination has allowed the company to deliver steady top and bottom-line growth over the last decade, with only a modest decline when the pandemic hit in 2020.
Target Price: Reiterate $300; Rating: One
Panic Point: $225
RISKS: General economic and business conditions; dependence on the construction industry; timing of federal, state, and local funding for infrastructure; changes in the level of spending for private residential and private nonresidential construction.
TWOs
Apple AAPL ; $229.00; 790 shares; 3.92%; Sector: Technology
UPDATE: Apple shares built on July’s gains in August with a strong finish for the month. Spurring that move was a combination of favorable data points across the company’s supply chain, including ones from Taiwan Semi (TSM) and Hon Hai (HNHPF) that pointed to ramping iPhone volumes in H2 2024 as it launches its next iteration of models. Building on those data points, IDC upped its 2024 smartphone shipment forecast, which includes iOS smartphone shipments rising 0.8% this year but continues to say that there could be upside “depending on how well the demonstrated GenAI use cases play out in the upcoming iPhone 16 launch.” Some on Wall Street recognize nearly 300 million iPhones have not been upgraded in the last few years, and that could foster a very strong replacement cycle starting later this year. While IDC didn’t call that out, it does see iOS smartphone shipments climbing 4% in 2025, but that could be conservative depending on how consumers receive Apple Intelligence. During the week, we added our view that If Apple can deliver an AI "wow" factor with its September 9 product demonstrations, it could stoke the "want" factor and help drive the expected upgrade cycle. As we get ready for that event, we’ll be watching out for the August revenue reports from TSM and HNHPF, which should show sequential revenue gains as smartphone volumes ramp and data center demand remains strong. Based on what we learn from the combination of these upcoming events, we may need to revisit our AAPL price target. If that’s the case, odds are we won’t be alone. As we move through September, we will be checking supplier comments as they make the rounds at investor conferences.
1-Wk. Price Change: 1.0%; Yield: 0.4%
INVESTMENT THESIS: While we acknowledge that near-to-midterm performance remains heavily influenced by iPhone sales, the dynamic is shifting as investors finally place greater emphasis on Services growth. We are bullish on the 5G upgrade cycle and believe longer-term upside will continue to come as Services revenue grows its share of overall sales. Services provide for a recurring revenue stream at higher margins, a factor that serves to reduce earnings volatility while allowing for a higher percentage of sales to fall to the bottom line; as a result, we believe that Services growth and the installed base, are much more important than how many devices the company can sell in each 90-day period. In addition to improved profitability, we also believe the transparent nature of this revenue stream will demand an expanded price-to-earnings multiple as segment sales grow. Furthermore, we believe that Apple's desire to push deeper into the healthcare arena will help make its devices invaluable as more life-changing features are added and the company works to democratize health records. Lastly, also see upside resulting from increased adoption of wearables (think the Apple Watch) and potential new product announcements such as an AR/VR headset or an update on Project Titan, the company's secretive autonomous driving program.
Target Price: Reiterate $250; Rating: Two
Panic Point: Reiterate $185
RISKS: Slowdown in consumer spending, competition, lack of new product innovation, elongated replacement cycles, failure to execute on Services growth initiative.
Applied Materials Inc. AMAT; $197.26; 536 shares; 2.27%; Sector: Semiconductor Manufacturing
UPDATE: Following Applied’s July-quarter earnings beat reported in mid-August, we reiterated our Two rating on the shares and our $240 price target. We did so largely because, despite the quarterly beat, Applied's forward guidance only book-ended the existing consensus forecast for this year. In response, we saw several Wall Street price targets cut to $250-$260 from $275-$280. We continue to see Applied’s financials improving as rising chip capacity utilization levels drive incremental chip equipment demand and the impact of reshoring spending, like the U.S. CHIPs Act, kicks in. Ahead of that inflection point, which looks to be a late 2024 event and should reignite revenue and EPS growth, this recent pullback has us revisiting the shares as they have crossed below our $195 panic point. AMAT is also flirting with its 200-day moving average and a successful test could lead us to scoop up additional shares and reset our panic point. Another part of our decision will hinge on Applied’s presentation at the Citi Global TMT Conference on Wednesday, September 4.
1-Wk. Price Change: -2.7%; Yield: 0.8%
INVESTMENT THESIS: Applied provides manufacturing equipment, services, and software to the semiconductor, display, and related industries. With its diverse technology capabilities, Applied delivers products and services that improve device performance, power, yield, and cost. Applied's customers include manufacturers of semiconductor chips, liquid crystal, and organic light-emitting diode displays, and other electronic devices. Applied operates in three reportable segments: Semiconductor Systems (73% of 2022 revenue, 78% of 2022 operating income), Applied Global Services (22%, 19%), and Display and Adjacent Markets (5%, 2%). Key customers include Samsung (12% of 2022 sales), Taiwan Semiconductor (20%), and Intel (10%).
Target Price: Reiterate $240; Rating: Two
Panic Point: $195
RISKS: Manufacturing and Supply Chain, Competitive Factors, Government Regulation, Technology Change.
Axon Enterprise AXON; $364.97; 443 shares; 3.50%; Sector: Aerospace & Defense
UPDATE: Following the post-June quarter earnings pop in Axon (AXON) shares we locked in a 99% gain in one slice of our holdings in early August. When we made that move, we also downgraded AXON to a Two rating from One. As the market recovered from its oversold condition, the shares drifted higher pushing them deeper into overbought territory. That led us to ring the register again later in the month, this time locking in another massive gain. The key to further upside past even those higher targets will be the continued mix shift toward higher-margin cloud services, something that will only be revealed in Axon’s quarterly earnings. Because we are in an election year, we will want to be mindful of public safety spending prospects and how that could shape demand for Axon in the next few years.
1-Wk. Price Change: -1.5%; Yield: 0.00%
INVESTMENT THESIS: Axon Enterprise develops, manufactures, and sells conducted energy devices and cloud-based digital evidence management software designed for use by law enforcement, corrections, military forces, private security personnel, and private individuals for personal defense. The company operates in two segments: Taser and Software & Sensors. Taser develops and sells CEDs used for protecting users and virtual reality training. Software & Sensors manufactures fully integrated hardware and cloud-based software solutions such as body cameras, automated license plate reading, and digital evidence management systems. Axon delivers its products worldwide and gets most of its revenue from the United States. President Biden's fiscal year 2023 budget requests a fully paid-for new investment of approximately $35 billion to support law enforcement and crime prevention — in addition to the president's $2 billion discretionary request for these same programs. According to Mordor Intelligence, the wearable, and body-worn cameras market on its own was valued at $1.62 billion in 2020 and is expected to reach $424.63 billion by 2026.
Target Price: Reiterate $385; Rating: Two
Panic Point: $310
RISKS: Manufacturing and supply chain, competitive factors, government regulation, technology change.
Bank of America Corp. BAC; $40.75; 4,200 shares; 3.71%; Sector: Financial Services
UPDATE: It has been a wild couple of months for Bank of America, but the stock is right back where it was two months ago near $40. Still, the action over July and early August was volatile, with the stock soaring to $44 at one point but getting bludgeoned down to the $35 area just a few weeks later. We used the weakness to add shares earlier this month. The recent recovery from those lows has been on pretty good turnover, but we heard recently Warren Buffett has been selling his shares (25 million of them). His company Berkshire Hathaway still owns millions of shares of the big bank but simply took profits to shore up an already robust cash position. BAC continues to impress and trade higher in a better economic environment with lower rates (on the long end) and continued investment banking strength. If there is a new leg of home refinancing and loan origination as rates move down further, we see Bank of America benefiting.
1-Wk. Price Change: 2.5%; Yield: 2.6%
INVESTMENT THESIS: Bank of America is one of the world's leading financial institutions, serving individual consumers, small and middle-market businesses, and large corporations with a full range of banking, investing, asset management, and other financial and risk management products and services. The company provides unmatched convenience in the United States, serving approximately 67 million consumer and small business clients with approximately 3,900 retail financial centers, approximately 16,000 ATMs, and award-winning digital banking with approximately 56 million verified digital users. Bank of America is a global leader in wealth management, corporate and investment banking, and trading across a broad range of asset classes, serving corporations, governments, institutions, and individuals around the world. Bank of America offers industry-leading support to approximately 3 million small business households through a suite of innovative, easy-to-use online products and services. The company serves clients through operations across the United States, its territories, and approximately 35 countries. From a reporting perspective, the company's business breaks down as follows: Net Interest Income breakdown: Consumer Banking 57%, Global Banking 23%, Global Wealth & Investment Management 14%, and Global Markets 6%; Income Before Tax breakdown: Consumer Banking 42%, Global Banking 27%, Global Wealth & Investment Management 16%, and Global Markets 15%. Bank of America pays a quarterly dividend of $0.22 per share.
Target Price: $49; Rating: Two
Panic Point: $32
RISKS: Financial markets, fiscal, monetary, and regulatory policies, economic conditions, and credit ratings.
Costco Wholesale COST; $892.38; 210 shares; 4.06%; Sector: Consumer Staples
UPDATE: Costco had a productive month, significantly outperforming the market in August with the stock tagging a new all-time high near $920 at one point this week. That is an impressive move following a steep drop in July following earnings. But as we often see with moving averages the stock found support at the 100-day just under $800, and it was off to higher highs from there. The stock reached a daily overbought condition this past week so a brief pause or pullback would not be a surprise. Next week brings the company’s August sales report, which should show continued wallet share gains but also progress on its expanding footprint, a harbinger of new membership growth. Next week also brings the recently announced and long-expected membership price hike that should help lift the profits from that important revenue stream. Following reports of driver unionization efforts, we’ll see what develops but part of Costco’s reputation is derived from how well it treats its team members. As we digest next week’s August sales report and get ready for the company’s quarterly results on September 26, we’ll revisit our price target as needed. We continue to see the company benefiting from selective consumer spending and efforts to stretch the spending dollars consumers do have.
1-Wk. Price Change: 1.5%; Yield: 0.5%
INVESTMENT THESIS: We like Costco's long-term prospects, driven by a club-based operating model that focuses on volumes, not margins, and therefore offers its customers a value proposition of everyday low prices. The strength of this model has created an incredibly loyal customer base with low churn and continued share gains in both bricks-and-mortar and e-commerce. This is a global concept, evidenced by the strength of sales both in the U.S. and abroad, which includes an emerging China opportunity. We see the company's membership model as a key differentiator vs. other retailers and its plans to open additional warehouse locations in the coming quarters should drive retail volumes and the higher-margin membership fee income as well. We also appreciate management's approach to capital returns and their willingness to return cash when it is in excess on the balance sheet.
Target Price: Reiterate $950. Rating: Two
Panic Point: $750
RISKS: Inability to pass through higher costs, fuel prices, weaker consumer, and membership churn.
Eaton Corp. ETN; $306.93; 300 shares; 1.98%; Sector: Industrials
UPDATE: We used the early August market sell-off to call up Eaton (ETN) shares from the Bullpen, establishing an initial price target of $350. We’ve been watching ETN shares for some time as a play on the power pain point being created primarily from the expected data center build-out but also other demands, including those tied to EV charging station growth. Mid-August we scooped up more shares because U.S. electric utilities have raised their 2030 guidance of cumulative data center electricity demand by roughly 50%. After these buys, the portfolio’s position is not full, and the shares are on our shopping list should the market pullback in the coming weeks. The shares have nice support at near the $287 level, which is where the 200-day moving average currently resides. In the coming months, we’ll be listening for 2025 capital spending comments not only from Big Tech but also from U.S. electric utilities.
1-Wk. Price Change: 2.3%; Yield: 1.2%
INVESTMENT THESIS: Eaton is an intelligent power management company that makes products for data center, utility, industrial, commercial, machine building, residential, aerospace, and mobility markets. That business is positioned to capitalize on the megatrends of electrification, energy transition, and digitalization. We see Eaton helping address the power pain point created by data center, EV charging infrastructure, and other drivers of electricity demand. Research estimates that data center power demand will grow 160% by 2030, accounting for 3%-4% of global power up from 1%-2% today. Data centers will use 8% of U.S. power by 2030, compared with 3% in 2022.
Target Price: Reiterate $350; Rating: Two
Panic Point: $250
RISKS: Raw material costs, labor costs, end market volatility, government legislation.
The Energy Select Sector SPDR Fund XLE; $91.28; 1,345 shares; 2.65%; Sector: Energy
UPDATE: The XLE chart is reflecting renewed uncertainty between energy supply and demand. However, the volatility has come out of the ETF in a big way, and the range of the XLE has narrowed considerably as the XLE just bounces around above the 200-day moving average support. This has XLE shares in a range between $86 to $94. If the 200-day moving average fails to hold at $88 we may need to re-consider this holding. From a fundamental perspective, the weekend’s August PMI data for China and next week’s data for the U.S. will be a determining factor in oil demand. With reports pointing to OPEC+ poised to go ahead with planned output price increases in October, weakening demand and more supply is a recipe for lower oil prices. As we digest the data, barring any geopolitical flare-ups, we’ll plot our next move with XLE shares.
1-Wk. Price Change: 1.0%; Yield: 3.2%
INVESTMENT THESIS: The Energy Select Sector SPDR Fund is an exchange-traded fund that tracks the performance of the Energy Select Sector Index. The ETF holds large-cap U.S. energy stocks. It invests in companies that develop & produce crude oil & natural gas and provide drilling and other energy-related services. The holdings are weighted by market capitalization.
Target Price: Reiterate $100; Rating: Two
Panic Point: $84
RISKS: Interest rates, weakness in the broad economy, energy prices.
First Trust Nasdaq Cybersecurity ETF CIBR; $59.33; 2,530 shares; 3.25%; Sector: Cybersecurity
UPDATE: Cybersecurity stocks have been on a roll since bottoming with the markets on August 5. Since then, the CIBR ETF has been up a robust 15% on very strong turnover. This tells us big institutions have been buying CIBR shares. Closing out August, the share price is up against the old February highs (circa $59), but a move past $60 would be very bullish. There have been many security breach incidents over the past month but also strong earnings from CrowdStrike (CRWD) and CyberArk (CYBR) along with Palo Alto Networks (PANW). Next week, we’ll hear from Broadcom (AVGO), the top-weighted name in the ETF, and what we hear could trigger our price target being reset. While we hear about new cyberattacks each week, the biggest hack we’ve heard about in some time was on August 7 when it was revealed nearly three billion people may have had their personal data compromised. It is considered one of the largest breaches of data ever, covering nearly 45% of the entire world population. We still believe heavy spending in this space is necessary for businesses to protect their crown jewels. Bad actor usage of AI in their attacks means we are not likely to see any slowdown in cybersecurity spending on the horizon.
1-Wk. Price Change: 0.2%; Yield: 0.0%
INVESTMENT THESIS: The First Trust Nasdaq Cybersecurity ETF seeks investment results that correspond generally to the price and yield (before the fund's fees and expenses) of an equity index called the Nasdaq CTA Cybersecurity Index. The Nasdaq CTA Cybersecurity Index is designed to track the performance of companies engaged in the cybersecurity segment of the technology and industrial sectors. It includes companies primarily involved in the building, implementation, and management of security protocols applied to private and public networks, computers, and mobile devices to protect the integrity of data and network operations. To be included in the index, a security must be listed on an index-eligible global stock exchange and classified as a cybersecurity company as determined by the Consumer Technology Association. Each security must have a worldwide market capitalization of $250 million, have a minimum three-month average daily dollar trading volume of $1 million, and have a minimum free float of 20%.
Target Price: Reiterate $62; Rating: Two
Panic Point: Reiterate $48
RISKS: Cybersecurity spending, technology, and product development, the timing of product sales cycle, new products, and services in response to rapid technological changes and market developments as well as evolving security threats.
Labcorp Holdings Inc. LH; $229.89; 610 shares; 3.04%; Sector: Healthcare
UPDATE: We started the portfolio’s position in LH early in Q2 2024 and continued to build it up in April and May. At the start of August, Labcorp delivered a beat-and-raise quarter, but also adjusted its 2024 guidance to reflect the pending acquisition of medical genetics company Invitae. That acquisition closed during August, and with that behind us, we are doing catch-up work, lifting our LH price target to $255 from $235 to reflect Labcorp’s revised guidance and the incremental market opportunity Invitae brings with it. Reports of the summer spike in Covid cases and more recently the World Health Organization declaring mpox a global health emergency point to a pickup in testing activity at Labcorp. While we have yet to see Labcorp management appear on any September investor conference schedule, we’ll keep checking. We’d be interested in not only its integration and cross-selling plans for Invitae but also the degree to which Covid and mpox are driving testing activity. As LH shares move higher, we’ll revisit our current panic point.
1-Wk. Price Change: -0.4%; Yield: 1.3%
INVESTMENT THESIS: Labcorp is a global leader in innovative and comprehensive laboratory services that provides vital information to help doctors, hospitals, pharmaceutical companies, researchers, and patients make clear and confident decisions. By leveraging its diagnostics and drug development capabilities, the company provides insights and accelerates innovations to improve health and improve lives. The company is organized under two segments, consisting of Diagnostics Laboratories (Dx), which includes routine testing and specialty/esoteric testing, and Biopharma Laboratory Services (BLS), consisting of Early Development Research Laboratories and Central Laboratory Services. Our attraction to LH shares stems from the combination of the aging population driving diagnostic testing growth and the increasing array of diagnostic testing as well. That combination is expected to drive the healthcare testing services market to $12.6 billion by 2029, from $7.4 billion in 2024, according to Markets and Markets. To augment its position in oncology, women's health, autoimmune diseases, and neurology, the company has been expanding through acquisitions and partnerships with health systems and regional local labs.
Target Price: Reiterate $255; Rating: Two
Panic Point: Reiterate $190
RISKS: Macroeconomic factors, changes in healthcare reimbursement models and products, government regulations, product discontinuations or recalls.
Lockheed Martin Corp. LMT; $568.10; 247 shares; 3.04%; Sector: Aerospace & Defense
UPDATE: Shares of Lockheed (LMT) started to climb after reporting its June-quarter results that confirmed the re-start of F-35 shipments. LMT shares continued to catch additional air as we moved through August as the company continued to rack up new program wins, and ongoing geopolitical tensions pointed to more on the way. The ensuing overbought condition led us to lock in some gains at $548.37 on August 6 and with the shares still deeply overbought we rang the register again later that month. Following the U.S. government's F-35 Joint Program Office and Lockheed reaching an agreement for the acceptance and delivery of Technology Refresh 3 (TR-3) enabled F35 aircraft, we boosted our LMT price target to $575 from $540. This week, Lockheed was awarded $5.1 billion in Navy contracts that will add further to its multi-year backlog. That backlog was aided by the resumption of F-35 shipments should translate into ample earnings and cash over the next few years. Following the double-digit pop in the stock over the last few weeks, support clocks in around $505, a nice place to potentially pick up some shares compared to today’s overbought levels.
1-Wk. Price Change: 2.4%; Yield: 2.2%
INVESTMENT THESIS: Lockheed Martin is the largest defense contractor globally and has dominated the Western market for high-end fighter aircraft since the F-35 program was awarded in 2001. Lockheed's largest segment is aeronautics, which is dominated by the massive F-35 program. Lockheed's remaining segments are rotary and mission systems, which is mainly the Sikorsky helicopter business; missiles and fire control, which creates missiles and missile defense systems; and space systems, which produces satellites and receives equity income from the United Launch Alliance joint venture. Historically, the stability of defense spending has been a haven during periods of economic uncertainty, and we see that repeating once again even as geopolitical conflicts are likely to lead to incremental demand for Lockheed's products. The company has increased its dividend consistently over the last 19 years and is widely expected to boost it again in the coming days. In October 2022, Lockheed announced its board authorized the purchase of up to an additional $14.0 billion of LMT stock under its share-repurchase program.
Target Price: $575; Rating: Two
Panic Point: $475
RISKS: Contracts and budget risk with the U.S. government and the Department of Defense, F-35 program funding and renewal, competition, and subcontractor issues.
Mastercard MA; $483.34; 275 shares; 2.88%; Sector: Info. Tech
UPDATE: In our July monthly Roundup, we noted Mastercard (MA) shares had been rangebound between $430-$460, but that changed in August. The shares broke free to the upside, moving up toward the $480 level and closing in our $490 price target. This has MA shares approaching overbought territory as well, potentially leading us to revisit our current Two rating as well as locking in some of the low-double-digit gains put in over the last five weeks and even larger gains given our $360.93 average cost basis. Following the July Personal Income & Spending report, if we see August job creation and wage gains slow, it would be another reason for us to take some MA chips off the table.
1-Wk. Price Change: 3.6%; Yield: 0.5%
INVESTMENT THESIS: Mastercard is a card network company that benefits from the secular shift away from cash transactions and toward card-based and electronic payments. On Covid-19 dynamics, we view MA as a "reopening" play and an economic recovery play within technology because its cross-border volumes fell sharply during the pandemic but will rebound as mobility increases and travel restrictions ease. Mastercard has more international exposure relative to Visa (V), making its growth outlook more susceptible to new travel restrictions. However, we view MA as the better long-term play as we are betting on that inevitable recovery.
Target Price: Reiterate $490; Rating: Two
Panic Point: $400
RISKS: The recovery in cross-border transactions, regulation in the payments market, competition from other fintechs, and pricing pressures.
Meta Platforms META; $521.31; 110 shares; 1.24%; Sector: Communication Services
UPDATE: In late May, we added Meta to the Bullpen because we see the company well positioned to participate in the shift in advertising dollars to digital platforms, especially in a presidential election year. At that time, we indicated we would not rush to initiate a position, preferring instead to be disciplined buyers. In early August, the market pullback and oversold status of several Big Tech companies led us to establish a position in META shares with a $575 target. We like the company’s multiplatform offering which should allow it to outpace overall social media account growth. Per data from Meltwater, the number of active social media identities reached 5.17 billion in July, up 5.8% or 282 million new user identities over the last 12 months. When we pair this with market share data from GlobalStats, we find Meta’s platforms have been gaining share in recent months from Twitter/X, Pinterest (PINS), LinkedIn, and Tumblr. Soon after we added the shares, they quickly rebounded and climbed nicely higher but recently have started to trade off. We are interested in carefully building the portfolio’s META position, and we will be watching support levels near $504 and $492.
1-Wk. Price Change: -1.3%; Yield: 0.4%
INVESTMENT THESIS: Meta segments its business between Family of App Products, which includes Facebook, Instagram, Messenger, Threads, and WhatsApp, and Reality Labs Products, which includes its metaverse and investments and future product R&D. Family of Apps accounts for ~99% of company revenue and 100% of company operating profit. Substantially all of Meta’s revenue is currently generated from advertising on Facebook and Instagram. Family daily active people (DAP) was 3.27 billion on average for June 2024, an increase of 7% year-over-year. Meta forecasts capital expenditures of approximately $37 billion to $40 billion in 2024 and expects its capital expenditures to grow significantly in 2025 to support our AI research and product development efforts. Meta is positioned to benefit from the ongoing shift toward digital advertising and the adoption of AI across its product offerings. We recognize Meta is ramping capital spending as part of the current AI arms race, but we see that as an investment that should drive productivity in its core advertising business. As the company harvests that investment, we could see a step up in margins much like we saw in 2023.
Target Price: Reiterate $575; Rating: Two
Panic Point: $435
RISKS: Ability to add and retain users and user engagement; marketing spend; new products or changes to existing ones; competitive risk, geopolitical risk.
Microsoft Corp. MSFT; $417.14; 425 shares; 3.82%; Sector: Technology
UPDATE: Microsoft (MSFT) shares have been dancing around the 200-day moving average for a month now, effectively stuck in no man’s land between $390-$430. Turning to the technicals, the indicators are flat to neutral as well, reflecting the same sentiment as the price action. We picked up some Microsoft on the cheap earlier in the month on August 5, using the oversold market condition to bulk position. Entering August, Microsoft confirmed its fiscal 2025 capital spending will be above fiscal 2024. That was no surprise given growing speculation about Microsoft’s goal to double cloud revenue in the next few years. We continue to see Microsoft well positioned for AI adoption in the enterprise and cloud, and recent signs from ServiceNow (NOW), Salesforce (CRM), and others tell us that this is happening. While we have an almost full MSFT position in the portfolio, the shares have nice support at the 200-day moving average. Should that hold, it could prove to be a nice place for folks who are underweight MSFT shares to grab some. Microsoft will be presenting at the Citi Global TMT Conference on September 5, and what we learn could provide another reason for folks to pick up some additional shares.
1-Wk. Price Change: 0.1%; Yield: 0.7%
INVESTMENT THESIS: We believe the cloud to be a secular growth trend and that upside to the shares will result from Microsoft's hybrid cloud leadership as the company grabs market share in this expanding industry. While companies may look to build out multi-cloud environments, Microsoft's Azure offering will be a prime choice thanks to its decision to provide the same "stack" used in the public cloud, to companies for their on-premises data centers. Additionally, we would note that hybrid environments are currently the preference for most companies because they allow them to maintain critical data in-house while taking advantage of the agility and scalability provided by public clouds. Outside of the cloud opportunity, we maintain a positive view on the company's growing gaming business, which we believe is becoming an increasingly prominent factor in the Microsoft growth story as gaming becomes more mainstream, management works to convert its gaming revenue from one-time license purchase to a recurring subscription model and as technologies like augmented/virtual reality evolve. Finally, as it relates to LinkedIn and other subscription-based services such as O365 and various Dynamics products, we continue to value them highly for their recurring revenue streams, which, we remind members, provide for greater transparency of future earnings.
Target Price: $480; Rating: Two
Panic Point: Reiterate $350
RISKS: Slowdown in IT spending, competition, cannibalization of on-premises business by the cloud.
Morgan Stanley MS; $103.61; 1,705 shares; 3.81%; Sector: Financial Services
UPDATE: Morgan Stanley (MS) shares did not escape the early August market selloff but it did allow us to grow the portfolio’s exposure to them. During Q2 2024, Morgan Stanley collected the highest percentage of M&A fees (42%) with the silver medal going to Goldman Sachs (GS) (39%). Also benefiting both BofA and Morgan Stanley was the improving IPO activity and a rebound in U.S. corporate bond issuance during July. As we close the book on August, we’ll have a better indication of activity during the month and what’s to come in the ensuing months. June-quarter comments about investment banking backlogs at a number of firms suggest activity should continue to improve. Our thinking is that with the Fed signaling the start of its rate-cutting cycle, lower rates could add further fuel to that activity, especially ahead of the 2024 presidential election. Against that backdrop, should we see MS drift lower below $100 and potentially closer to $97, we may look to revisit our rating. We may even be inclined to add a few more shares.
1-Wk. Price Change: 1.7%; Yield: 3.6%
INVESTMENT THESIS: Morgan Stanley reports in three business segments: Institutional Securities (42% of trailing 12-month revenue, 38% of trailing 12-month Income Before Tax), Wealth Management (48%, 55%) and Investment Management (10%, 6%). While the IPO window has yet to reopen, the potential IPO class for 2024 continues to build with recent additions including Panera Bread, Reddit, Fanatics, and Skims, which is backed by Kim Kardashian. This along with the Fed increasingly likely to start cutting rates in H2 2024, suggests we are far closer to the IPO window opening on a sustained basis than we have been in some time. That would be a boon to private equity firms and others that have been nursing IPO candidates during the dark period and a positive for Morgan's investment banking business. Marginally lower rates could also generate a pick-up in M&A activity as the cost of capital with rates improving. As the Fed continues its cutting cycle to get rates back to normalized levels, that effort would also reduce rates for stock market alternatives, ones that quashed the "there is no alternative" trade earlier this year. That along with folks continuing to be behind in retirement savings bodes well for Morgan's wealth management business in the coming quarters.
Target Price: $120; Rating Two
Panic Point: $84
RISKS: Market and interest rate risk, credit risk, country risk, and operational risk, including cybersecurity.
PepsiCo Inc. PEP; $172.88; 800 shares; 3.00%; Sector: Consumer Defensive
UPDATE: Shares of this beverage and snacking company were little changed in August after climbing nearly 5% in July. Should September’s reputation as a challenging month for the market ring true and PEP shares pull back further, there is strong support between $168-$171 for the shares. At the same time, should comments from Kroger (KR) next week and the upcoming August Retail Sales report show the consumer shift to grocery and eating at home is accelerating, we may be inclined to pick up some additional PEP shares. As we’ve pointed out before, PepsiCo’s sales and earnings are back-half weighted with 57% of its sales on average coming in the September and December quarters and 31% of its annual sales in the December quarter. That has typically led PEP shares to perform well in the last few months of the year, and that’s what we aim to capture provided that narrative remains on track. Perhaps that is why PEP shares are one of Morgan Stanley’s highest conviction stocks.
1-Wk. Price Change: -1.7%; Yield: 3.1%
INVESTMENT THESIS: PepsiCo is one of the largest food-and-beverage companies globally. It makes, markets, and sells a slew of brands across the beverage and snack categories, including Pepsi, Mountain Dew, Gatorade, Doritos, Lays, and Ruffles. The firm uses a largely integrated go-to-market model, though it does leverage third-party bottlers, contract manufacturers, and distributors in certain markets. In addition to company-owned trademarks, Pepsi manufactures and distributes other brands through partnerships and joint ventures with companies such as Starbucks. The combination of the consumable nature of those products along with PepsiCo's ability to realize price increases has led to consistent revenue, EPS, and dividend growth during both the Great Recession and the Covid pandemic.
Target Price: Reiterate $185; Rating: Two
Panic Point: $148
RISKS: Economic conditions, supply chain constraints, raw material costs.
ServiceNow NOW; $855.00; 66 shares; 1.21%; Sector: Technology
UPDATE: We were fortunate enough to scoop up some shares of ServiceNow during the early June pullback, which proved to be a great move for the portfolio. While the shares bounced around amid AI adoption concerns in July following their commanding rise in June, ServiceNow’s June-quarter results laid that concern to rest. Like many other tech and AI-driven names, NOW shares sold off in early August but quickly rebounded that lost ground amid confirming data for the AI narrative and more importantly on signs of enterprise adoption. We were reminded of that this week with quarterly results from Salesforce (CRM), which shared its bookings doubled sequentially leading it to sign 1,500 AI deals in the July quarter alone. That sets the stage for ServiceNow presenting next week at the Citi Global Technology Conference. Based on comments about customer activity, AI adoption and pricing pull-through, we’ll revisit our $900 target as needed. During one of our August Office Hours, we said that we wished we had bought even more shares than we did back in early June. While we can’t go back in time, we will keep our eyes open for opportunities to add to the position.
1-Wk. Price Change: 3.2%; Yield: 0.0%
INVESTMENT THESIS: The addition of ServiceNow adds exposure to the enterprise as it deploys AI-enabled solutions across its enterprise workflow platform. The company’s “Now Platform” is a cloud-based solution with embedded AI and machine learning (ML) capabilities that help unify and digitize workflows, driving productivity. At the heart of it, the company’s platform automates workflows across an entire enterprise by connecting disparate departments, systems, and silos in a seamless way to unlock productivity. ServiceNow counts more than 8,100 global customers, including 85% of the Fortune 500, with 97% of its revenue from subscriptions that have notched a 98% renewal rate.
Target Price: Reiterate $900; Rating: Two
Panic Point: $675
Waste Management WM; $212.04; 530 shares; 2.42%; Sector: Industrials
UPDATE: Shares of Waste Management (WM) recovered some of the lost June-quarter earnings ground in August. While we are close to our $220 price target, Stericycle (SRCL) shareholders voted to approve the merger with Waste. We’ve had a favorable view on that transaction as it expands Waste’s addressable market, and we see the opportunity for the disciplined Waste management team to trim costs and lift Stericycle’s margins. We look forward to Waste’s formal integration plans, which could be a catalyst for us to lift our price target. We continue to see Waste benefiting from the eventual Fed rate-cutting cycle and the ensuing rebound in housing construction and lower hurdle rates for nonresidential construction.
1-Wk. Price Change: 1.0%; Yield: 1.4%
INVESTMENT THESIS: 2024 will see more nonresidential construction activity because of the Biden Infrastructure Law, but now we can finally factor in activity for the CHIPs Act, which saw its first award this week. Other potential drivers include spending associated with the Inflation Reduction Act, including the much-awaited start of building out a nationwide network of EV charging stations. Recently President Biden announced an $8.2 billion passenger rail project, which will likely take several quarters to come onstream, leading us to think it's more of a 2025 catalyst. Alongside that bright outlook for WM's commercial business, automation efforts and pricing power in its sticky residential business should drive margins and EPS generation higher in the coming quarters.
Target Price: Reiterate $220; Rating: Two
Panic Point: $183
RISKS: Industry and economic risk, competition and competitive pressures, and acquisition risk.
THREEs
Elevance Health ELV; $556.89; 230 shares; 2.77%; Sector: Health Care
UPDATE: August was a very good month for shares of Elevance Health, despite the company not making much noise. While it did launch launched Elevance Connect, a digital health platform offering personalized health management tools, and virtual care services, the move in the shares tracked the rising popularity of Democratic presidential candidate Kamala Harris. Previously Harris supported “Medicare for All” but as we’ve seen she is no longer championing that effort, with the campaign now signaling a more pragmatic approach is likely. That August move in ELV shares pulled them to less than 2% of our $560 price target, leading us to trim back the position and lock in some gains as we downgraded the shares to a Three rating. As we move closer to the election and the campaign conversation expands, we’ll continue to listen for what’s said about healthcare and Medicare. Should ELV shares continue to trend higher into that conversation we may milk the position further.
1-Wk. Price Change: 2.0%; Yield: 1.2%
INVESTMENT THESIS: Elevance, formerly Anthem/Blue Cross Health, is a premier healthcare brand that appears to be in the sweet spot for HMO companies. Mostly domestic, this company has a wide reach and coverage across the U.S., serving more than 118 million people via medical, pharmacy, clinical, and care solutions. Founded in 1944, Elevance offers a terrific business model that works in boom or bust economic times. The opportunity to find a company with reliable and dependable revenue and cash flows is right here with Elevance. Revenue growth for this company has surged in recent years, with better than double-digit growth since 2018 as the company thrived during the pandemic.
Target Price: Reiterate $560; Rating: Three
Panic Point: $450
RISKS: With any insurance business the risk is high for changes in regulation and government programs. Since the onset of Obamacare more than 10 years ago, companies like Elevance have changed their model to be more in line with a better cost/benefit analysis, reducing waste and squeezing out excesses (as was outlined and suggested in Obamacare). Separately, as the population increases and ages, there is more opportunity for Elevance to grow, but with those changes, there is a risk. Lastly, competition is brisk with some very strong opponents who keep their costs low (Humana, Cigna, UNH, CVS/Healthnet).
United Rentals URI; $741.26; 148 shares; 2.35%; Sector: Industrials
UPDATE: After bottoming near $640 in early August, URI shares rebounded handsomely over the ensuing weeks amid growing market enthusiasm for Fed rate cuts and their implications. During the week, Morgan Stanley shared it sees a cement “super cycle” forming over the next several years that should drive consistent low-single-digit demand growth over the 2025-2030 period. We connected those dots to infrastructure spending and an expected rebound in housing construction, both of which should benefit from the Fed entering a rate-cutting cycle. The next catalyst we will be watching will be next week’s July Construction Spending report. The confluence of summer weather and infrastructure spending dollars should yield a favorable report, but because we will soon lap infrastructure spending programs, before too long we will start to see more difficult year-over-year comparisons in the data. That’s a potential headwind for those infrastructure-related names, like United Rentals, that have soared over the last two years and have been a powerful contributor to the Portfolio. Should we see URI shares approach our price target or once again enter overbought territory, they could be a source of funds for the portfolio.
1-Wk. Price Change: -0.5%; Yield: 0.9%
INVESTMENT THESIS: United Rentals, the largest equipment rental company in the world, operates throughout the United States and Canada, and has a limited presence in Europe, Australia, and New Zealand. It serves industrial and other non-construction; commercial (or private non-residential) construction; and residential construction. Industrial and other non-construction rentals represented approximately 50% of rental revenue, primarily reflecting rentals to manufacturers, energy companies, chemical companies, paper mills, railroads, shipbuilders, utilities, retailers, and infrastructure entities; commercial construction rentals represented approximately 46% of rental revenue, primarily reflecting rentals related to the construction and remodeling of facilities for office space, lodging, healthcare, entertainment, and other commercial purposes; and residential rentals around 4% of revenue. We see the company benefiting on three fronts — the seasonal uptick in construction spending; the release of funds and projects associated with the five-year Biden Infrastructure Bill; and the company's nip-and-tuck acquisition strategy that should further enhance its geographic footprint.
Target Price: Reiterate $775; Rating: Three
Panic Point: $585
RISKS: Industry and economic risk, competition and competitive pressures, and acquisition risk.
