Chart of the Day: Nvidia Is the Show of Strength Everyone Wants to See
The technicals tell us the bulls should have nothing to worry about, but what will earnings say?
You've reached your free article limit
You've read 0 of 1 free Pro articles.
This is a big week for earnings. But no company is likely to matter more than Nvidia NVDA.
NVDA has been coasting through the summer as it moves up and down with the markets, but has found some good support earlier this month around the $100 level. The stock remains bullish, even after that moderate corrective phase.
Some big hedge fund managers also revealed recently that they sold significant amounts of Nvidia over the second quarter. Those decisions were likely made after large gains from holding the stock, so that should not come as a surprise move. We believe the stock has plenty more left in the tank to move higher.
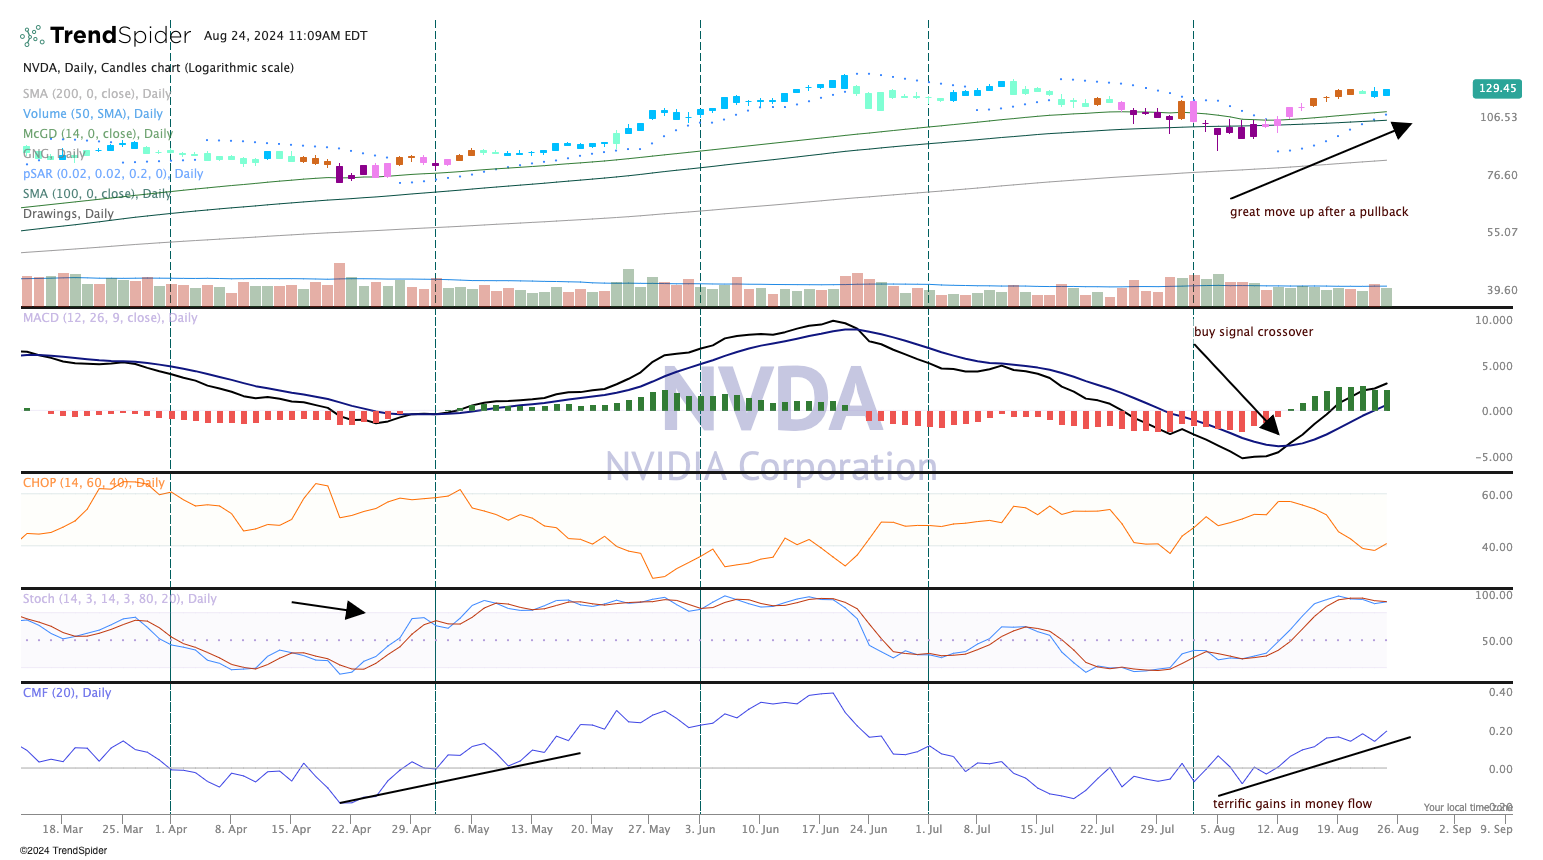
The technical indicators are strong. First, the parabolic stop and reverse, or SAR, is bullish after a few days in the bearish column.
And, notice that the candles in the top pane of the chart above are blue, which is strongly bullish on the GoNoGo composite of indicators.
At the same time, the moving average convergence divergence indicator, or MACD, is on a "buy" signal. Stochastics, or momentum, as seen in the fourth pane, is overbought. That's not a reason to sell.
Finally, money flow, as seen in the bottom pane, has shown strong improvement and is bullish. With a favorable earnings report this stock is poised to make a run at new highs.
Expect to see lots of volatility leading up to Wednesday evening. We rate Nvidia a "One" in TheStreet Pro Portfolio, or a "buy at anytime."
TheStreet Pro Portfolio is long NVDA.
