Chart of the Day: ServiceNow Shows a Bull Flag
A break higher and this stock will make a run at the old highs and beyond.
You've reached your free article limit
You've read 0 of 1 free Pro articles.
ServiceNow NOW has been one of the better performers in TheStreet Pro Portfolio since we added the name back in June. We are sporting a 25% gain since then, much better than the S&P 500 index and Nasdaq as well.
While we are pleased with the selection and the performance of NOW, we are always vigilant and watching the name (and others) closely. A large win over a short period of time can be stripped away very quickly if you're not careful. We have considered trimming the stock, and so should you.
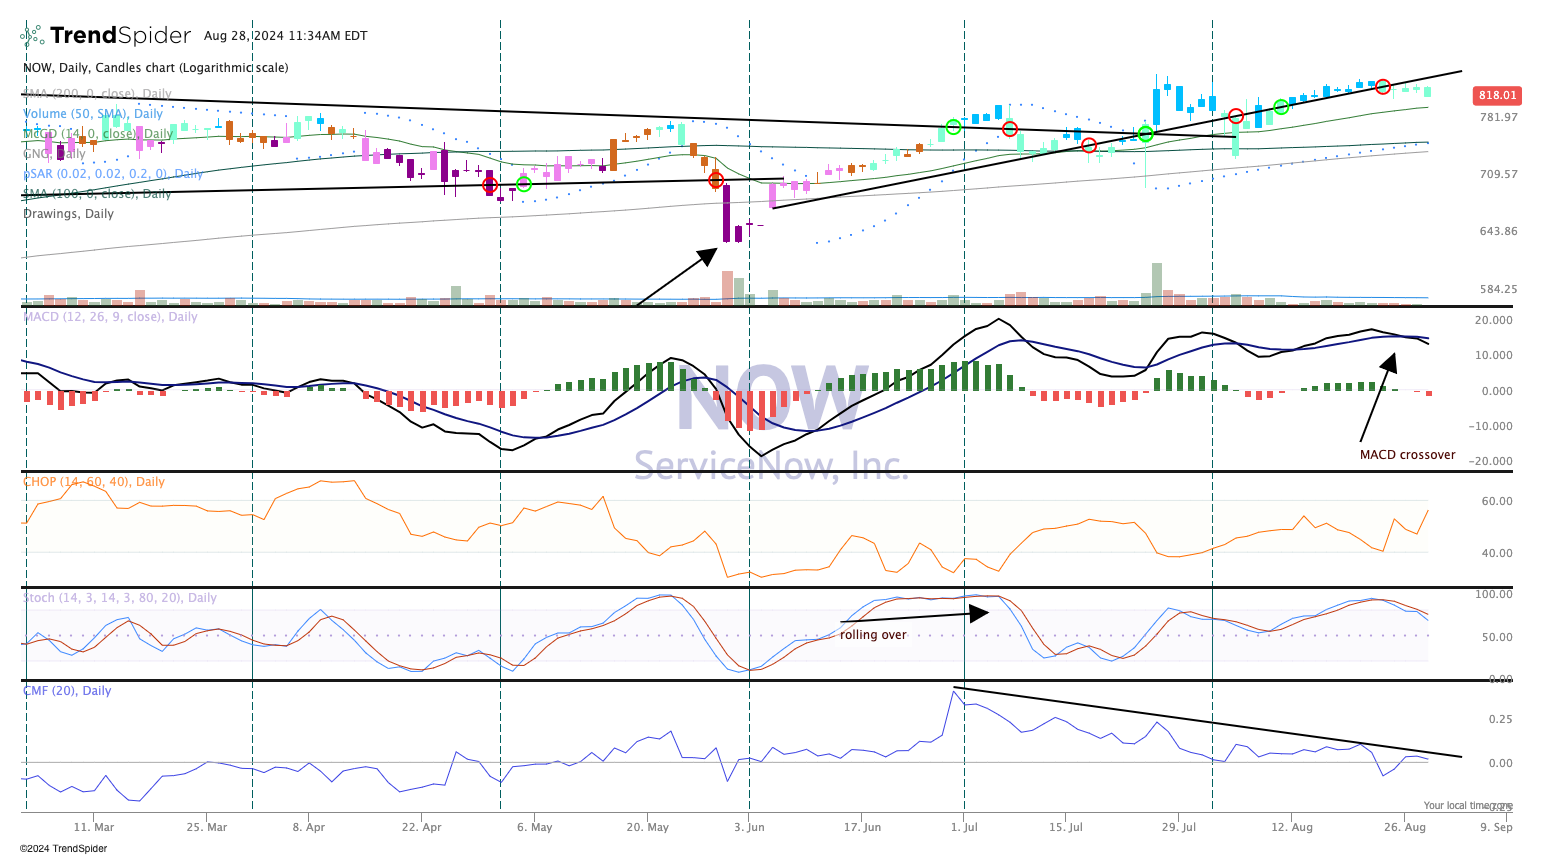
The chart shows a very bullish price move. The pattern is looking to play out as a "buy the dip" scenario. The current pullback is constructive, on low turnover. That means big institutions are not selling the stock.
Not all is grand, however, as the Moving Average Convergence Divergence (MACD) is on a sell signal crossover while the stochastics (momentum) are rolling over. Money flow is leaking as well (bottom pane), so there could be trouble with NOW if the price breaks.
Still, with the stock holding up strong of late there is some bullish action yet to be discovered. If the price clears $840 then we are looking at a move to $1,000 eventually, perhaps by year-end.
We rate ServiceNow a Two in TheStreetPro Portfolio, or stockpile on pullbacks.
More Pro Portfolio:
- We're Drinking Up More Shares of This Coffee Chain
- Weekly Roundup: Powell’s 'Adjustment' Drives the Market and Portfolio Higher
- Cash-Strapped Consumers, Mortgage Rate Lows: The Latest Signals Informing Our Strategy
At the time of publication, TheStreet Pro Portfolio was long NOW.
