Charting the Markets: S&P 500 Is Nearly at a Corrective Phase
Another down week will cinch the move but then some ‘up’ likely follows.
You've reached your free article limit
You've read 0 of 1 free Pro articles.
One indicator I use to help me judge the condition of the market (bull or bear) is fractals. Now, without getting too much into the analysis if we simply look at fractals as a five-bar sequence we can see patterns develop.
I see a fractal that developed on this S&P 500 weekly chart and it could be finishing up by the end of this week. Then perhaps we start a new fractal to the upside.
It’s important to point out that fractals are not 100% guaranteed and actually have a two-bar lag, so in our chart that is two weeks. Plenty can happen in that time, but suffice to say with the last four bars of lower highs and lower lows and stopping at the lower Bollinger band (Thursday’s low), we could be ready for some bullish action.
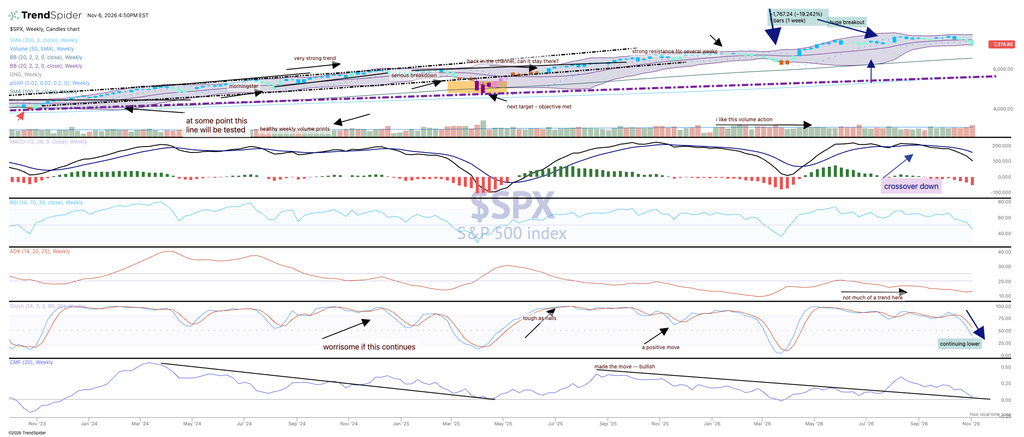
Admittedly, the trend is still bearish, and while the candles are teal that simply means cautiously bullish, which has not helped the bulls the prior three weeks.
All indicators are nose-diving starting with MACD. Money flow is about to go bearish, momentum has left the building and the parabolic SAR (stop and reverse) just went bearish for the first time since April. That bearish stint did not last for too long, though; the chart was in a similar position back then as it is now (just before turning neutral, big purple arrow).
Stay nimble and wait for the market to tell you where it is going.