Charting the Markets: S&P 500 Muscles Its Way Higher
A new weekly closing high may just be the start of a bigger move.
You've reached your free article limit
You've read 0 of 1 free Pro articles.
The first trading week of October was certainly filled with excitement. Following a strong finish in September it seemed the new month was ready to "carry the mantle" of higher prices towards a new high and perhaps an historic run to 6000 on the S&P 500. But some volatility kicked in and with it came some nervous traders, who decided it was better to wait rather than guess where the trend was headed.
Certainly that was the more cautious approach but as we moved through the week towards the important September jobs report, it seemed as if the sellers were finished up and the bulls were just waiting for that catalyst. Friday was a strong day for the markets even though volatility was present, which is elevated in front of the election coming up soon.
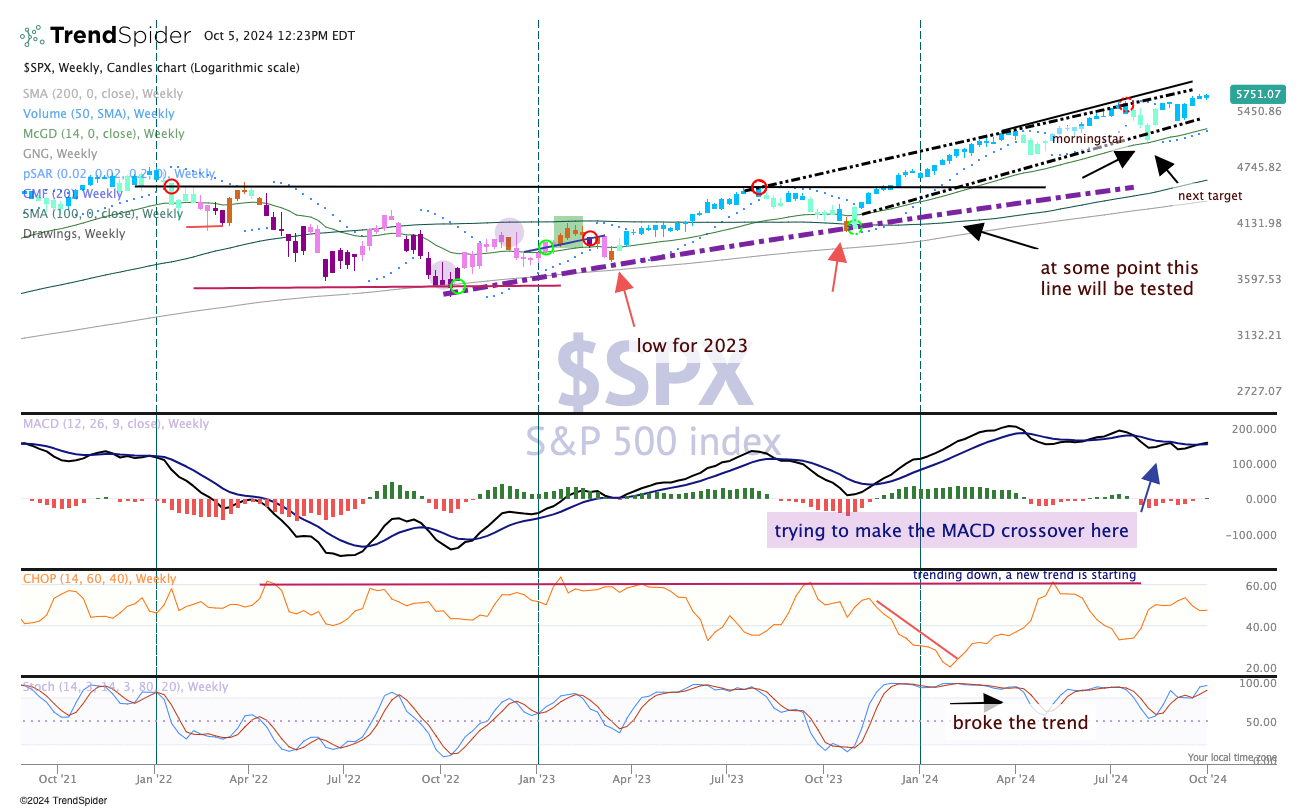
As we see in the chart, above, the channel remains alive. The S&P 500 continues to make higher highs and higher lows, though the range each week is quite narrow. Moving Average Convergence Divergence (MACD) is back on a buy signal, and stochastics (momentum) are moving higher again.
With earnings season nigh we could see a nice run higher this month as seasonal trends improve for the bulls.
