Can the Market Regain Its Upward Momentum Without the Semiconductors?
The semiconductors helped push the S&P 500 to new highs back in May, but they’ve since lost momentum. Can the S&P rally without the semis?
You've reached your free article limit
You've read 0 of 1 free Pro articles.

Note: I am still on vacation and this edition of TopStocks is combined with my normal Monday column. The next edition will be one week from today.
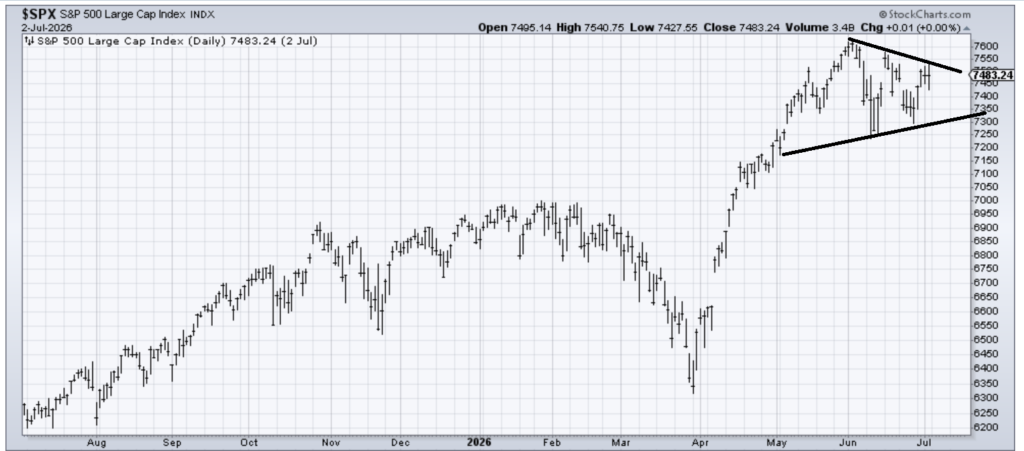
When I step back and look from a distance, I am reminded that the market got intermediate-term overbought in mid-May. And then I look at the S&P and see that it is trading at 7500, where it was in mid-May.
Remember, an overbought market is one that loses upside momentum, and this one certainly has. The question is if it has digested that enough to consider a move above that upper line a breakout that now has momentum. I think the answer is still no.
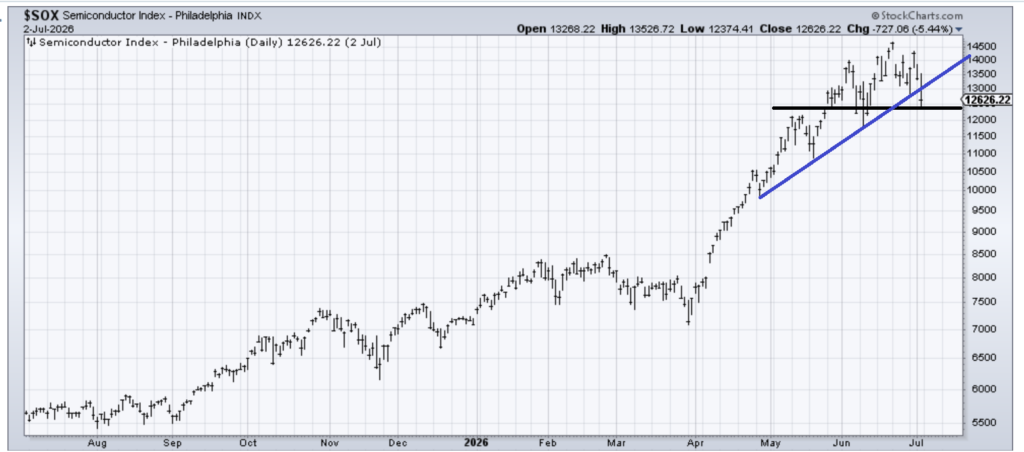
There is, though, the chart that matters most to the big-cap indexes, and that is the chart of the SOX. It is above where it was in mid-May, but alas, not much, and it turns out it is now trading where it was in late May. So now the SOX has six weeks of no upside momentum.
I suspect many will fuss over the blue line being broken (as they should), but as I have said countless times, it takes lower lows and lower highs to matter. We have a minor lower high last week, but thus far, that mid-May low around 11750 hasn’t broken. I suspect it will.
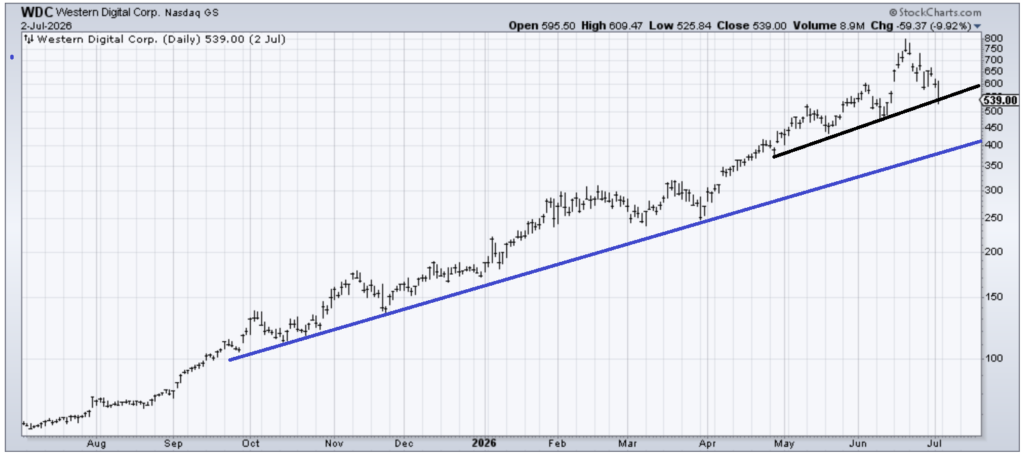
Let’s go back to the chart of Western Digital (WDC), which I noted about two weeks ago had finally gone a little parabolic and then had that day where it closed on the low, from 800 to 750. It is now down 30% from that time, which is quite a bit, but still is holding that uptrend line. It is short-term oversold (clearly), but I suspect over the next several weeks (after a short-term bounce), it makes its way toward the more solid blue uptrend line.
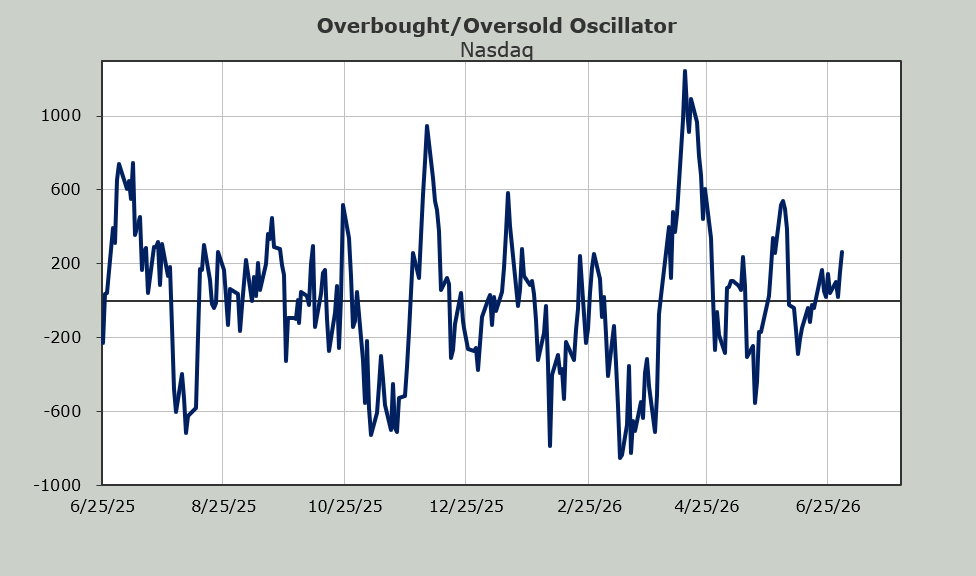
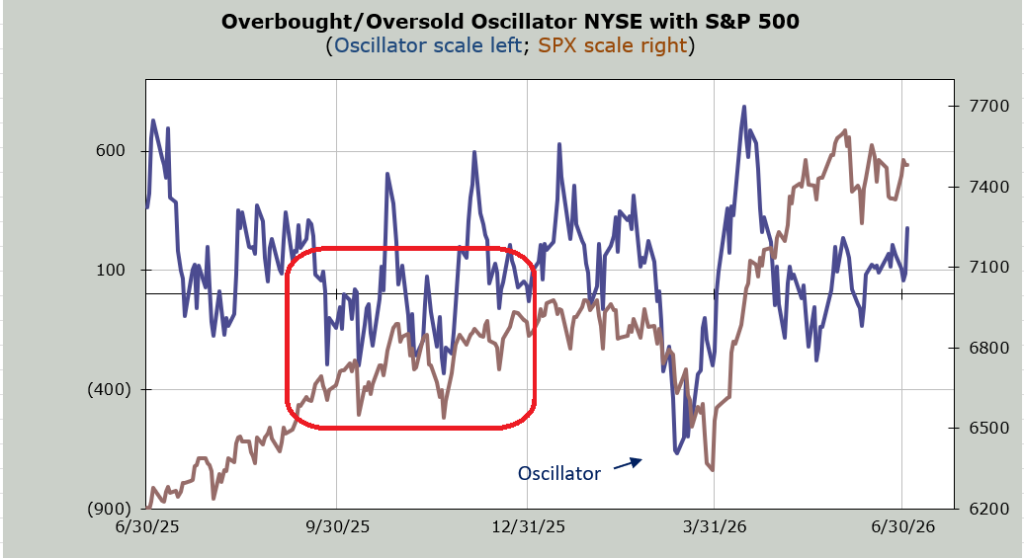
For weeks now, I have said I thought my Overbought/Oversold Oscillator would resemble that period from last fall (red box), and so far it has been doing so. The Russell 2000’s Momentum Indicator reached an overbought condition in late June (and has been milling about this 3000 area for over a week now), and I expect it will continue to exhibit signs of short-term overboughtness.
Perhaps the new quarter will continue what it started late last week with the rotation into the down and outs (yes I still think IGV’s June swoon was ‘aversion’ on the Sentiment Cycle chart) but what strikes me is not so much the rotation but the fact that so many of these big index-moving names have done nothing for nearly two months and yet the rotations into the others has each group getting love for a week or so and then, well, it’s over. Oh, there are exceptions like the drugs (finally!), but the banks? They had a great run and have been stalled for a couple of weeks now.
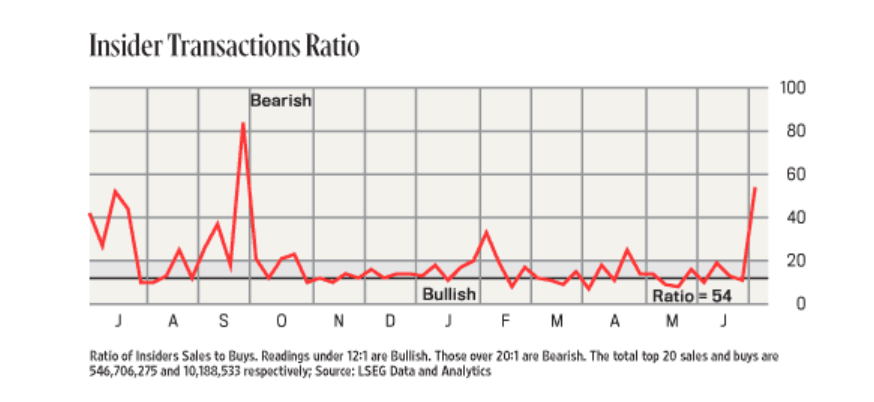
Sentiment is mixed. It got giddy two weeks ago, and then we had a minor swoon, and folks pulled in their horns again. The only serious change is that the Insider selling (relative to buying) has picked up for the first time in nearly a year. There is no timing to this, but it is the first big spurt upwards since late September.
The best I can tell is that we should keep that Oscillator chart in our minds. I think we continue to oscillate with few extremes. If we go down this coming week, we’ll get oversold quickly, and if we go up, we’ll get overbought quickly. And I suspect sentiment will follow suit with folks getting giddy on a rally and bearish on a decline.