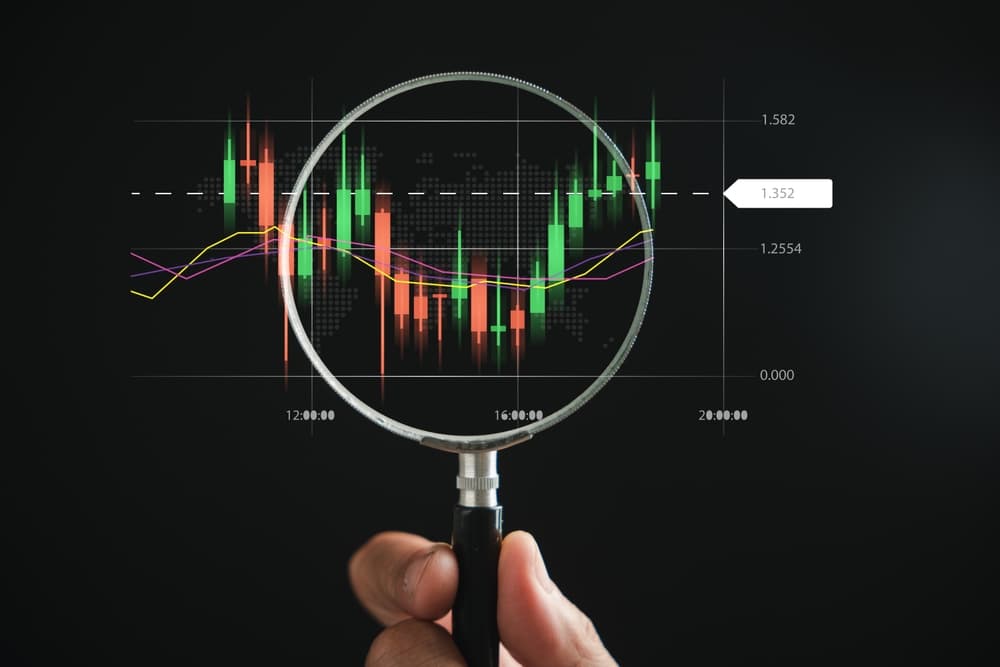
Stock Charts Aren’t Crystal Balls, but They Are Powerful Trading Tools
Let’s see how charts, when used properly, can provide a framework that traders can act on.
You've reached your free article limit
You've read 0 of 1 free Pro articles.
My view of charts has changed substantially over my years as a trader. They are still my primary tool, but I view them totally differently than I once did. Charts have some substantial limitations that many traders fail to recognize.
The conventional view of charts is that their primary benefit is as a pattern-recognition device. If the pattern is bullish, you buy, and if it’s bearish, you sell. It is a black-and-white, good-or-bad decision and has appeal, because it is simple to understand and easy to execute.
The reality is that chart patterns have only a weak correlation with future price action, and results vary significantly across time frames. If there were a strong correlation, it would be easy to use AI to master the market. Just go hang out at the beach and let Claude’s Cowork function find the right “bullish” patterns, buy them, and then wait for the profits to roll in. What could possibly go wrong?
One of the main reasons it doesn’t work is that everyone knows which setups are favorable. When everyone is aware of something in a market, it generally stops working, because there are always traders looking to jump ahead of the crowd. They don’t wait for the breakout to buy. They anticipate the breakout and then sell when it occurs.
The Soros Approach
In an interview a few years ago, George Soros said, “Financial markets are usually unpredictable. So one has to have different scenarios. The idea that you can actually predict what will happen contradicts my way of looking at the market.”
Soros did not view a chart as providing special insight into future price movement. He viewed charts as providing a framework for a “system of reactions.” What does that mean and how does it work?
The issue to consider if you view a chart as an exercise in pattern recognition is “what does this pattern predict”? The answer is regarded as an actionable, valid forecast. The trader takes a position based on the forecast and hopes it is right.
If charts are viewed as a system of reactions, then the question is, what should I do if the price does X, Y, or Z from here? It embraces the idea of many different outcomes. It is not a binary situation of being right or wrong. It is a process of adjusting depending on whatever might develop.
For the reactive trader, the action that occurs after the initial buy triggers further action. The trader takes a small initial position, watches for the price to trigger one of the potential outcomes, and then executes. The trader is never invested in a forecast because the trader never made one.
Soros made billions using this thinking. He did not predict what a stock would do. He reacted to what it actually did. If it did something positive, he bought aggressively. If it did something negative, he dumped it. There is a whole range of reactions in between. This is the basis of one of his quotes, which is central to my trading: “It doesn’t matter whether you are right or wrong. What matters is how much money you make when you are right and how much you lose when you are wrong.”
Soros is also famous for his theory of reflexivity. A rising stock price attracts more buyers, which raises the price further, which attracts more buyers. A falling stock price triggers selling, which pushes the price lower, which triggers more selling. The relationship between price and reality is a two-way street. Price affects reality just as much as reality affects price. This explains why momentum can produce such powerful moves. Soros once said that when he sees a bubble, he rushes to buy.
Reflexivity has a direct implication for the way you read a chart. A chart is not a snapshot of a stable underlying reality that can be used to make a forecast. A chart is a picture of the interaction between price and participant behavior.
The technical levels on a chart are the key prices at which people acted before. Support is where buyers stepped in. Resistance is where sellers came out. A breakout is not a promise of higher prices. It is a signal that participant behavior around that level has changed.
Reflexivity also explains why the pattern approach so often fails. If chart patterns were stable predictors of future price movement, everyone would follow them and they would work. But the pattern becomes unstable because everyone acting on it changes what it means. Traders anticipate the breakout and buy before it happens, which either causes it to occur prematurely or exhausts the buying pressure before it can be sustained. The pattern becomes self-defeating precisely because it is widely known.
A trading approach that uses a system of reactions is not vulnerable to the same problem, because it does not depend on the pattern working. The reactive trader does not need the breakout to happen. The reactive trader has a response prepared regardless if the breakout happens or fails. Either outcome is tradable because both were considered in advance. Soros was never betting on a specific outcome. He was prepared for every outcome.
Charts as Decision Architecture
I don’t want to get too detailed with the Soros theories, but his thinking underpins one of the most important issues in trading: being reactive rather than anticipatory. Wall Street is primarily focused on predicting the future. Predictions are good for business, but the folks who consistently make money laugh at predictions. They are focused on reacting aggressively to changing conditions.
The professional trader looks at the chart and says: If the stock breaks above this level on volume, I add. If it breaks below that level, I sell. If it gets to that area, I take partial gains. None of these are predictions. They are predetermined conditional responses, with the chart as the trigger that fires each one. The amateur looks at the same chart and sees a bullish setup, positive momentum, and a good-looking chart. Those are hopes and dreams, not decisions.
The distinction sounds like semantics, but it produces different behavior. The trader who treats the chart as a forecast holds through stops. The trader who treats the chart as a system of reactions sells at the stop, because that is what the system requires.
A chart is not a magical device that predicts the future. The chart is a roadmap for how you respond to what happens. The trader who internalizes that distinction has a different relationship with their charts, their positions, and their losses. That is how Soros built his fortune, and it is what separates the professional from the amateur.
At the time of publication, DePorre had no position in any security mentioned.
